Improving Health Care Worker Seasonal Influenza Vaccination at


 Ø Residency program directors provided documentation of residents vaccinated at affiliated sites.")

 % Contact Staff Contact Adult Medicine Clinic 10")


 • During the 2008 -2009 influenza season, 81. 9% of employees were")
, 92. 2% were contacted and the total vaccination")


- Slides: 29
Improving Health Care Worker Seasonal Influenza Vaccination at University Health System Presented by Jose Cadena, MD- Asst. Professor, Infectious Diseases, UTHSCSA Amruta Parekh, MD, MPH – Education Development Specialist, UTHSCSA Work supported by UT System, UTHSCSA, IHI/Macy Foundation, VA Educating for Quality Improvement & Patient Safety
Objectives • Describe the quality chasm in healthcare • Identify our local efforts to narrow the chasm • Illustrate spread of quality and safety principles at our institution using a QI project as a paradigm Educating for Quality Improvement & Patient Safety
Team UTHSCSA Jan Patterson, MD –Medical Director, Infection Control Jose Cadena, MD – ID physician Jason Bowling, MD - ID fellow Amruta Parekh, MD, MPH – Educational Development Specialist UHS Beth Ann Ayala, MT(ASCP), MS, MBA, CIC - Director, Infection Control Teresa Prigmore, MHA – Director, Employee Health Priti Mody-Bailey, MD – CMO, Community Medicine Associates Leni Kirkman – Director, Corporate Communications Theresa Scepanski – VP Human Resources
Background HCW with influenza can infect patients. Infectiousness begins 1 day before symptoms. Up to 50% of infections may be subclinical. Seasonal influenza vaccine is 70 -90% effective in preventing infection in healthy adults and reduces absenteeism. • ACIP, SHEA, and IDSA recommend immunization of all HCW. • National average HCW vaccination < 50%. • •
Available at NIAID; http: //www 3. niaid. nih. gov/topics/Flu/understanding. Flu/community. Immunity. htm. Accessed on 10/14/2009
University Health System Previous seasonal influenza vaccination rates were < 60% for University Health System (UHS) – 58. 8% 2008 -09 season – 58. 5% 2007 -08 season – 45. 0% 2006 -07 season
University Health System • – – UHS is a 500 bed tertiary care hospital Solid organ transplant program Hematology oncology unit Level 1 trauma unit Neonatal ICU
Aim Statement To improve the UHS employee seasonal influenza vaccination rate to 80% or more by December 2009 at UHS for the 2009 -2010 influenza season. Educating for Quality Improvement & Patient Safety
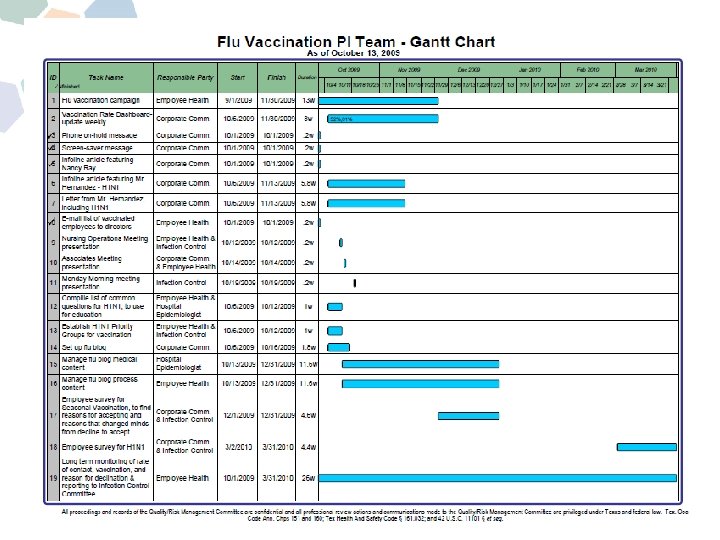
QI Methodology • • • Interprofessional and multidisciplinary teamwork Brainstorming Getting the Board on board Process flow Cause & effect diagram Data collection Audit feedback Control chart, Pareto chart, Gantt chart Plan – Do – Study – Act cycle
Select definitions • 80% was chosen as the goal because there is evidence of “herd” immunity at this level of vaccination. • “Contacted” was defined as documentation received by employee health that the HCW received or declined vaccine.
Cause and Effect Diagram
Process Flowchart
Force Field Analysis
Interventions • Interventions were prioritized using the Focusing Matrix of importance vs. ease of intervention. September – November 2009 • Audit/feedback data by unit ØSent to unit directors & residency program directors in dashboard format Ømade available on-line Educating for Quality Improvement & Patient Safety
Interventions(Contd. ) Ø Residency program directors provided documentation of residents vaccinated at affiliated sites. Ø Volunteers recruited to increase access to vaccination on the units and at conferences Ø Hospital educators promoted educational campaign. • Follow up, October – December 2009 • Priority units of the hospital with low rates of vaccination were identified. • Vaccine was redistributed to units as needed. Educating for Quality Improvement & Patient Safety
Additional Interventions • An influenza website, including FAQs and flu blog • Photos of UH leadership getting vaccine on the website and in UHS newsletter. • Weekly updates of rates by department posted on line and emailed to unit managers. • Screen savers and telephone on-hold message. • A letter from the CEO was sent to employees.
Audit Feedback Weekly Dashboard(10 -11 -2010) % Contact Staff Contact Adult Medicine Clinic 10 10 100. 0% 70. 0% All Housestaff 741 380 51. 3% 50. 7% Anesthesiology-UH 14 14 100. 0% 78. 6% CMA Clinic Operations-UFHCSE 51 51 100. 0% 96. 1% Emergency Center 143 142 99. 3% 81. 1% Environmental Services-UH 113 105 92. 9% 74. 3% General Medicine 96 92 95. 8% 64. 6% Hartman Surgical Pavilion 83 82 98. 8% 69. 9% Labor & Delivery 35 35 100. 0% 80. 0% Medicine Critical Care Unit 64 54 84. 4% 71. 9% Neonatal Icu 89 87 97. 8% 86. 5% Obstetrics 52 45 86. 5% 80. 8% Obstetrics Clinic 26 26 100. 0% 92. 3% Operating Room 120 107 89. 2% 70. 8% Outpatient Surgery 28 26 92. 9% 89. 3% Renal Dialysis-Outpatient UH 29 25 86. 2% 51. 7% Renal Dialysis-UCCH 38 33 86. 8% 71. 1% Special Surgery 101 100. 0% 73. 3% Surgery Icu 104 102 98. 1% 80. 8% Department Name % Vaccinated
Nancy Ray, COO of UHS getting vaccinated
Results • From Sept. - December 1 2009, the seasonal influenza vaccination rate was 76. 6% (4271/5578). • Of these 67. 5% received vaccination at UHS, 9. 1% received vaccination from other providers. • Among the 92. 4% contacted, 82. 9% (4147/5578) received vaccination and 863 (17. 1%) declined vaccination.
Results(contd. ) • During the 2008 -2009 influenza season, 81. 9% of employees were contacted for influenza vaccination. • Total vaccination rate was 58. 8%: 54. 4% accepted vaccination at UHS, and an additional 4. 4% received vaccination outside UHS.
• After interventions (September-November 2009), 92. 2% were contacted and the total vaccination rate increased to 76. 6%, a 17. 8% increase from the pre-intervention period (OR 2. 7, 95% CI 2. 5 -2. 97, p: <0. 01).
Control Chart UHS HCW Influenza Vaccination Rate
Pareto Chart Reasons HCW Declining Flu Vaccine at UHS 100. 0% 0. 35 90. 0% 85. 1% 0. 30 80. 0% 70. 0% 0. 25 65. 2% Defects 60. 0% 0. 20 50. 0% 0. 15 0. 14 40. 0% 39. 9% 30. 0% 0. 09 0. 10 0. 07 0. 05 20. 0% 0. 05 10. 0% 0. 00 0. 0% Fear of getting the flu Side Effects Doubt effective Reasons Contraindications
Discussion • Inter-professional QI team using QI tools significantly increased the HCW influenza vaccination rate. – Narrowed the “knowing vs. doing” gap • Vaccination rate still < 95% • SHEA, IDSA, AAP recommending mandatory influenza vaccination in HCW
Discussion • Inter-professional QI team using QI tools significantly increased the HCW influenza vaccination rate. – Narrowed the “knowing vs. doing” gap • Vaccination rate still < 95% • SHEA, IDSA, AAP recommending mandatory influenza vaccination in HCW
Future Direction • Increase the employee flu vaccination rate to > 85% for the 2010 -2011 season • Increase the rate of “contact” with those individuals that did not respond • Emphasize education discussing those subjects that lead to declination • Consider mandatory vaccination as now recommended by IDSA, SHEA, ACIP, AAP
Mandatory Vaccination • Recommended by the IDSA, SHEA. • The BJC Healthcare experience: – 26, 000 employees, 98. 4% were vaccinated and only 8 (0. 03%) were terminated. • The Hospital Corporation of America (2009): – HCW of 163 hospitals, 112 outpatient centers and 368 physician practices. >140, 500 employees ! – Vaccine or surgical mask during season – Vaccination rate : Pre intervention (2008 -2009): 58% vs 2009 96% Babcock et al. Clin Infect Dis. ; 2010; 50: 459 -464. Cormier SB et al. Fifth Decennial International Conference on Healthcare-Associated Infections. Atlanta GA, 2010.
References 1. Molinari NA, et al. The annual impact of seasonal influenza in the US: measuring disease burden and costs. Vaccine 2007 Jun 28; 25(27): 5086 -96. 2. Salgado CD, et al. Preventing nosocomial influenza by improving the vaccine acceptance rate of clinicians. Infect Control Hosp Epidemiol 2004 Nov; 25(11): 923 -8. 3. Pearson ML, et al. Influenza vaccination of health-care personnel: recommendations of the Healthcare Infection Control Practices Advisory Committee (HICPAC) and the Advisory Committee on Immunization Practices (ACIP). MMWR Recomm Rep 2006 Feb 24; 55(RR-2): 116. 4. Caban-Martinez AJ, et al. Sustained low influenza vaccination rates in US healthcare workers. Prev Med Jan 15. 5. Kohn KT CJ, Donaldson MS. To Err Is Human: Building a Safer Health System. Washington, DC: National Academy Press, 1999. 6. Leape LL, Berwick DM. Five years after To Err Is Human: what have we learned? JAMA 2005 May 18; 293(19): 2384 -90. 7. Hannah KL, Schade CP, Cochran R, Brehm JG. Promoting influenza and pneumococcal immunization in older adults. Jt Comm J Qual Patient Saf 2005 May; 31(5): 286 -93. 8. Nowalk MP, et al. Improving influenza vaccination rates in the workplace: a randomized trial. Am J Prev Med Mar; 38(3): 237 -46. 9. Stewart AM. Mandatory vaccination of health care workers. N Engl J Med 2009 Nov 19; 361(21): 2015 -7. 10. Loeb M et al. Surgical Mask vs N 95 Respirator for Preventing Influenza Among Health Care Workers A Randomized Trial. JAMA. 2009; 302(17): 1865 -1871