Impact 360 Workforce Optimization Presenter Title Event if
- Slides: 37
Impact 360 Workforce Optimization Presenter Title Event (if applicable) Date
About Verint
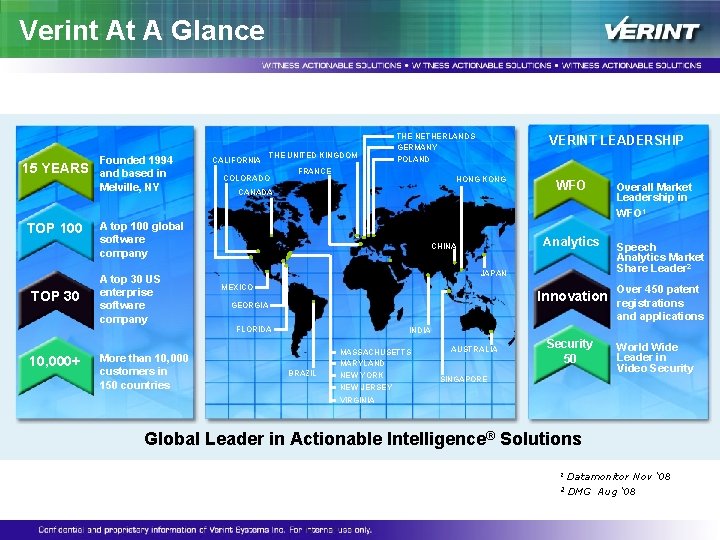
Verint At A Glance 15 YEARS TOP 100 TOP 30 10, 000+ Founded 1994 and based in Melville, NY CALIFORNIA THE UNITED KINGDOM COLORADO THE NETHERLANDS GERMANY POLAND FRANCE HONG KONG CANADA A top 100 global software company A top 30 US enterprise software company More than 10, 000 customers in 150 countries VERINT LEADERSHIP WFO Analytics CHINA JAPAN MEXICO Innovation GEORGIA FLORIDA Overall Market Leadership in WFO 1 Speech Analytics Market Share Leader 2 Over 450 patent registrations and applications INDIA BRAZIL MASSACHUSETTS MARYLAND NEW YORK NEW JERSEY AUSTRALIA Security 50 World Wide Leader in Video Security SINGAPORE VIRGINIA Global Leader in Actionable Intelligence® Solutions 1 Datamonitor Nov ‘ 08 2 DMG Aug ‘ 08
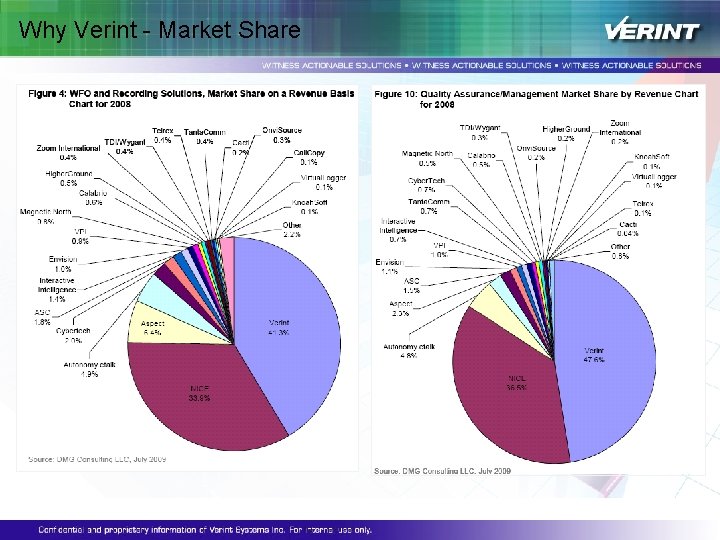
Why Verint - Market Share
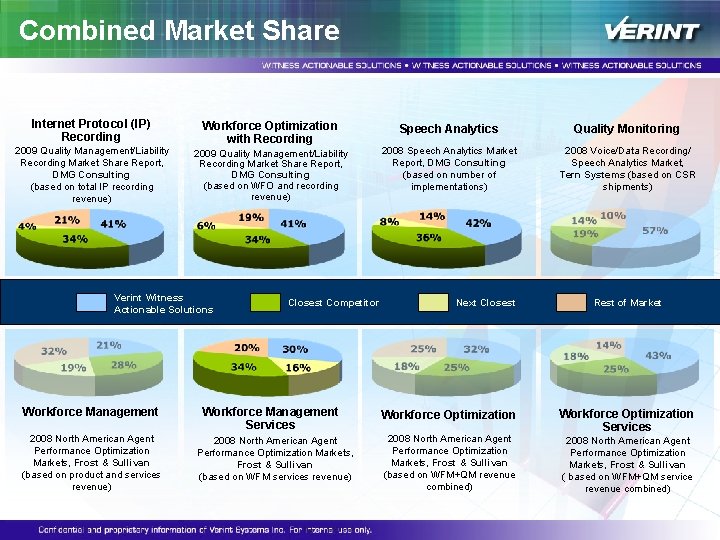
Combined Market Share Internet Protocol (IP) Recording 2009 Quality Management/Liability Recording Market Share Report, DMG Consulting (based on total IP recording revenue) Workforce Optimization with Recording 2009 Quality Management/Liability Recording Market Share Report, DMG Consulting (based on WFO and recording revenue) Verint Witness Actionable Solutions Workforce Management 2008 North American Agent Performance Optimization Markets, Frost & Sullivan (based on product and services revenue) Closest Competitor Workforce Management Services 2008 North American Agent Performance Optimization Markets, Frost & Sullivan (based on WFM services revenue) Speech Analytics Quality Monitoring 2008 Speech Analytics Market Report, DMG Consulting (based on number of implementations) 2008 Voice/Data Recording/ Speech Analytics Market, Tern Systems (based on CSR shipments) Next Closest Workforce Optimization 2008 North American Agent Performance Optimization Markets, Frost & Sullivan (based on WFM+QM revenue combined) Rest of Market Workforce Optimization Services 2008 North American Agent Performance Optimization Markets, Frost & Sullivan ( based on WFM+QM service revenue combined)
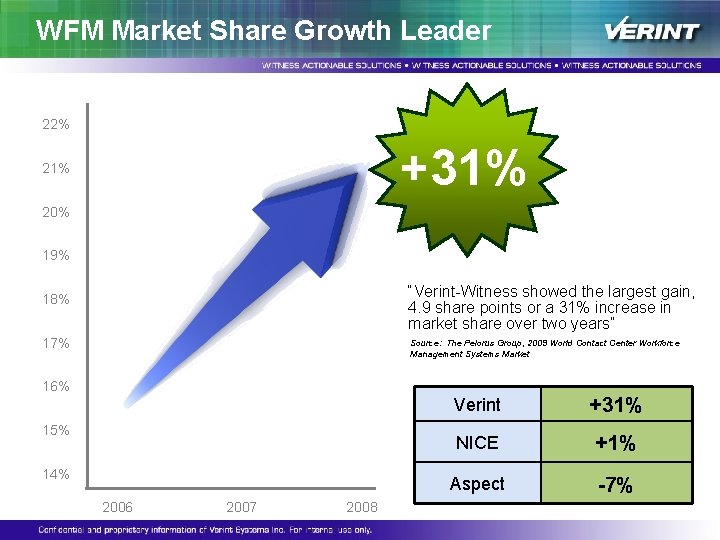
WFM Market Share Growth Leader 22% +31% 20% 19% “Verint-Witness showed the largest gain, 4. 9 share points or a 31% increase in market share over two years” 18% 17% Source: The Pelorus Group, 2009 World Contact Center Workforce Management Systems Market 16% 15% 14% 2006 2007 2008 Verint +31% NICE +1% Aspect -7%
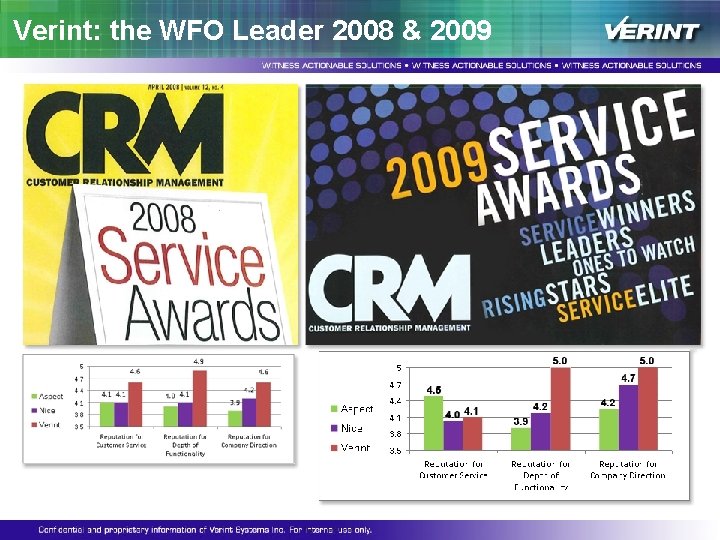
Verint: the WFO Leader 2008 & 2009
What is WFO?
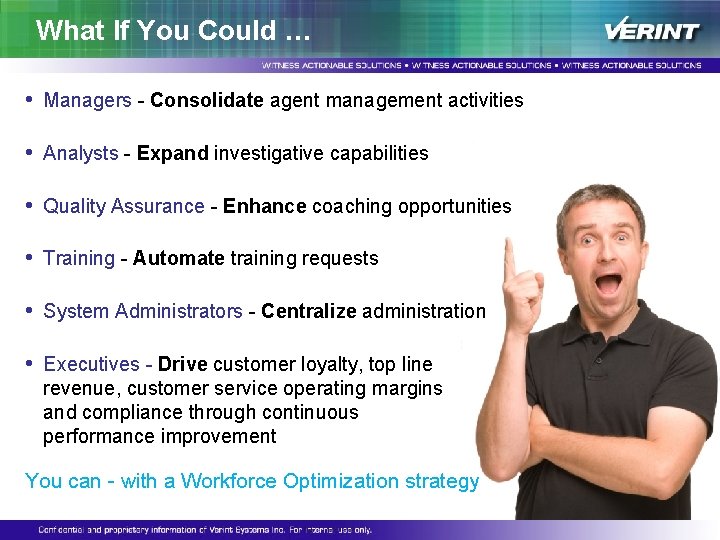
What If You Could … • Managers - Consolidate agent management activities • Analysts - Expand investigative capabilities • Quality Assurance - Enhance coaching opportunities • Training - Automate training requests • System Administrators - Centralize administration • Executives - Drive customer loyalty, top line revenue, customer service operating margins and compliance through continuous performance improvement You can - with a Workforce Optimization strategy
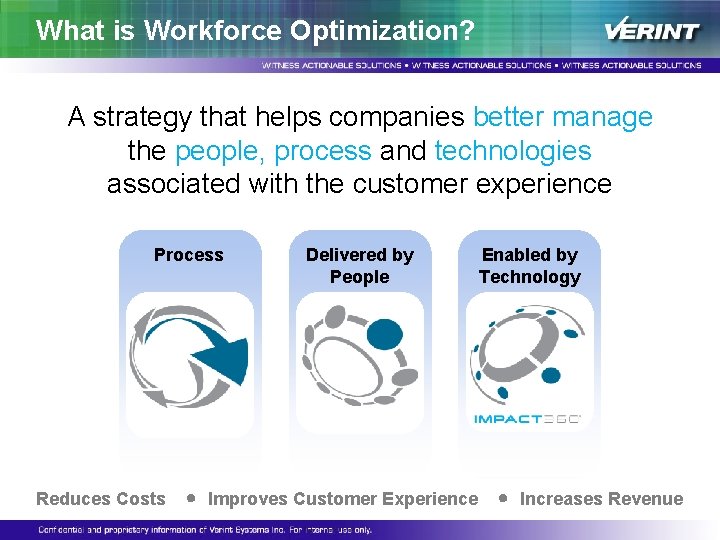
What is Workforce Optimization? A strategy that helps companies better manage the people, process and technologies associated with the customer experience Process Reduces Costs l Delivered by People Improves Customer Experience Enabled by Technology l Increases Revenue
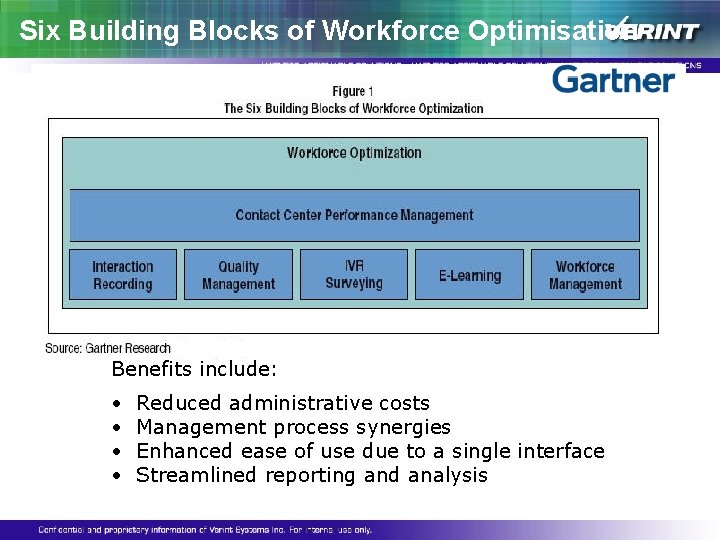
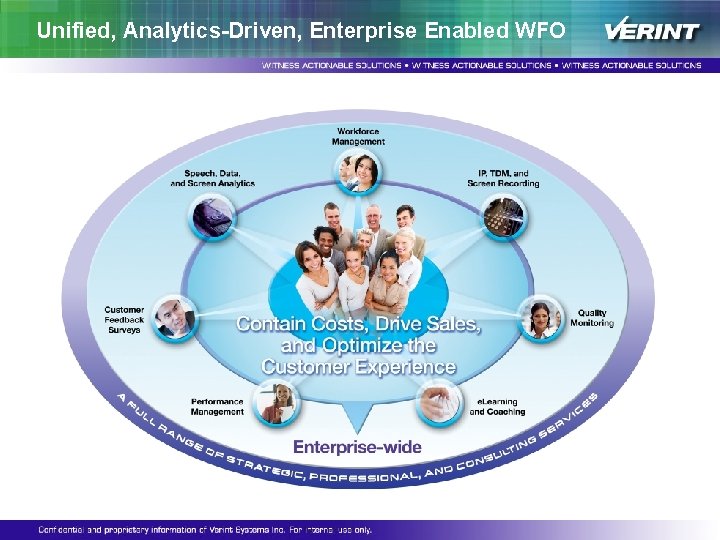
Six Building Blocks of Workforce Optimisation Benefits include: • • Reduced administrative costs Management process synergies Enhanced ease of use due to a single interface Streamlined reporting and analysis
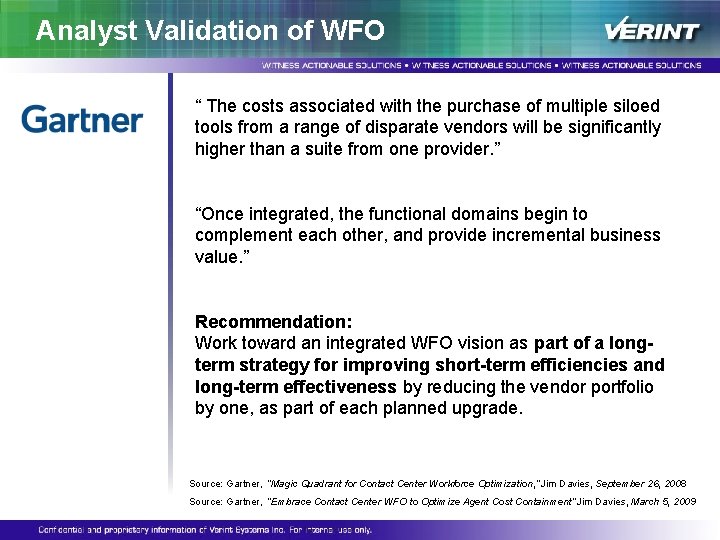
Analyst Validation of WFO “ The costs associated with the purchase of multiple siloed tools from a range of disparate vendors will be significantly higher than a suite from one provider. ” “Once integrated, the functional domains begin to complement each other, and provide incremental business value. ” Recommendation: Work toward an integrated WFO vision as part of a longterm strategy for improving short-term efficiencies and long-term effectiveness by reducing the vendor portfolio by one, as part of each planned upgrade. Source: Gartner, “Magic Quadrant for Contact Center Workforce Optimization, ” Jim Davies, September 26, 2008 Source: Gartner, “Embrace Contact Center WFO to Optimize Agent Cost Containment” Jim Davies, March 5, 2009
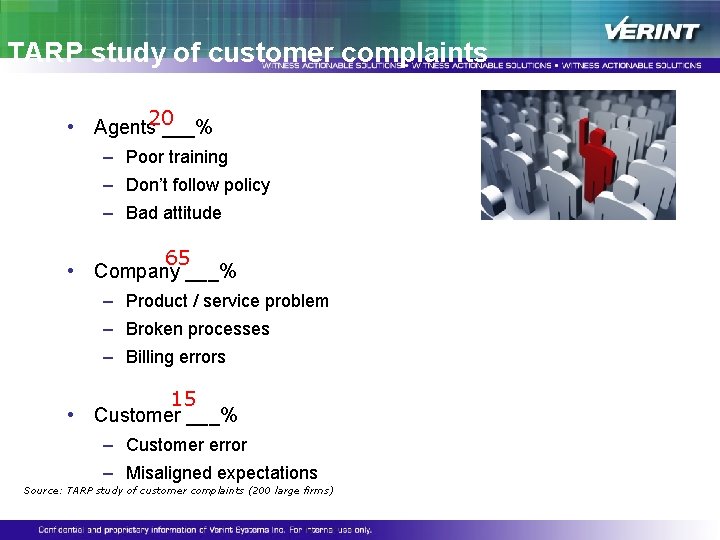
TARP study of customer complaints • Agents 20 ___% – Poor training – Don’t follow policy – Bad attitude 65 • Company ___% – Product / service problem – Broken processes – Billing errors 15 • Customer ___% – Customer error – Misaligned expectations Source: TARP study of customer complaints (200 large firms)
Unified, Analytics-Driven, Enterprise Enabled WFO
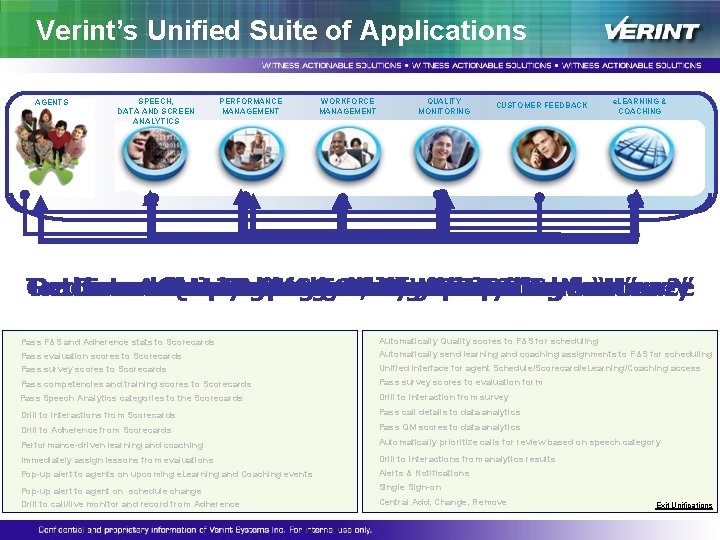
Verint’s Unified Suite of Applications AGENTS SPEECH, DATA AND SCREEN ANALYTICS PERFORMANCE MANAGEMENT WORKFORCE MANAGEMENT QUALITY MONITORING CUSTOMER FEEDBACK e. LEARNING & COACHING Track Get Reduce Determine Immediate Focus and Adminstrative Automatically Streamline Less Analyze QM Improve Increase on Root Improve Agent Answers Decrease the Agent/Group Agent Cause Quality Calls Training Overhead Productivity Assign Adherence to. Performance of that Costs “Where? ” Monitoring KPI Required Learning “Matter KPI and Performance Save and Most” “How? ” Money Pass evaluation scores to Scorecards Pass survey scores to Scorecards Automatically Quality scores to F&S for scheduling Automatically send learning and coaching assignments to F&S for scheduling Unified interface for agent Schedule/Scorecard/e. Learning/Coaching access Pass competencies and training scores to Scorecards Pass survey scores to evaluation form Pass Speech Analytics categories to the Scorecards Drill to interaction from survey Drill to interactions from Scorecards Pass call details to data analytics Drill to Adherence from Scorecards Pass QM scores to data analytics Performance-driven learning and coaching Automatically prioritize calls for review based on speech category Immediately assign lessons from evaluations Drill to interactions from analytics results Pop-up alert to agents on upcoming e. Learning and Coaching events Alerts & Notifications Pop-up alert to agent on schedule change Drill to call/live monitor and record from Adherence Single Sign-on Pass F&S and Adherence stats to Scorecards Central Add, Change, Remove Exit Unifications
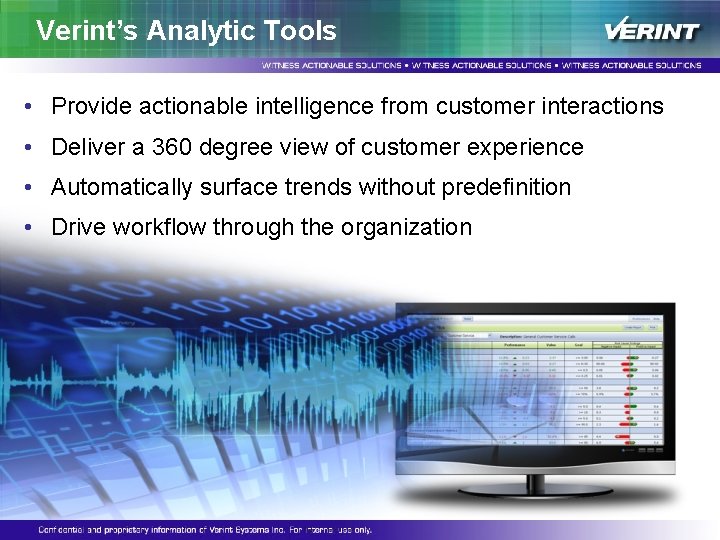
Verint’s Analytic Tools • Provide actionable intelligence from customer interactions • Deliver a 360 degree view of customer experience • Automatically surface trends without predefinition • Drive workflow through the organization
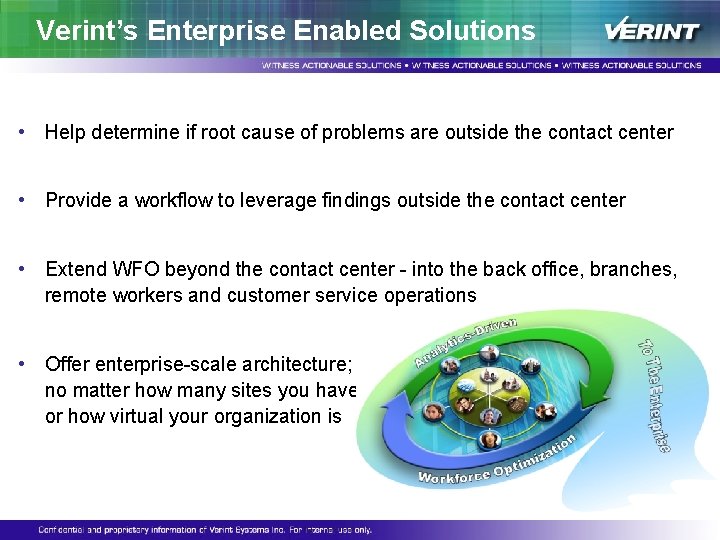
Verint’s Enterprise Enabled Solutions • Help determine if root cause of problems are outside the contact center • Provide a workflow to leverage findings outside the contact center • Extend WFO beyond the contact center - into the back office, branches, remote workers and customer service operations • Offer enterprise-scale architecture; no matter how many sites you have or how virtual your organization is
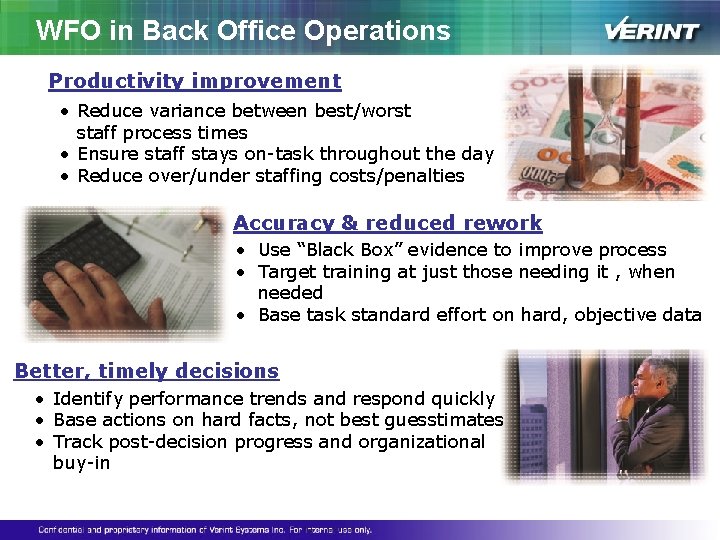
WFO in Back Office Operations Productivity improvement • Reduce variance between best/worst staff process times • Ensure staff stays on-task throughout the day • Reduce over/under staffing costs/penalties Accuracy & reduced rework • Use “Black Box” evidence to improve process • Target training at just those needing it , when needed • Base task standard effort on hard, objective data Better, timely decisions • Identify performance trends and respond quickly • Base actions on hard facts, not best guesstimates • Track post-decision progress and organizational buy-in
Industry Validation of Verint WFO “Verint's vision for WFO spans the front and back office and is, by far, the most executed on through the creation of a dedicated enterprise division…” “The depth and breadth of Verint’s integrated Impact 360 portfolio merges the best from Witness Systems and Verint’s product lines…” “Verint’s desire for true WFO solution unification creates a strong value proposition. . . ” Source: Gartner, “Magic Quadrant for Contact Center Workforce Optimization, ” Jim Davies, September 26, 2008
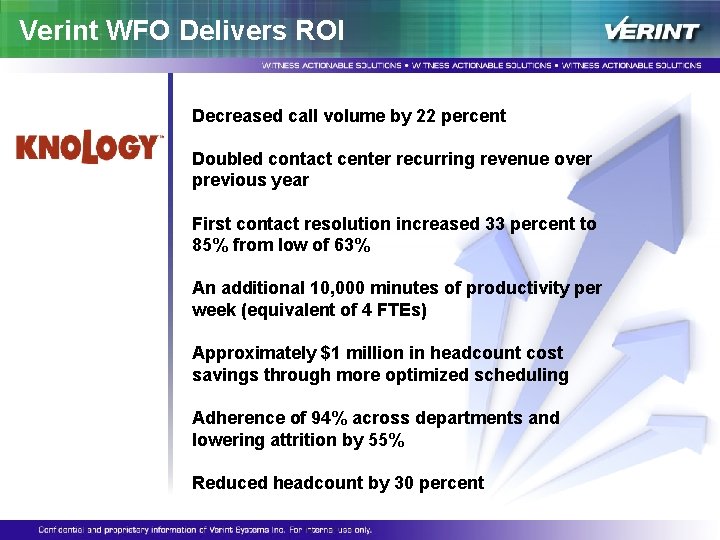
Verint WFO Delivers ROI Decreased call volume by 22 percent Doubled contact center recurring revenue over previous year First contact resolution increased 33 percent to 85% from low of 63% An additional 10, 000 minutes of productivity per week (equivalent of 4 FTEs) Approximately $1 million in headcount cost savings through more optimized scheduling Adherence of 94% across departments and lowering attrition by 55% Reduced headcount by 30 percent
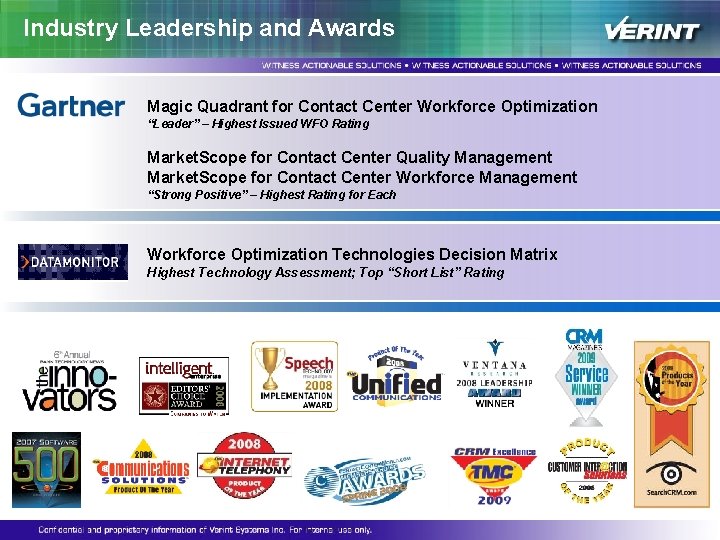
Industry Leadership and Awards Magic Quadrant for Contact Center Workforce Optimization “Leader” – Highest Issued WFO Rating Market. Scope for Contact Center Quality Management Market. Scope for Contact Center Workforce Management “Strong Positive” – Highest Rating for Each Workforce Optimization Technologies Decision Matrix Highest Technology Assessment; Top “Short List” Rating
The market for WFO
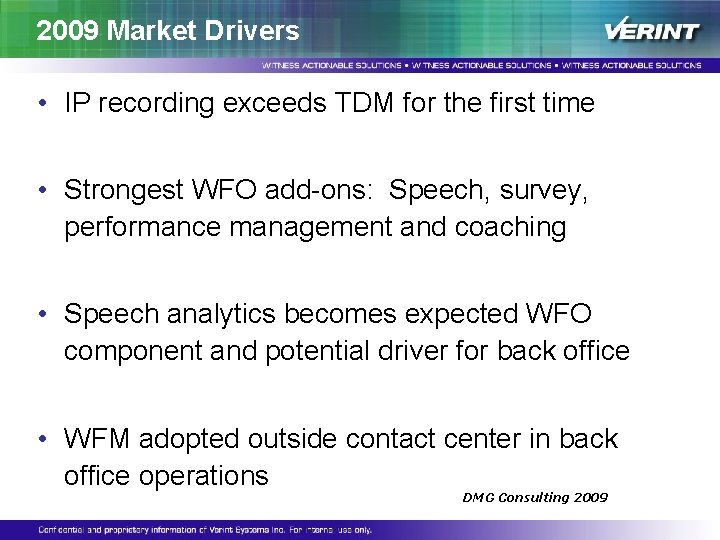
2009 Market Drivers • IP recording exceeds TDM for the first time • Strongest WFO add-ons: Speech, survey, performance management and coaching • Speech analytics becomes expected WFO component and potential driver for back office • WFM adopted outside contact center in back office operations DMG Consulting 2009
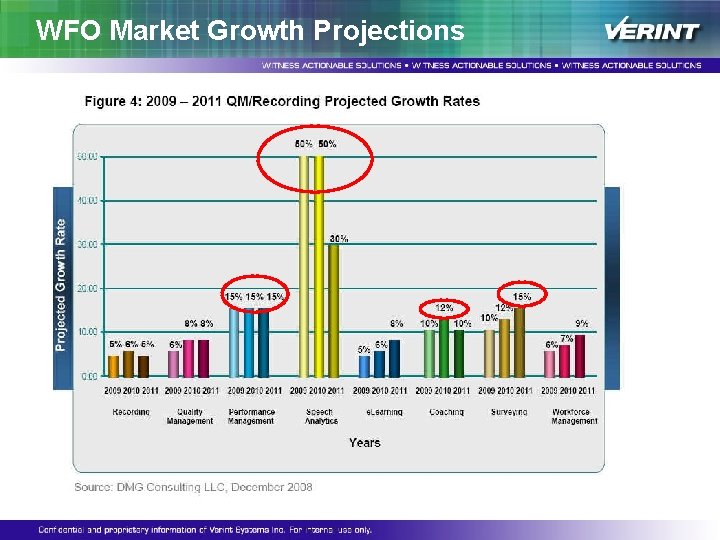
WFO Market Growth Projections
The Product
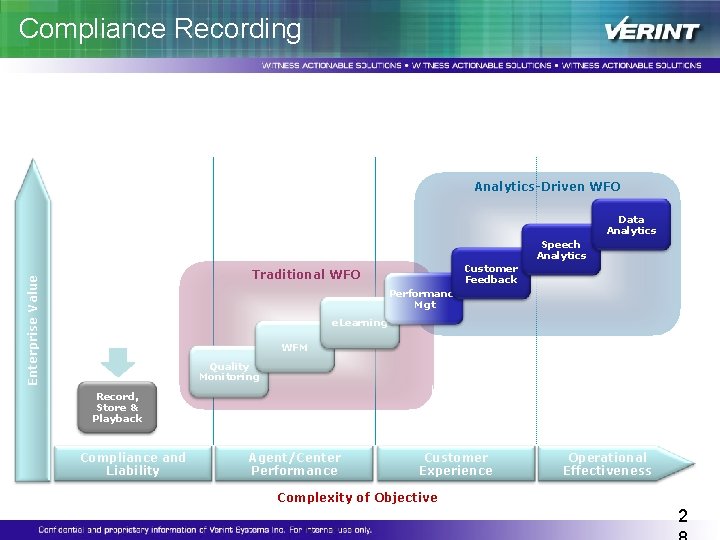
Compliance Recording Manage Risk and Ensure Compliance Analytics-Driven WFO Data Analytics Speech Analytics Customer Feedback Enterprise Value Traditional WFO Performance Mgt e. Learning WFM Quality Monitoring Record, Store & Playback Compliance and Liability Agent/Center Performance Customer Experience Operational Effectiveness Complexity of Objective 2
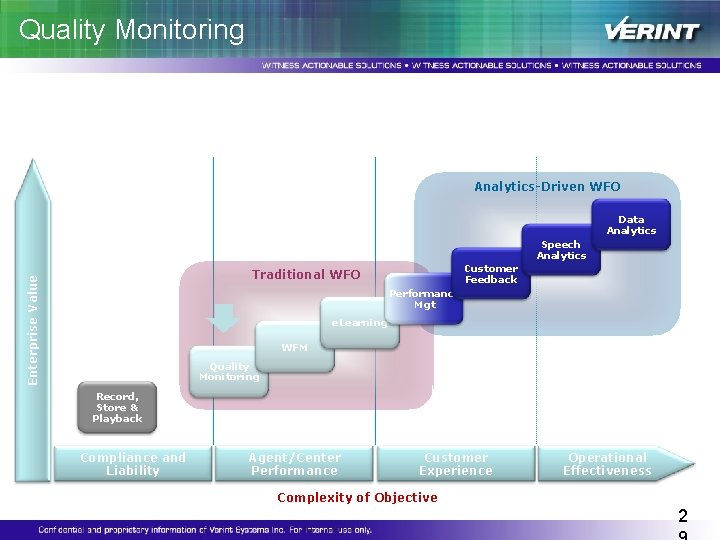
Quality Monitoring Strategic Application for Contact Centers Analytics-Driven WFO Data Analytics Speech Analytics Customer Feedback Enterprise Value Traditional WFO Performance Mgt e. Learning WFM Quality Monitoring Record, Store & Playback Compliance and Liability Agent/Center Performance Customer Experience Operational Effectiveness Complexity of Objective 2
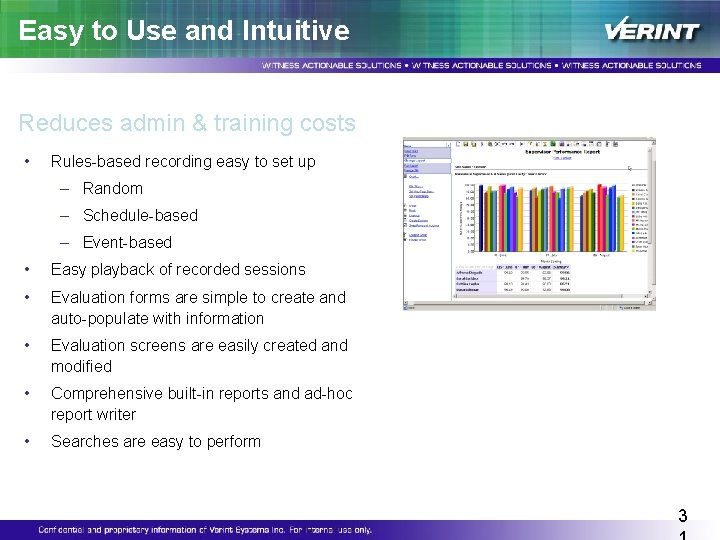
Easy to Use and Intuitive Reduces admin & training costs • Rules-based recording easy to set up – Random – Schedule-based – Event-based • Easy playback of recorded sessions • Evaluation forms are simple to create and auto-populate with information • Evaluation screens are easily created and modified • Comprehensive built-in reports and ad-hoc report writer • Searches are easy to perform 3
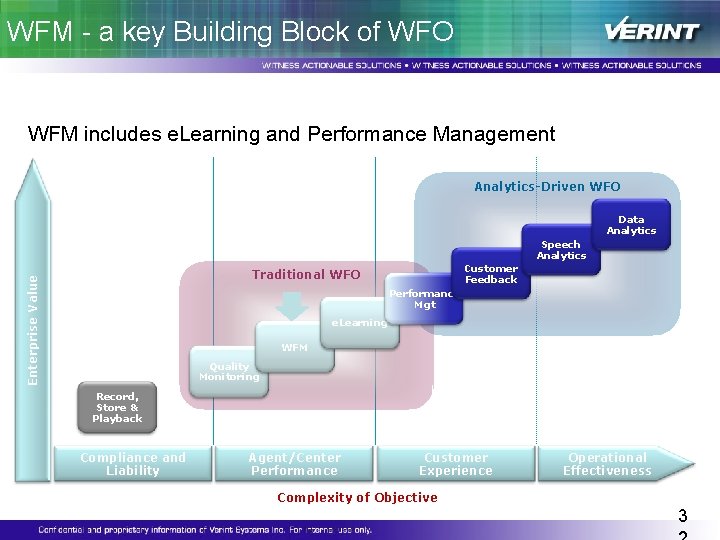
WFM - a key Building Block of WFO WFM includes e. Learning and Performance Management Analytics-Driven WFO Data Analytics Speech Analytics Customer Feedback Enterprise Value Traditional WFO Performance Mgt e. Learning WFM Quality Monitoring Record, Store & Playback Compliance and Liability Agent/Center Performance Customer Experience Operational Effectiveness Complexity of Objective 3
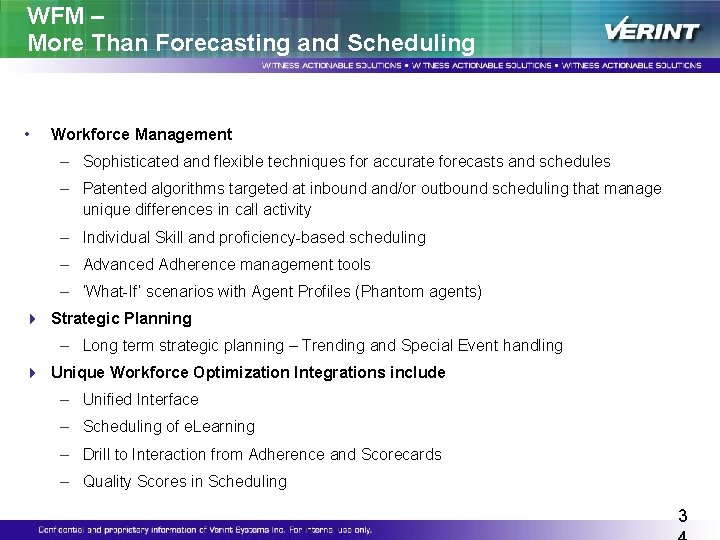
WFM – More Than Forecasting and Scheduling • Workforce Management – Sophisticated and flexible techniques for accurate forecasts and schedules – Patented algorithms targeted at inbound and/or outbound scheduling that manage unique differences in call activity – Individual Skill and proficiency-based scheduling – Advanced Adherence management tools – ‘What-If’ scenarios with Agent Profiles (Phantom agents) 4 Strategic Planning – Long term strategic planning – Trending and Special Event handling 4 Unique Workforce Optimization Integrations include – Unified Interface – Scheduling of e. Learning – Drill to Interaction from Adherence and Scorecards – Quality Scores in Scheduling 3
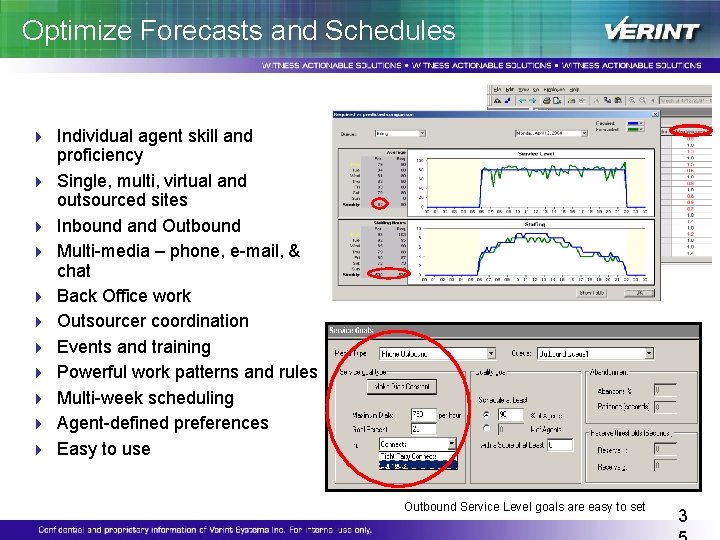
Optimize Forecasts and Schedules 4 Individual agent skill and 4 4 4 4 4 proficiency Single, multi, virtual and outsourced sites Inbound and Outbound Multi-media – phone, e-mail, & chat Back Office work Outsourcer coordination Events and training Powerful work patterns and rules Multi-week scheduling Agent-defined preferences Easy to use Outbound Service Level goals are easy to set 3
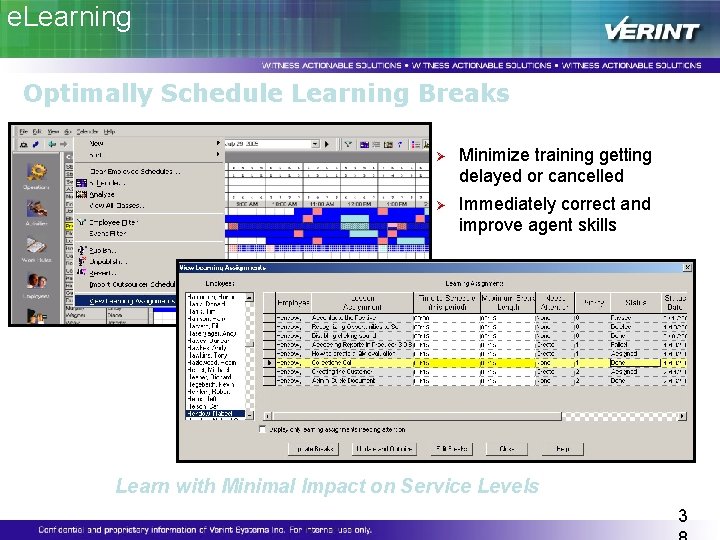
e. Learning Optimally Schedule Learning Breaks Ø Minimize training getting delayed or cancelled Ø Immediately correct and improve agent skills Learn with Minimal Impact on Service Levels 3
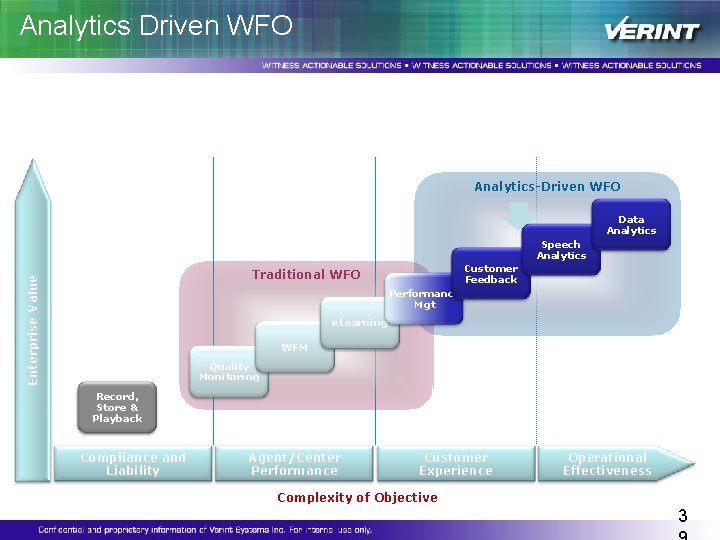
Analytics Driven WFO Customer Feedback & Speech Analytics deliver the Why factor! Analytics-Driven WFO Data Analytics Speech Analytics Customer Feedback Enterprise Value Traditional WFO Performance Mgt e. Learning WFM Quality Monitoring Record, Store & Playback Compliance and Liability Agent/Center Performance Customer Experience Operational Effectiveness Complexity of Objective 3
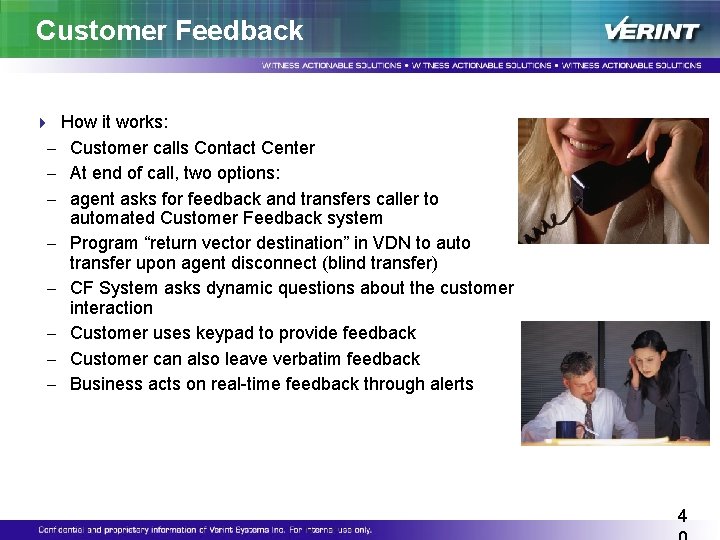
Customer Feedback 4 How it works: – Customer calls Contact Center – At end of call, two options: – agent asks for feedback and transfers caller to – – – automated Customer Feedback system Program “return vector destination” in VDN to auto transfer upon agent disconnect (blind transfer) CF System asks dynamic questions about the customer interaction Customer uses keypad to provide feedback Customer can also leave verbatim feedback Business acts on real-time feedback through alerts 4
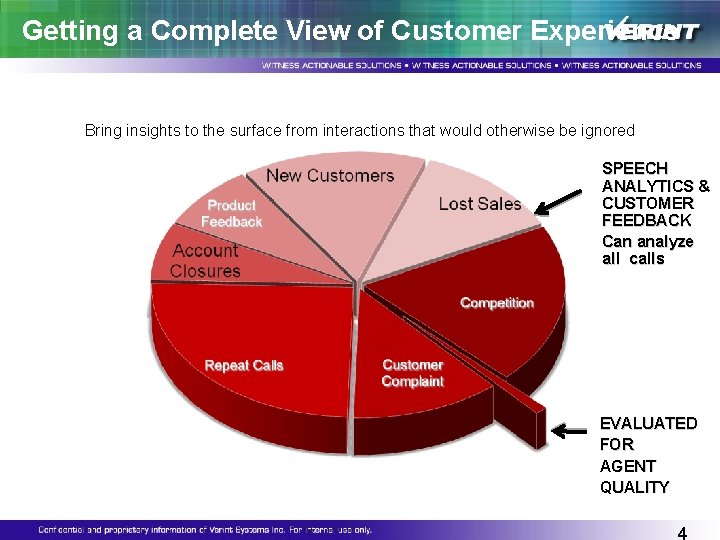
Getting a Complete View of Customer Experience Bring insights to the surface from interactions that would otherwise be ignored SPEECH ANALYTICS & CUSTOMER FEEDBACK Can analyze all calls EVALUATED FOR AGENT QUALITY
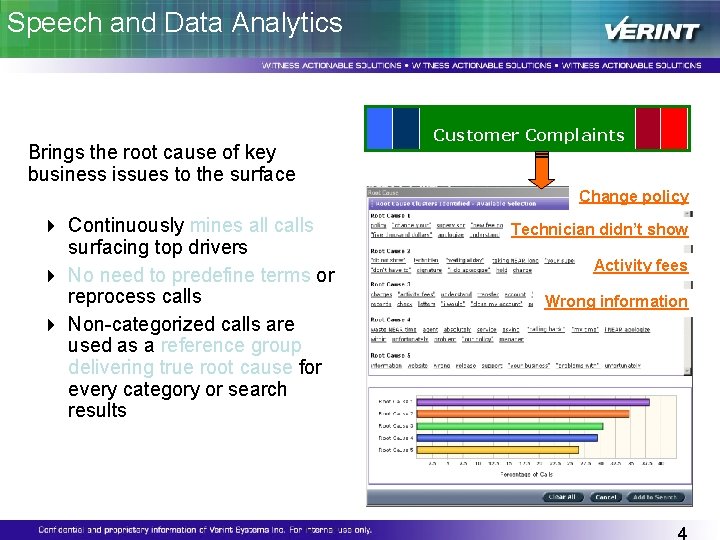
Speech and Data Analytics Brings the root cause of key business issues to the surface Customer Complaints Change policy 4 Continuously mines all calls surfacing top drivers 4 No need to predefine terms or reprocess calls 4 Non-categorized calls are used as a reference group delivering true root cause for every category or search results Technician didn’t show Activity fees Wrong information