HYDROLOGY Lecture 4 Infiltration ASSOC PROF DR TARK


 suggested the following from of the infiltration equation, where rainfall intensity i>f")


 1/6 1/2 1 2 6 f (in/hr) 1. 43 1. 29 1.")


")


 0. 00 0. 17 0. 33 0. 50 0. 67 0. 83")
-DURATION-FREQUENCY STATISTICS Storm Frequency, years 2 5 10 25 50 100 5 -min")

- Slides: 26
HYDROLOGY Lecture 4 Infiltration ASSOC. PROF. DR. TARK AN ERDIK
Parts of the precipitation falling on the earth’s surface moves into the soil under the driving forces of gravity, capilarity and molecular forces. This phenomena is called infiltration. (https: //www. ctahr. hawaii. edu/mauisoil/a_comp 03. aspx) Infiltration is a loss for surface flow but a main source for the groundwater Loss (infiltration) Precipitation Runoff
The infiltrating water firstly increases the soil moisture and the remaining part moves into the deeper parts of the earth, joining the groundwater (percolation)
Gravity force is influential before this point The time rate of change of water content is zero. This point is Field Capacity. If a soil is saturated and then allowed to drain, its water content of soil decrease indefinitely in a quasi-exponential manner Field capacity: is the water-content at which the gravity-drainage rate becomes “negligible. ” The field capacity is thus a measure of the water content that can be held against the force of gravity.
Infiltration Capacity is the maximum rate at which the water can enter to the soil. It depends on the following factors: 1 -Physical characteristics of the soil: The grain size of the soil, permeability of the soil. Porosity Infiltration capacity 2 -Initial moisture content of the soil: Initial mositure content Infiltration capacity 3 -Vegetation cover: Vegetal cover prevents surface flow, prevents rain drops to squeeze the soil, increases permeability of soil. Vegetal cover Infiltration capacity
4. Surface codition of the soil: very fine grains, calcium carbonate and sodium carbonate on the surface of the soil resist the entry of water and reduces infiltration capacity. fine grains calcium carbonate sodium carbonate Infiltration Capacity 5. Air pockets in the soil Air pockets Infiltration Capacity 6. Tilling of the soil affects the infiltration in various ways In bare soil Infiltration capacity is usually between 0. 25 -25 mm/hour Existance of vegetation may increase these values 3 -7 times.
Measurement of Infiltiration Infiltration is measured with a ring infiltrometer, which is a ring about 2 ft in diameter, driven into the soil. Water is placed in the ring and rate of infiltration is measured by the drop in the water level. Infiltration rate is one of the most difficult hydrologic parameters to measure. Because water and soil conditions are extremly variable both in time and in space, which can effect the measured rate. A ring infiltrometer
Equation for standard infiltration curve Standard infiltration curve shows the variation of infiltration capacity with time. As precipitation continues, infiltration capacity decreases due to the fact that 1 -soil moisture increases by time 2 -clay particles fill the pores by swelling 3 -rain particles may squeeze the soil
Horton (1940) suggested the following from of the infiltration equation, where rainfall intensity i>f at all times. f: infiltration capacity (mm/hr) fo: initial infiltration capacity (mm/hr) fc: final capacity (mm/hr) k: empirical constant (or decay coefficient, hr-1) K f(soil type, vegetation)
Fc is the value when the soil reaches the field capacity state, percolation rate. Infiltration depth from the beginning of precipitation until time t can be found by integrating Horton equation.
Example The initial infiltration capacity of a watershed is estimated as 1. 5 in/hr and the time constant is taken to be 0. 35 hr-1. The equabilirium capacity fc is 0. 2 in/hr. Find (a) the values of f at time t=10 min, 30 min, 1 hr, 2 hr and 6 hr. (b) The total volume of infiltration over the 6 hr period (rainfall intensity i>f at all times) f=fc + (fo-fc) e-kt f=0. 2+1. 3 e-0. 35 t in/hr
t (hr) 1/6 1/2 1 2 6 f (in/hr) 1. 43 1. 29 1. 12 0. 85 0. 36
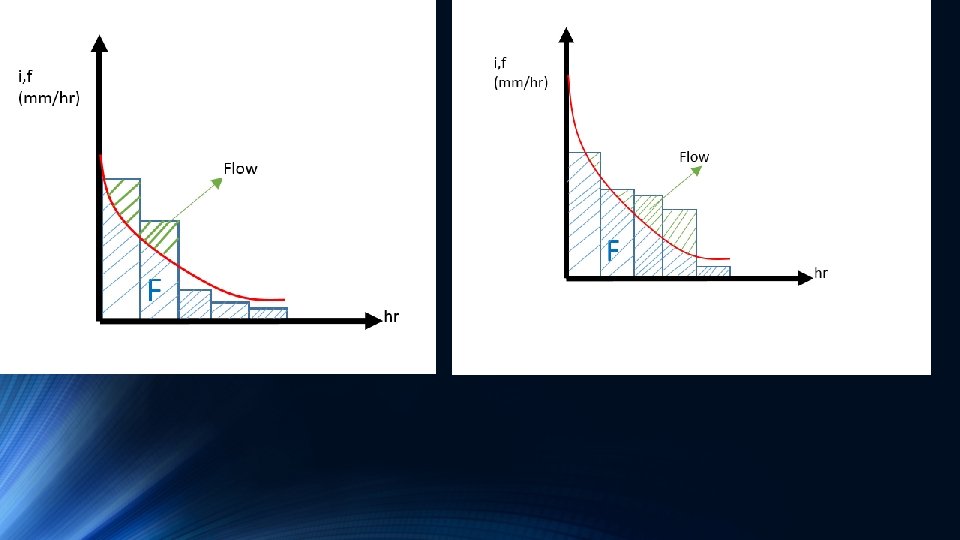
Infiltration rate is defined as the actual infiltration rate during a rainfall. It is similiar to the definition of actual ET. If there is sufficient rainfall, infiltration rate= infltration capacity
(Interception and depression storage)
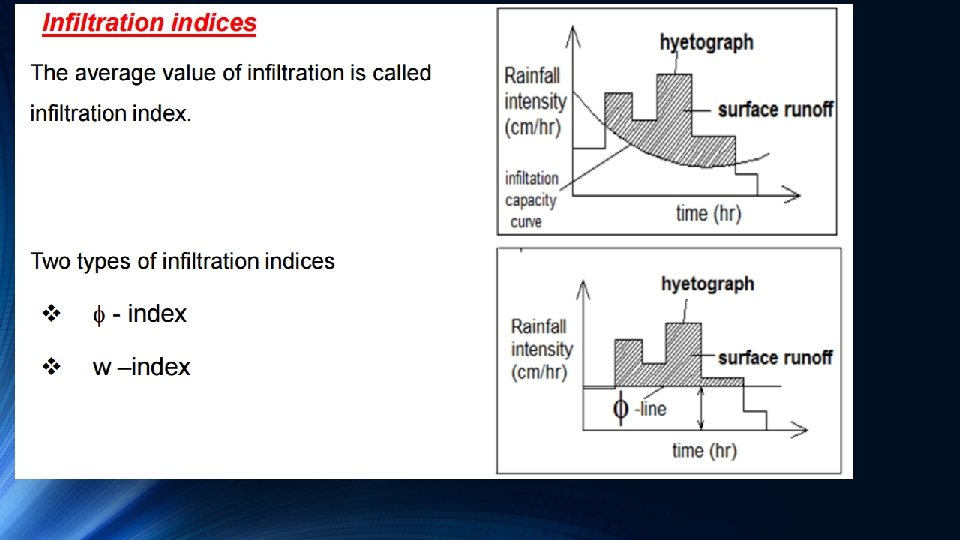
Example 1: Please calculate Ф index for the catchment, assuming a surface runoff equivalent to 33 mm. In addition, please calculate total precipitation. , P(total precipitation)=7× 1+18× 1+25× 1+12× 1+10× 1+3× 1=75 mm Runoff (33 mm)=(7 -Ф) × 1 +(18 -Ф) × 1+(25 -Ф) × 1+(12 -Ф) × 1+(10 -Ф) × 1+(3 -Ф) × 1 Ф 42 mm=6 Ф Ф=7 mm Ф should be less than 3 (pay attention to the horizantal line)
Example 1: Please calculate Ф index for the catchment, assuming a surface runoff equivalent to 33 mm. In addition, please calculate total precipitation. , P(total precipitation)=7× 1+18× 1+25× 1+12× 1+10× 1+3× 1=75 mm Runoff (33 mm)=(18 -Ф) × 1+(25 -Ф) × 1 Ф -10 mm=-2 Ф Ф=5 mm Ф should be greater than 12 (pay attention to the horizantal line)
Example 1: Please calculate Ф index for the catchment, assuming a surface runoff equivalent to 33 mm. In addition, please calculate total precipitation. , P(total precipitation)=7× 1+18× 1+25× 1+12× 1+10× 1+3× 1=75 mm Runoff (33 mm)=(18 -Ф) × 1+(25 -Ф) × 1+(12 -Ф) × 1+(10 -Ф) × 1 Ф -32 mm=-4 Ф Ф=8 mm Ф should be greater than 7 (pay attention to the horizantal line)
Example 2: Please calculate total precipitation and Ф index for the catchment, assuming a surface runoff equivalent to 33 mm. In addition, please calculate total precipitation. P(total precipitation)=5× 1+15× 1+20× 2+14× 1+1× 1=75 mm Runoff (33 mm)=(15 -Ф) × 1+(20 -Ф) × 2+(14 -Ф) × 1 -36 mm=-4 Ф Ф=9 mm Ф
Additional exercises 1 Assume that the time evolution of the infiltration capacity for a given soil is governed by Horton's equation. For this soil, the asymptotic or final equilibrium infiltration capacity is fc = 1. 25 cm/h; and the initial infiltration capacity is fo = 8 cm/h. The rate of decay of infiltration capacity parameter is k = 3 h-1. The time rate of change of precipitation is given below. Please calculate rainfall intensity, infiltration capacity and actual infiltration. Time (min) 0 -10 10 -20 20 -30 30 -40 40 -50 50 -60 60 -70 Total precipitation (cm) 0. 25 0. 75 2. 083 2. 917 3. 583 4. 083 4. 217
10. 0 8. 0 6. 0 4. 0 2. 0 0. 0 Total precipitation (cm) 0. 25 0. 75 2. 083 2. 917 3. 583 4. 083 4. 217 8. 0 5. 0 3. 0 0. 8 -4 0 40 -5 0 50 -6 0 60 -7 0 4. 0 30 20 -3 0 -2 10 10 0 3. 0 1. 5 0 - Rainfall intensity (cm/h) Time (min) 0 -10 10 -20 20 -30 30 -40 40 -50 50 -60 60 -70 Time interval (min) Rainfall intensity (cm/h) 1. 5 3. 0 8. 0 5. 0 4. 0 3. 0 0. 8 (0. 75 -0. 25)/ (10/60)
Time (hour) 0. 00 0. 17 0. 33 0. 50 0. 67 0. 83 1. 00 1. 17 1. 33 1. 50 1. 67 1. 83 2. 00 Rainfall intensity (cm/h) 1. 5 3. 0 8. 0 5. 0 4. 0 3. 0 0. 8 Infiltration capacity (cm/h) 8. 0 5. 3 3. 7 2. 8 2. 2 1. 8 1. 6 1. 5 1. 4 1. 3 Actual infiltration rate (cm/h) 1. 5 3. 0 3. 7 2. 8 2. 2 1. 8 0. 8
INTENSITY (mm/hr)-DURATION-FREQUENCY STATISTICS Storm Frequency, years 2 5 10 25 50 100 5 -min 3. 60 4. 80 5. 16 6. 36 7. 32 8. 40 10 -min 2. 46 3. 24 4. 08 4. 92 5. 58 6. 36 15 -min 2. 08 2. 80 3. 32 4. 08 4. 68 5. 24 30 -min 1. 40 1. 86 2. 24 2. 76 3. 16 3. 56 1 -hour 0. 86 1. 17 1. 40 1. 70 1. 95 2. 20 2 -hours 0. 49 0. 66 0. 79 0. 96 1. 10 1. 23 3 -hour 0. 34 0. 45 0. 54 0. 65 0. 74 0. 83 6 -hour 0. 20 0. 25 0. 30 0. 36 0. 40 0. 45 12 -hour 0. 11 0. 14 0. 16 0. 20 0. 22 0. 24 24 -hour 0. 06 0. 08 0. 10 0. 12 0. 13 0. 15
Additional exercises 2 DEPTH-DURATION-FREQUENCY STATISTICS Storm Frequency, years 2 5 10 25 50 100 5 -min 0. 30 0. 43 0. 53 0. 61 0. 70 10 -min 0. 41 0. 54 0. 68 0. 82 0. 93 1. 06 15 -min 0. 52 0. 70 0. 83 1. 02 1. 17 1. 31 30 -min 0. 70 0. 93 1. 12 1. 38 1. 58 1. 78 1 -hour 0. 86 1. 17 1. 40 1. 70 1. 95 2. 20 2 -hours 0. 98 1. 32 1. 58 1. 92 2. 20 2. 46 3 -hour 1. 02 1. 35 1. 61 1. 96 2. 23 2. 50 6 -hour 1. 20 1. 52 1. 79 2. 13 2. 42 2. 70 12 -hour 1. 34 1. 70 1. 96 2. 35 2. 61 2. 90 24 -hour 1. 55 1. 99 2. 34 2. 84 3. 22 3. 62