HYDROLOGY Lecture 1 ASSOC PROF DR TARK AN



- Slides: 24
HYDROLOGY Lecture 1 ASSOC. PROF. DR. TARK AN ERDIK
What is Hydrology? U. S. Panel on Hydrology of the Federal Council for Science and Technology recommended the following broad description in 1962: “Hydrology is the science that treats of the waters of the earth, their occurrence, circulation and distribution, their and physical properties, and their reaction with their environment, including their relation to living things. ”
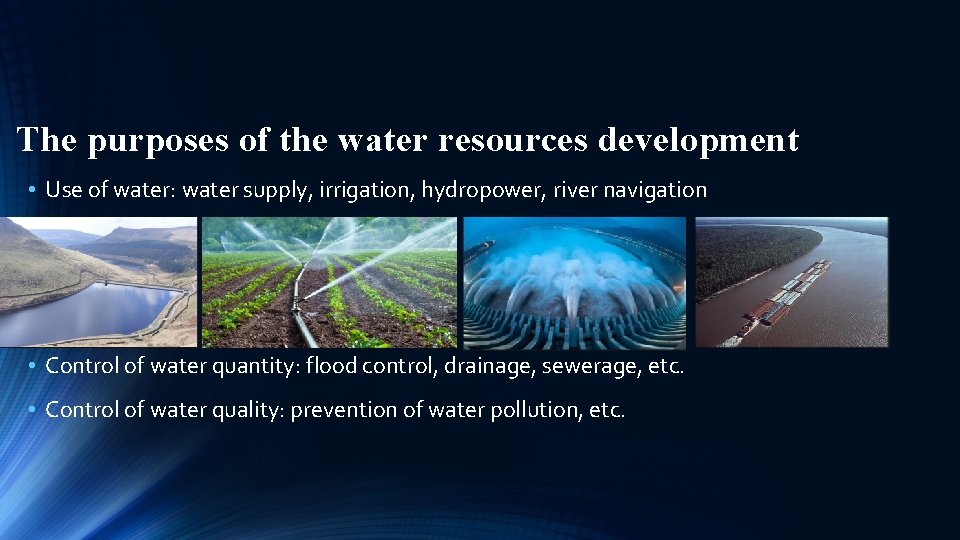
The purposes of the water resources development • Use of water: water supply, irrigation, hydropower, river navigation • Control of water quantity: flood control, drainage, sewerage, etc. • Control of water quality: prevention of water pollution, etc.
In planning, design, construction and operation stages of all the structures, it is required to provide answers to certain questions about the quantity and properties of the water. For example; 1 -It is necessary to estimate the largest flood in a certain period of time (such as 100 years) 2 -It is required to predict the discharge in a stream for a certain number of days (such as 180 days) in a year to calculate the firm power of a hydroelectric plant. Such questions about the water resources development can be answered by the science of hydrology.
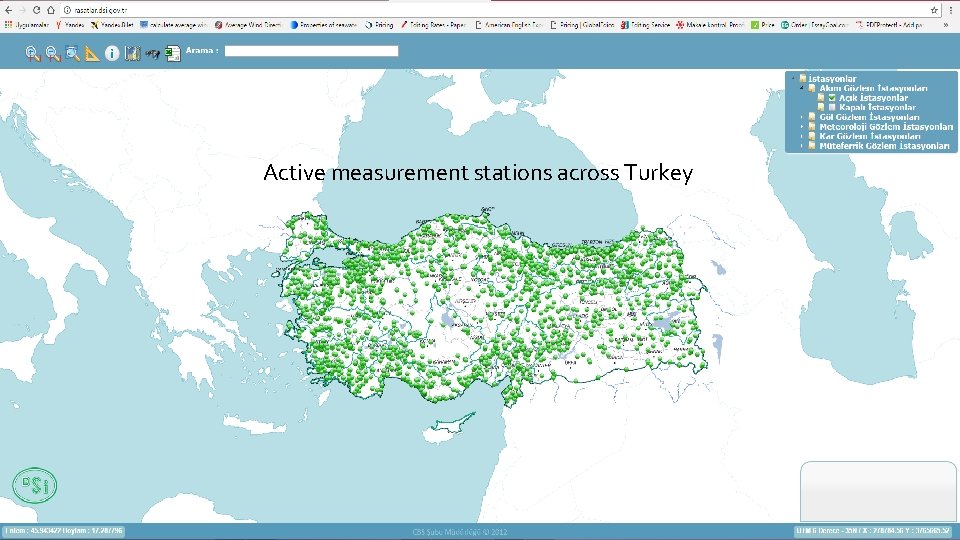
The methods of Hydrology • Measurements: It is about collecting the relevant natural data (such as precipitation, evaporation and streamflow measurements). Hydrologic variables are continuous in time and space. Therefore, network of measurement stations should be installed with adequate precision.
Active measurement stations across Turkey
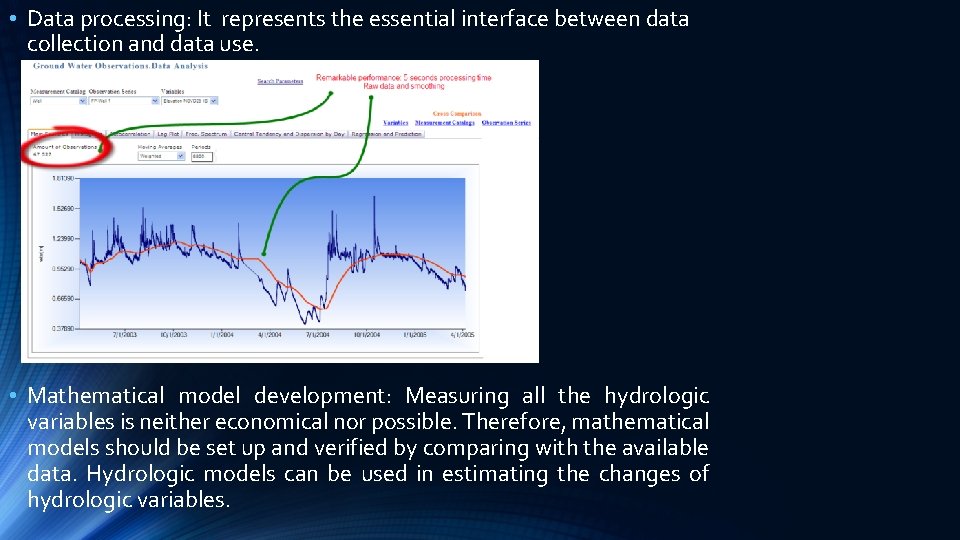
• Data processing: It represents the essential interface between data collection and data use. • Mathematical model development: Measuring all the hydrologic variables is neither economical nor possible. Therefore, mathematical models should be set up and verified by comparing with the available data. Hydrologic models can be used in estimating the changes of hydrologic variables.
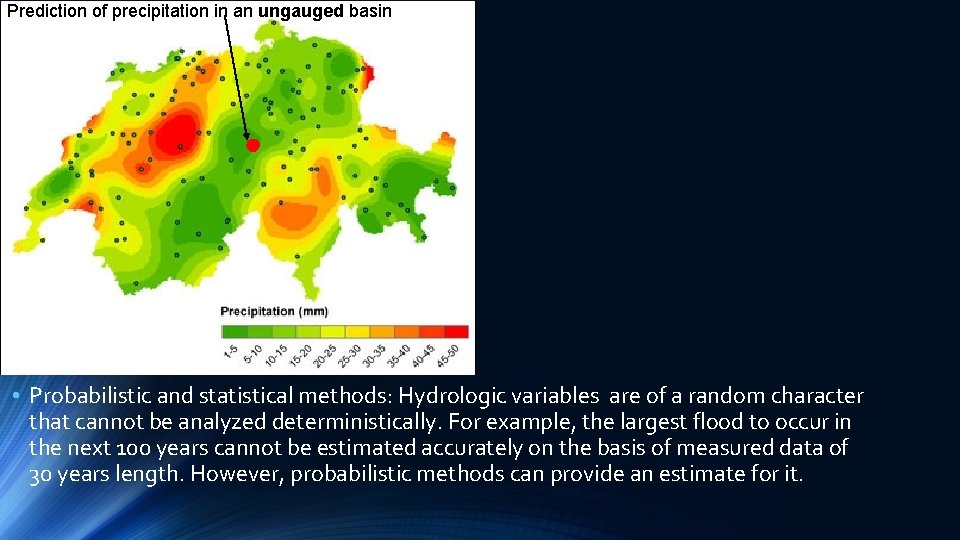
Prediction of precipitation in an ungauged basin • Probabilistic and statistical methods: Hydrologic variables are of a random character that cannot be analyzed deterministically. For example, the largest flood to occur in the next 100 years cannot be estimated accurately on the basis of measured data of 30 years length. However, probabilistic methods can provide an estimate for it.
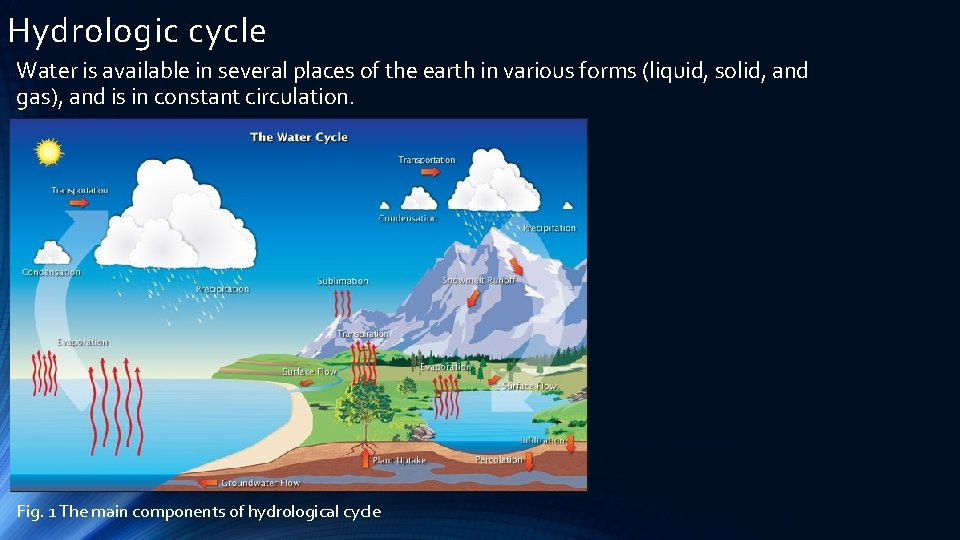
Hydrologic cycle Water is available in several places of the earth in various forms (liquid, solid, and gas), and is in constant circulation. Fig. 1 The main components of hydrological cycle
Starting in the atmosphere, the water present as vapor in the atmosphere, condenses and falls on the surface of the earth as precipitation. A large portion of the precipitation falling on the continents (about 60 -75%) returns to the atmosphere as evaporation from the soil and water or as transpiration from the vegetation without reaching the oceans. The vegetation retains a part of this (interception), some of it infiltrates into the ground (infiltration). The remaining water moves by gravity and reaches to the streams and is transported by the streams to the oceans (surface flow). Infiltrated water moves as groundwater flow until it reaches the surface of the earth to join the surface flow. The water in the oceans evaporates back to the atmosphere. It is seen that water circulates in several parts of the earth following various paths in the form of solid, liquid or gas. The sun and gravitation provide the energy required for this circulation.
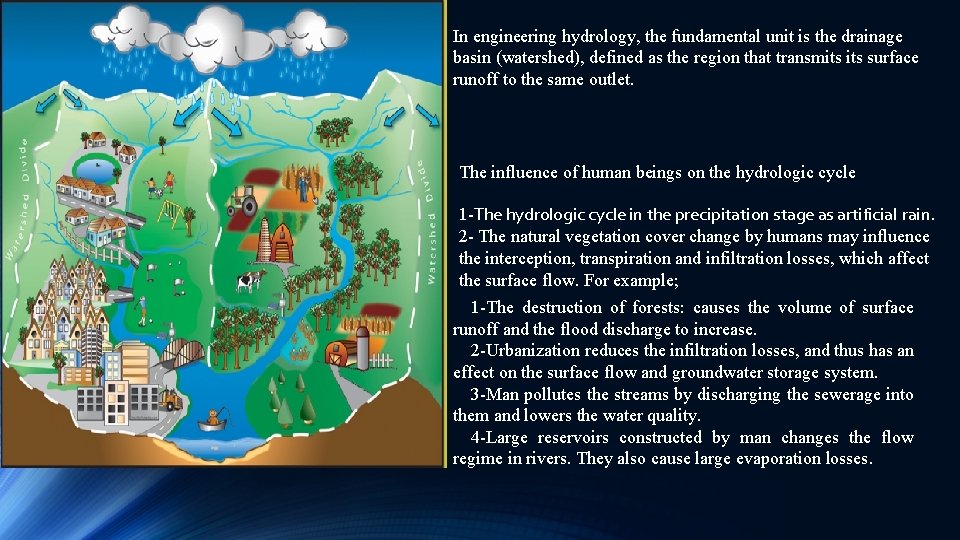
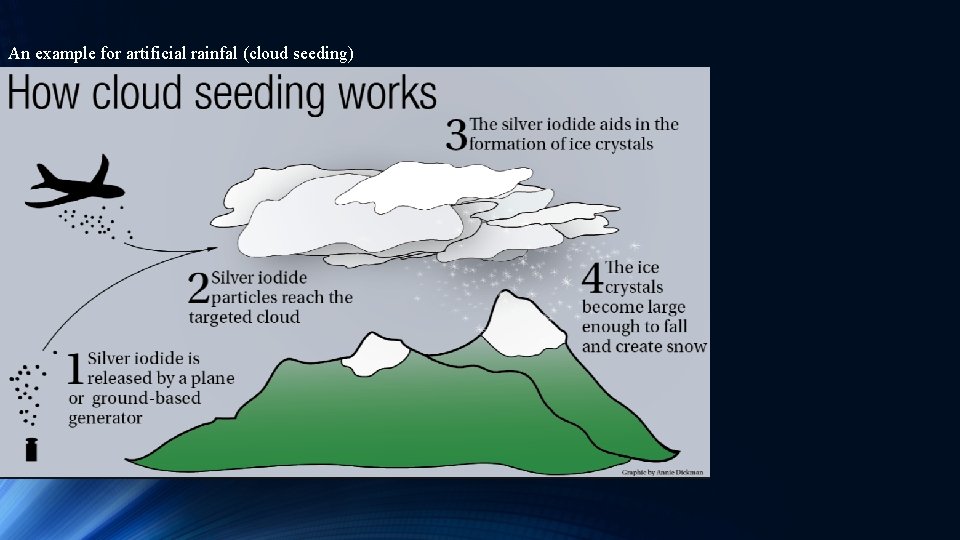
In engineering hydrology, the fundamental unit is the drainage basin (watershed), defined as the region that transmits surface runoff to the same outlet. The influence of human beings on the hydrologic cycle 1 -The hydrologic cycle in the precipitation stage as artificial rain. 2 - The natural vegetation cover change by humans may influence the interception, transpiration and infiltration losses, which affect the surface flow. For example; 1 -The destruction of forests: causes the volume of surface runoff and the flood discharge to increase. 2 -Urbanization reduces the infiltration losses, and thus has an effect on the surface flow and groundwater storage system. 3 -Man pollutes the streams by discharging the sewerage into them and lowers the water quality. 4 -Large reservoirs constructed by man changes the flow regime in rivers. They also cause large evaporation losses.
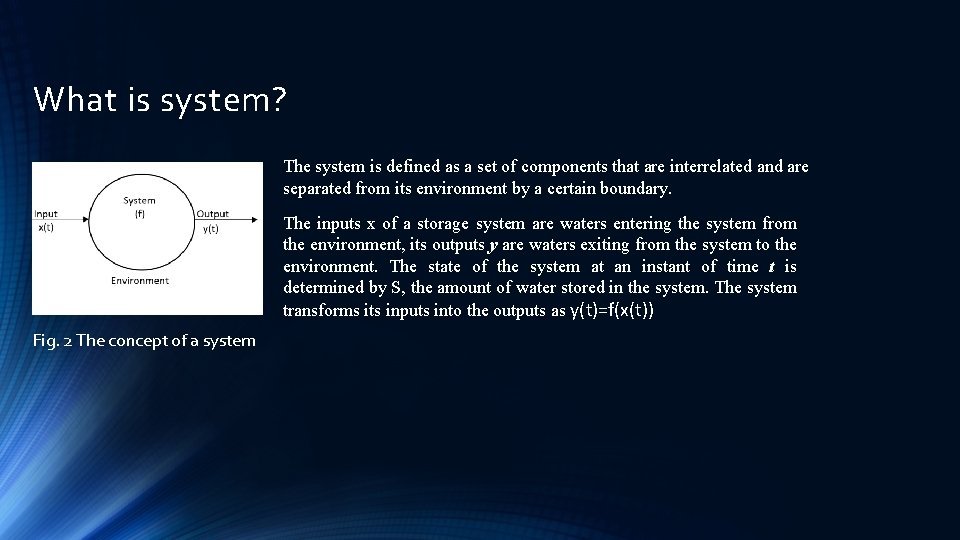
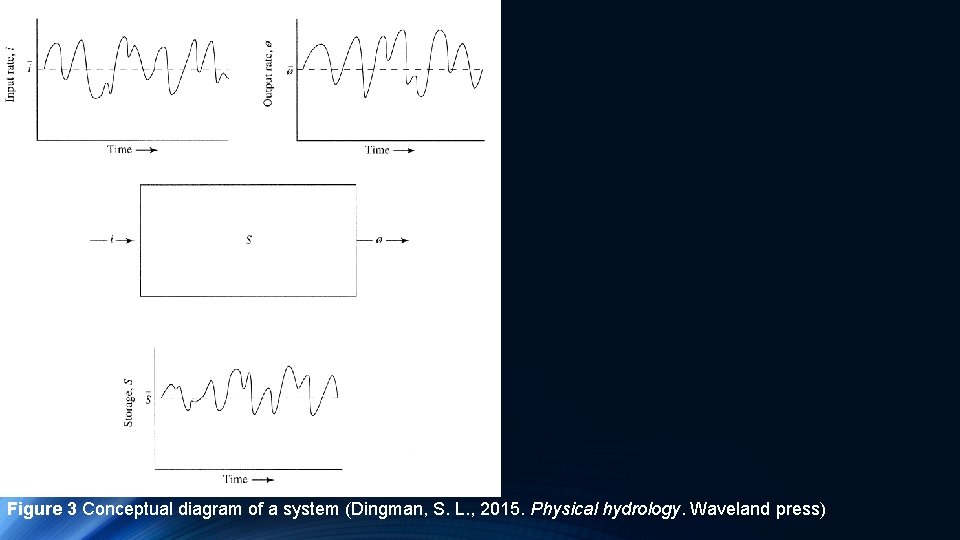
What is system? The system is defined as a set of components that are interrelated and are separated from its environment by a certain boundary. The inputs x of a storage system are waters entering the system from the environment, its outputs y are waters exiting from the system to the environment. The state of the system at an instant of time t is determined by S, the amount of water stored in the system. The system transforms its inputs into the outputs as y(t)=f(x(t)) Fig. 2 The concept of a system
Figure 3 Conceptual diagram of a system (Dingman, S. L. , 2015. Physical hydrology. Waveland press)
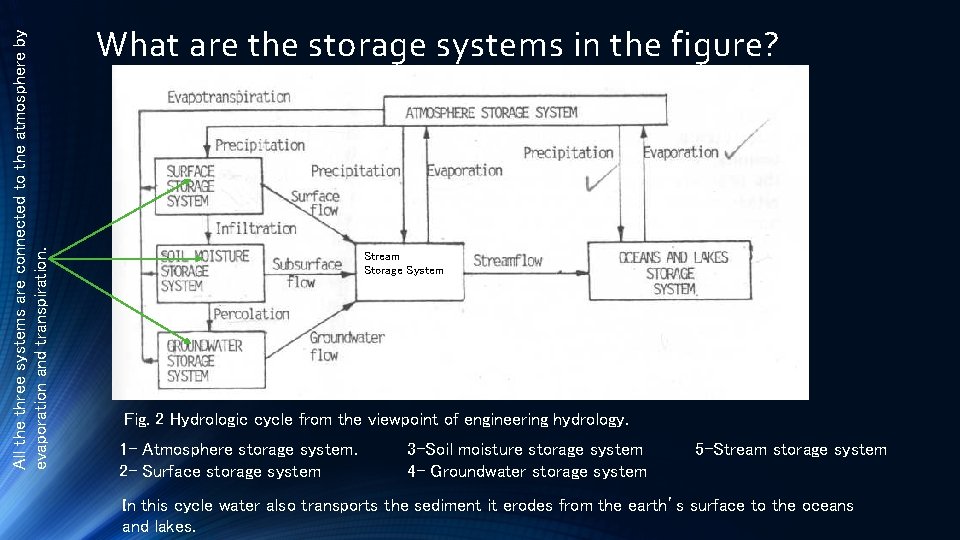
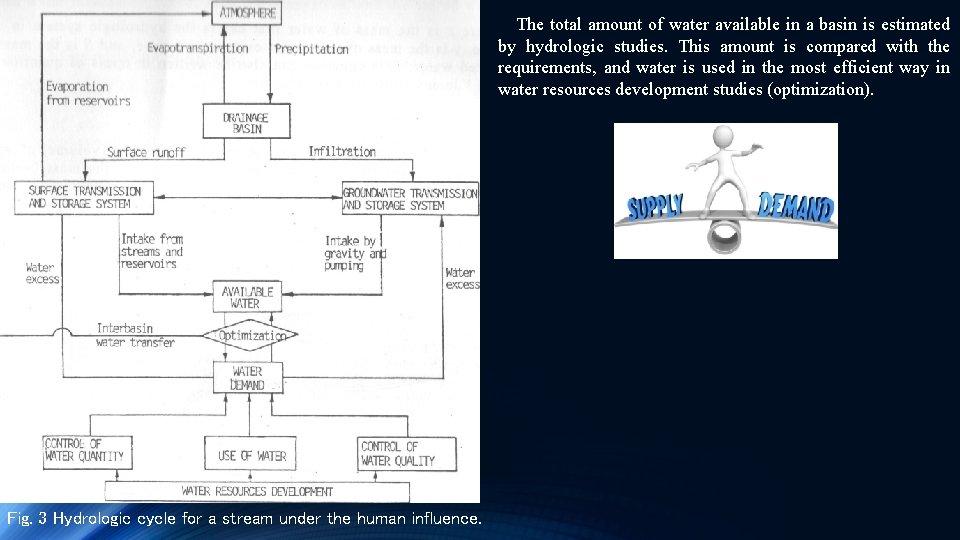
All the three systems are connected to the atmosphere by evaporation and transpiration. What are the storage systems in the figure? Stream Storage System Fig. 2 Hydrologic cycle from the viewpoint of engineering hydrology. 1 - Atmosphere storage system. 2 - Surface storage system 3 -Soil moisture storage system 4 - Groundwater storage system 5 -Stream storage system In this cycle water also transports the sediment it erodes from the earth’s surface to the oceans and lakes.
An example for artificial rainfal (cloud seeding)
The total amount of water available in a basin is estimated by hydrologic studies. This amount is compared with the requirements, and water is used in the most efficient way in water resources development studies (optimization). Fig. 3 Hydrologic cycle for a stream under the human influence.
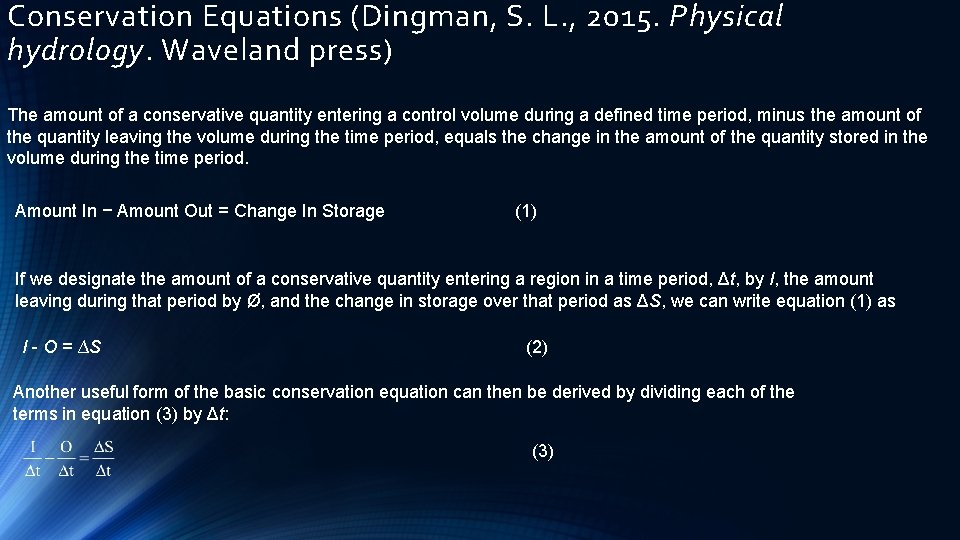
Conservation Equations (Dingman, S. L. , 2015. Physical hydrology. Waveland press) The amount of a conservative quantity entering a control volume during a defined time period, minus the amount of the quantity leaving the volume during the time period, equals the change in the amount of the quantity stored in the volume during the time period. Amount In − Amount Out = Change In Storage (1) If we designate the amount of a conservative quantity entering a region in a time period, Δt, by I, the amount leaving during that period by Ø, and the change in storage over that period as ΔS, we can write equation (1) as I - O = ∆S (2) Another useful form of the basic conservation equation can then be derived by dividing each of the terms in equation (3) by Δt: (3)
5 m 3 ? 2 m 3
5 m 3 3 m 2 m 3 3
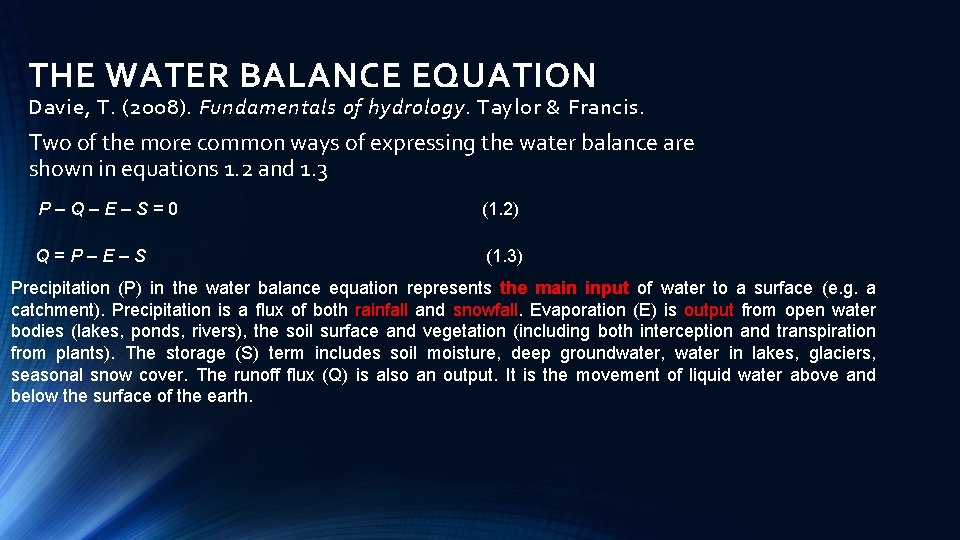
THE WATER BALANCE EQUATION Davie, T. (2008). Fundamentals of hydrology. Taylor & Francis. Two of the more common ways of expressing the water balance are shown in equations 1. 2 and 1. 3 P – Q – E – S = 0 (1. 2) Q = P – E – S (1. 3) Precipitation (P) in the water balance equation represents the main input of water to a surface (e. g. a catchment). Precipitation is a flux of both rainfall and snowfall. Evaporation (E) is output from open water bodies (lakes, ponds, rivers), the soil surface and vegetation (including both interception and transpiration from plants). The storage (S) term includes soil moisture, deep groundwater, water in lakes, glaciers, seasonal snow cover. The runoff flux (Q) is also an output. It is the movement of liquid water above and below the surface of the earth.
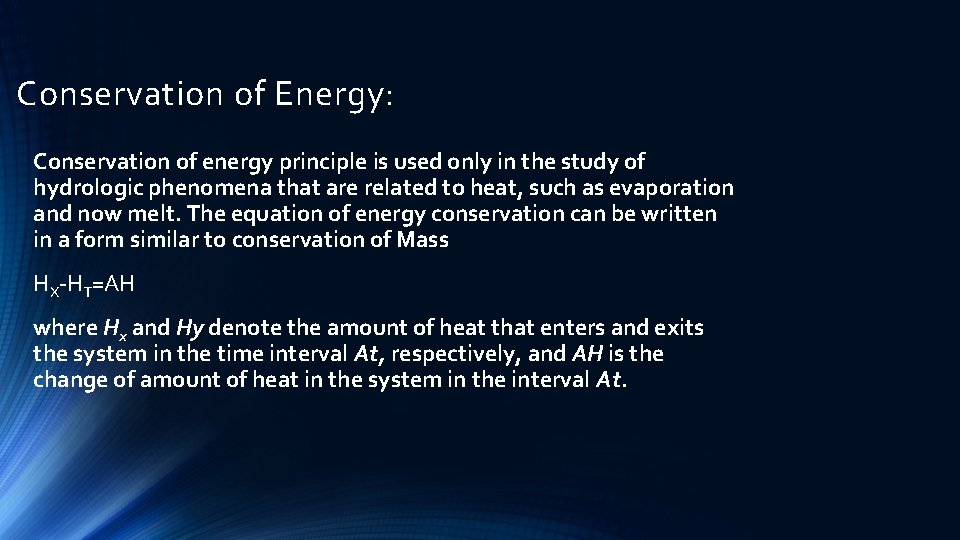
Conservation of Energy: Conservation of energy principle is used only in the study of hydrologic phenomena that are related to heat, such as evaporation and now melt. The equation of energy conservation can be written in a form similar to conservation of Mass HX-HT=AH where Hx and Hy denote the amount of heat that enters and exits the system in the time interval At, respectively, and AH is the change of amount of heat in the system in the interval At.
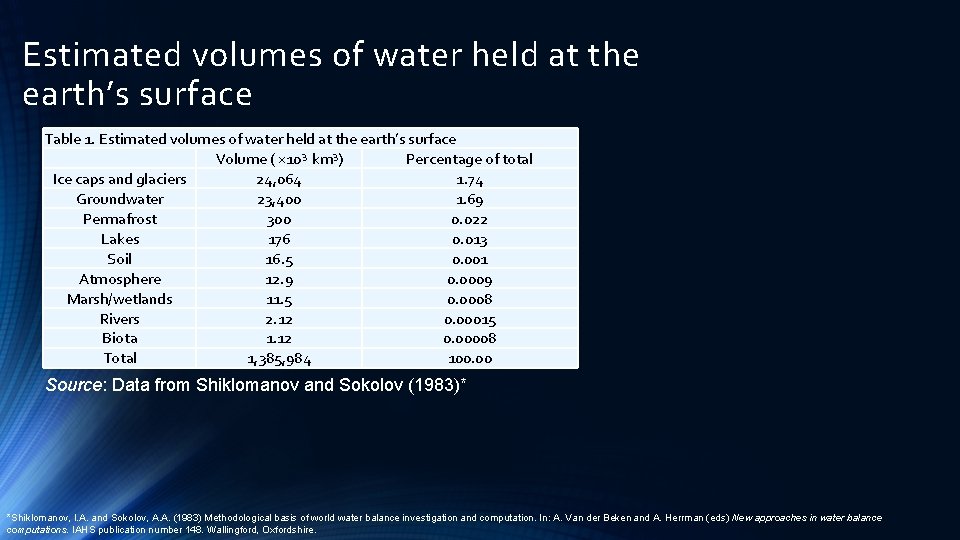
Estimated volumes of water held at the earth’s surface Table 1. Estimated volumes of water held at the earth’s surface Volume ( × 103 km 3) Percentage of total Ice caps and glaciers 24, 064 1. 74 Groundwater 23, 400 1. 69 Permafrost 300 0. 022 Lakes 176 0. 013 Soil 16. 5 0. 001 Atmosphere 12. 9 0. 0009 Marsh/wetlands 11. 5 0. 0008 Rivers 2. 12 0. 00015 Biota 1. 12 0. 00008 Total 1, 385, 984 100. 00 Source: Data from Shiklomanov and Sokolov (1983)* *Shiklomanov, I. A. and Sokolov, A. A. (1983) Methodological basis of world water balance investigation and computation. In: A. Van der Beken and A. Herrman (eds) New approaches in water balance computations. IAHS publication number 148. Wallingford, Oxfordshire.
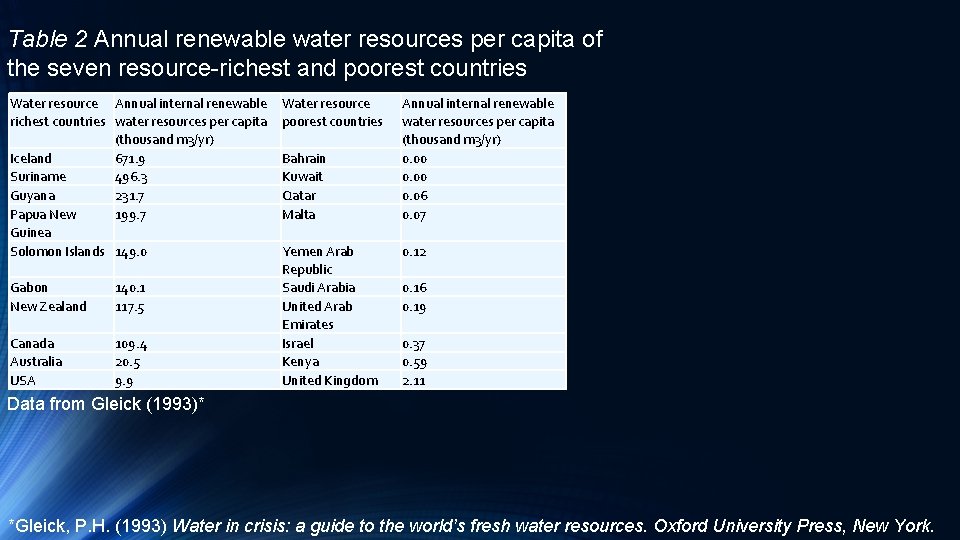
Table 2 Annual renewable water resources per capita of the seven resource-richest and poorest countries Water resource Annual internal renewable Water resource richest countries water resources per capita poorest countries (thousand m 3/yr) Iceland 671. 9 Bahrain Suriname 496. 3 Kuwait Guyana 231. 7 Qatar Papua New 199. 7 Malta Guinea Solomon Islands 149. 0 Yemen Arab Republic Gabon 140. 1 Saudi Arabia New Zealand 117. 5 United Arab Emirates Canada 109. 4 Israel Australia 20. 5 Kenya USA 9. 9 United Kingdom Annual internal renewable water resources per capita (thousand m 3/yr) 0. 00 0. 06 0. 07 0. 12 0. 16 0. 19 0. 37 0. 59 2. 11 Data from Gleick (1993)* *Gleick, P. H. (1993) Water in crisis: a guide to the world’s fresh water resources. Oxford University Press, New York.
The websites for the general sources of hydrological information http: //worldwater. org/ http: //www. whycos. org/whycos/ http: //en. unesco. org/themes/water-security http: //www. who. int/water_sanitation_health/en/