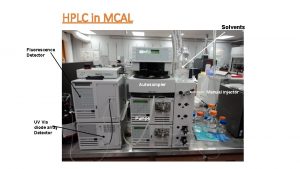
HPLC in MCAL Solvents Fluorescence Detector Autosampler Manual


![Stationary Phase Polarity Spectrum • Silica has an active, hydrophilic [water-loving] surface containing acidic Stationary Phase Polarity Spectrum • Silica has an active, hydrophilic [water-loving] surface containing acidic](https://slidetodoc.com/presentation_image_h2/0defa458edbc042bb44eb0b18dae29ec/image-28.jpg)


- Slides: 34

HPLC in MCAL Solvents Fluorescence Detector Autosampler Manual injector UV Vis diode array Detector Pumps

HPLC Image System control- Data storage HPLC column (C 18 packing) Injector Autosampler Sample Detector(s) Solvent(s) (Diode Array & Pump(s) Fluorescence) Waste

Separation in HPLC • Seperation depends on : • Polarity of molecule • RP verses NP column, • Hilic, Hydrophilic-Interaction Chromatography • Hic, Hydrophobic-interaction Chromatography • Electrical charge (ion exchange chromatography). • Anion exchanger attracts” –” charged analyte • Cation exchanger attracts “+” charged analyte • Molecular size • Size exclusion or gel permeation chromatography

Columns - Heart of System • Solid Support (column packing) - Backbone for bonded phases. Usually 10µ, 5µ, 3µ, 2. 5µ siloxane or polymeric particles. • Porous or solid core • Packing has different degrees of polarity depending on functional groups attached • Bonded Phases - Functional groups chemically bound to the solid support.

HPLC - Modes • Normal Phase - Polar stationary phase and non-polar solvent. • Reverse Phase (used for caffeine and quinine separation) - Non-polar stationary phase and a polar solvent.

Normal Phase verses Reverse Phase HPLC Packing Polar packing Non-polar packing C 4 C 8 C 18

HPLC Solid Support C 18 RP CH 3 Si O CH 2 Si CH 3 O Si O O CH 2 OH CH 3 O Si (CH 2)18 CH 3 Gel Surface Bonded phase CH 2 (CH 2)14

HPLC Solid Support C 18 RP End Capping CH 3 Si O CH 2 Si CH 2 CH 3 O Si O O CH 2 + Si (CH 2)2 OH CH 3 O Si (CH 2)18 CH 3 Gel Surface Bonded phase (CH 2)14

HPLC Solid Support C 18 RP Polymeric CH 3 Si O CH 2 Si CH 3 O Si O O CH 2 O O Si (CH 2)18 CH 3 Gel Surface Bonded phase CH 2 (CH 2)14

HPLC Solid Support C 18 RP Polymeric OH Si O O CH 2 O O Si (CH 2)18 CH 3 Gel Surface Bonded phase CH 2 (CH 2)14

Solid Core Particle Solid Core Porous Outer Layer

Core-Shell Particle

Core-Shell Particle

HPLC Columns (MCAL) • C 18 Microsorb (Varian)5 u 100 A 250 x 4. 5 mm • C 18 Polar Synergi (Phenomenex) 4 u 80 A 250 x 4. 5 mm • C 18 RP Particil column (Varian) 3 u 300 A 100 x 2. 0 mm • C 18 Hilic column (Phenomenex) 5 u 200 A 150 x 4. 6 mm • XB-C 18 RP Kinetex (Phenomenex) 2. 6 u 100 A 100 x 4. 6 mm • C 18 Microsorb (Varian) 5 u 100 A 250 x 4. 5 • C 8 Polaris (Varian) 3 u –A 50 x 20 mm

Manual Injector HPLC columns

Solvents for RP • H 2 O most polar with decreasing polarity as solvent B added to mix. Solvent B usually Me. OH, acetonitrile, iso-propanol • Can be isocratic mixture - 1 or 2 pump system or • Gradient – need at least two pumps and mixing apparatus. • Caffeine-quinine exp. uses buffer-acetonitrile or buffer- methanol gradient mixing.

The Theoretical Plate Model of Chromatography • The plate model supposes that the chromatographic column contains a large number of separate layers, called theoretical plates (N). • Separate equilibrations of the sample between the stationary and mobile phase occur in these "plates". • The analyte moves down the column by transfer of equilibrated mobile phase from one plate to the next.

Chromatographic Resolution Depends On: 1. Column efficiency (N) peak width Particle diameter Flow rate Sol. Viscosity Temp. Col. Length Col. diameter 2. Solvent efficiency (α) retention time Stationary phase Mobile phase Solvent composition Temperature

Column Efficiency -Theoretical plate numbers (N) Theoretical plate numbers are indirect measure of peak width for a peak at a specific retention time. Columns with high plate numbers are considered to be more efficient, that is, have higher column efficiency, than columns with a lower plate count. A column with a high number of theoretical plates will have a narrower peak at a given retention time than a column with a lower N number. N=5. 545(tr/wh)2

Column Efficiency -Height equivalent to theoretical plates • Measure of the resolving power of the column HETP = L/N L = Length of column N = Theoretical plates At each theoretical plate one equilibrium distribution of solute between mobile phase and stationary phase occurs.

Peak Seperation (α) On stationary phases where the alphas (α) are small, more efficient columns (higher N) are beneficial. Column efficiency is a function of: a) the column dimensions (diameter, length and film thickness), b) the type of carrier solvent and its flow rate or average linear velocity, and c) the compound and its retention.

Band broadening theory (Van Deemter equation) • column band broadening originates from three main sources: • multiple path of an analyte through the column packing; • molecular diffusion; • effect of mass transfer between phases.

Multiple path (Eddy diffusion) • The velocity of mobile phase in the column may vary significantly across the column diameter, depending on the particle shape, porosity, and the whole bed structure.

Measure of the Resolving Power of the Column HETP = A + B / u + C u • A = eddy diffusion take different paths (different lengths). • B = longitudinal diffusion analyte diffuses from centre to outer edge. • C = resistance to mass transfer: analyte strong affinity for stationary and veloscity of mobile phase is high. • U = avg veloscity of mobile phase

Resolving Power α N N α

Column efficiency is reported as plates per meter (N/Meter). • Smaller average packing particle size = Larger N • Broader particle size distribution = Smaller N • Better packing procedures = Larger N

Polarity - Elotropic Series • Water is at the polar end of mobile-phase-solvent scale, • Hexane, an aliphatic hydrocarbon, is at the non-polar end. • In between, single solvents, as well as miscible-solvent mixtures
![Stationary Phase Polarity Spectrum Silica has an active hydrophilic waterloving surface containing acidic Stationary Phase Polarity Spectrum • Silica has an active, hydrophilic [water-loving] surface containing acidic](https://slidetodoc.com/presentation_image_h2/0defa458edbc042bb44eb0b18dae29ec/image-28.jpg)
Stationary Phase Polarity Spectrum • Silica has an active, hydrophilic [water-loving] surface containing acidic silanol [silicon-containing analog of alcohol] • The polarity of the silica surface may be modified selectively by chemically bonding to it less polar functional group like • n-octylsilyl- [C 8], and n-octadecylsilyl- [C 18, ODS] moieties. The latter is a hydrophobic [water-hating], very non-polar packing.

HPLC Experiment • Seperation and identification of caffeine, quinine and added theophylline (internal standard) in commercial drinks • Comparison of different quantitation methods (external standard, internal standard) • Uv verses fluorescent detection • Diode array detection

HPLC Experiment • The separation is done on a C 18 or C 12 RP column. • The solvent is a 20% methanol in water (low ph with TEA added) increased to 25% methanol. • The caffeine comes off column before the quinine.

HPLC Exp: Caffeine and Quinine Rt = 11. 6 min Caffeine wavelength 206 Rt = 9. 2 min Caffeine wavelength 273 Rt = 9. 2 min

Diode Array Detector Caffeine

Detection with HPLC • Ultraviolet light source (deuterium lamp 190 to 950 nm) • Visible light source (quartz iodide 350 nm and beyond) • Flurescent light (Xenon lamp) • Excitation and emmission wavelength selection

Concentration Of Analytes • Concentration is determined by measuring the area of known concentrations of caffeine and quinine, and making a standard curve. • Concentration of caffeine is also determined by adding an internal standard (IS) and calculating caffeine based on the response factor of the IS. Y= area Y = mx + b X = concentration
 Mcal/lb
 Detectors used in hplc
 Application of hplc
 Hplc detector types
 Cold vapor atomic fluorescence spectrometry
 Draw jablonski diagram
 Flip frap
 Atomic fluorescence spectroscopy ppt
 Explain quantum yield
 Fluorescence microscopy uses
 Atomic fluorescence spectroscopy principle
 Beer's law fluorescence
 Chemiluminescence vs fluorescence
 Fluorescence microscopy
 Fluorescence activated cell sorting
 Principles of fluorescence spectroscopy
 Cold vapor atomic fluorescence spectrometry
 Biotek flx800 fluorescence microplate reader
 Rfu relative fluorescence units
 Principle of fluorescence spectroscopy
 Fluorescence recovery after photobleaching
 Fluorescence activated cell sorting
 Fluorescence-activated cell sorting (facs)
 Light sources for fluorescence microscopy
 Definition of microscopy
 Jablonski diagramm
 Confocal fluorescence microscopy
 Martin hof
 Fluorescence bandpass filter
 Types of solvents
 Types of respirator cartridges
 Usp solubility
 Example of monophasic liquid dosage form
 Partition coefficient extraction
 Non aqueous solvent example

