How to Learn Everything You Ever Wanted to






- Slides: 97
How to Learn Everything You Ever Wanted to Know About Biostatistics Daniel W. Byrne Director of Biostatistics and Study Design General Clinical Research Center Vanderbilt University Medical Center 1 The presenter has no financial interests in the products mentioned in this talk.
Objective of This Workshop n To provide a 1 -hour overview of the important practical information that a clinical investigator needs to know about biostatistics to be successful. 2
I. You Will Need the Right Tools 3
Install a powerful, yet easy to use, statistical software package on your computer. n I recommend SPSS for Windows. n Bring an 1180 for $80 to Karen Montefiori in 143 Hill Student Center (3 -1630). n She will lend you the SPSS CD for the day and you can install this software easily. 4
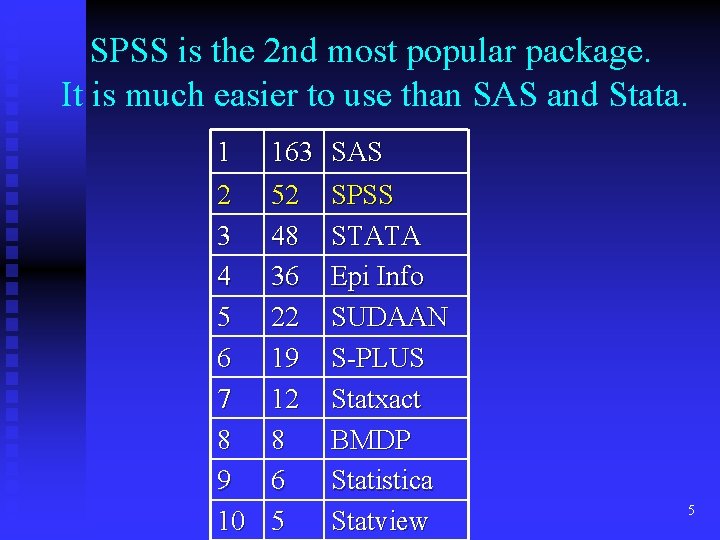
SPSS is the 2 nd most popular package. It is much easier to use than SAS and Stata. 1 163 SAS 2 3 4 5 6 7 8 9 10 52 48 36 22 19 12 8 6 5 SPSS STATA Epi Info SUDAAN S-PLUS Statxact BMDP Statistica Statview 5
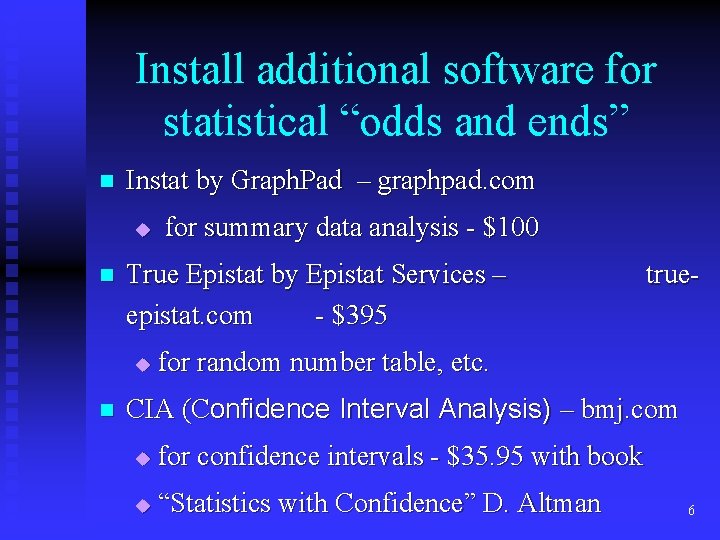
Install additional software for statistical “odds and ends” n Instat by Graph. Pad – graphpad. com u n True Epistat by Epistat Services – epistat. com - $395 u n for summary data analysis - $100 true- for random number table, etc. CIA (Confidence Interval Analysis) – bmj. com u for confidence intervals - $35. 95 with book u “Statistics with Confidence” D. Altman 6
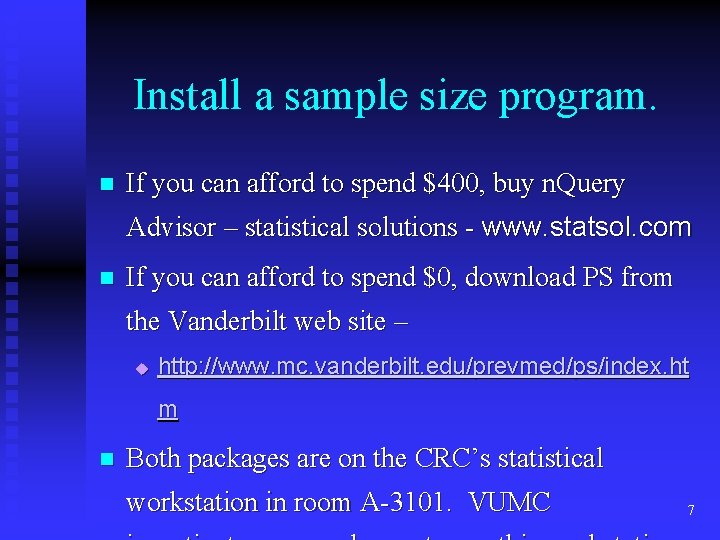
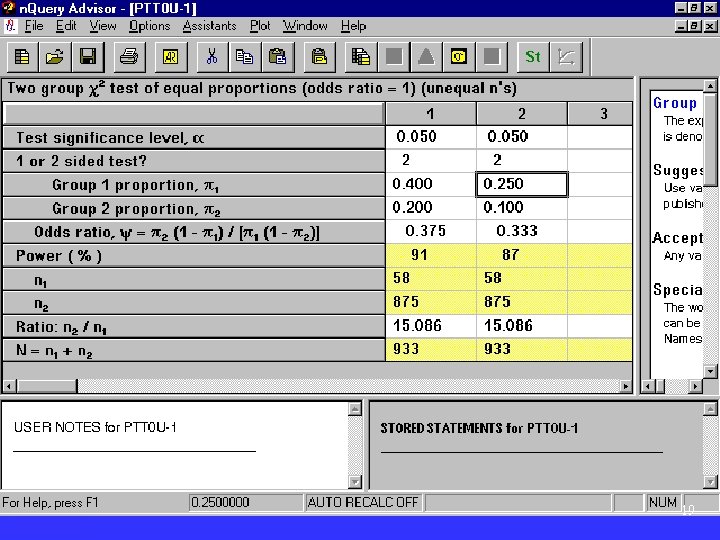
Install a sample size program. n If you can afford to spend $400, buy n. Query Advisor – statistical solutions - www. statsol. com n If you can afford to spend $0, download PS from the Vanderbilt web site – u http: //www. mc. vanderbilt. edu/prevmed/ps/index. ht m n Both packages are on the CRC’s statistical workstation in room A-3101. VUMC 7
II. You Will Need a Plan 8
Use the scientific method to keep your project focused. n n n State the problem Formulate the null hypothesis Design the study Collect the data Interpret the data Draw conclusions 9
State the Problem n n Among patients hospitalized for a hip fracture who develop pneumonia during their stay in the hospital, the mortality rate is 2. 3 times higher at non-trauma centers compared with trauma centers u (48. 7% vs. 21. 1%, P=0. 043. ) It is not clear if, or how, those who will develop pneumonia could be identified on admission. 10
Formulate the Null Hypothesis n Among patients hospitalized for treatment of a hip fracture, there are no factors known upon admission that are statistically different between those who develop pneumonia during their stay and those who do not. 11
Why bother with a null hypothesis? n n n For the same reason that we assume that a person is innocent until proven guilty. The burden of responsibility is on the prosecutor to demonstrate enough evidence for members of a jury to be convinced of that the charges are true and to change their minds. Outcome after treatment with Drug A will not be significantly different from placebo. 12
Design the Study Data on 933 patients with a hip fracture from a New York trauma registry will be analyzed. n The 58 patients with pneumonia will be compared with the 875 without pneumonia. n 13
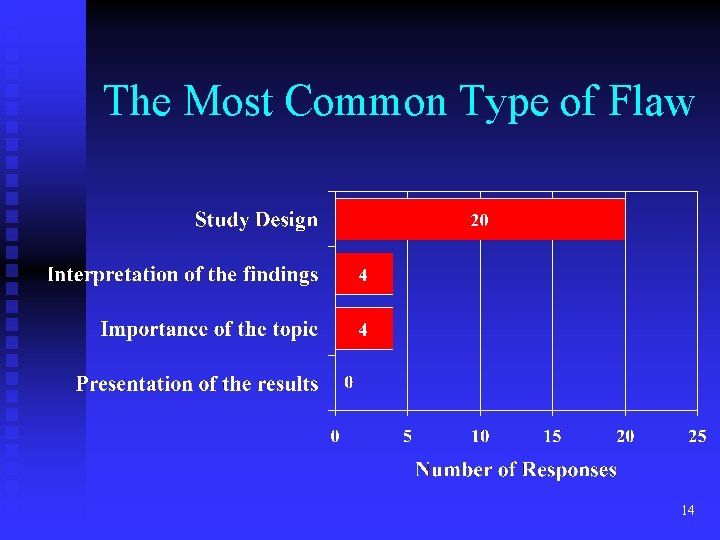
The Most Common Type of Flaw 14
Example of Recall Bias n n n A control group is asked, u “Two weeks ago from today, did you eat X for breakfast? ” Two weeks after their MI, patients are asked u “Did you eat X for breakfast on the day of your heart attack? ” You can prove any food causes an MI using this method (X=bacon, X=Flintstone vitamins, etc. ) 15
John Bailar’s Quote: “Study design and bias are much more important than complex statistical methods. ” n Devote more time to improving the study design, and minimizing and measuring bias. n Become an expert at study design issues and biases in your area of research. n 16
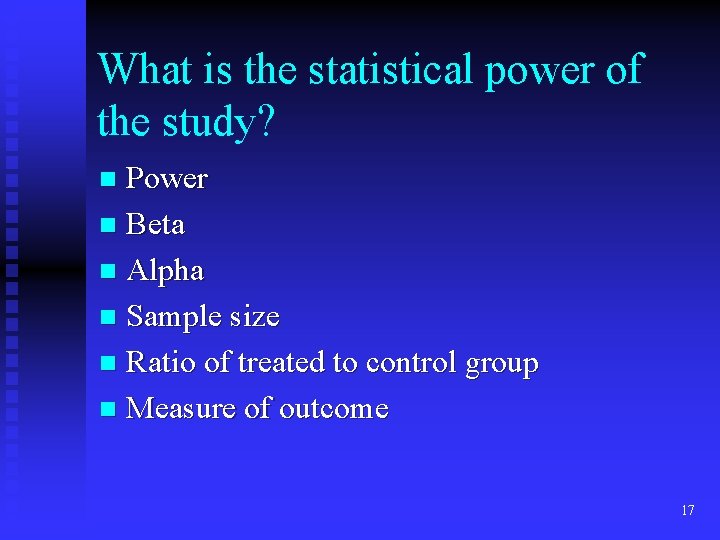
What is the statistical power of the study? Power n Beta n Alpha n Sample size n Ratio of treated to control group n Measure of outcome n 17
Sample Size Table n See Table 9 -1 in the handout u “Sample Size Requirements for Each of Two Groups”. 18
19
Collect the Data n See the handouts for: u I TEC Trauma Systems Study 20
III. You Will Need Data Management Skills 21
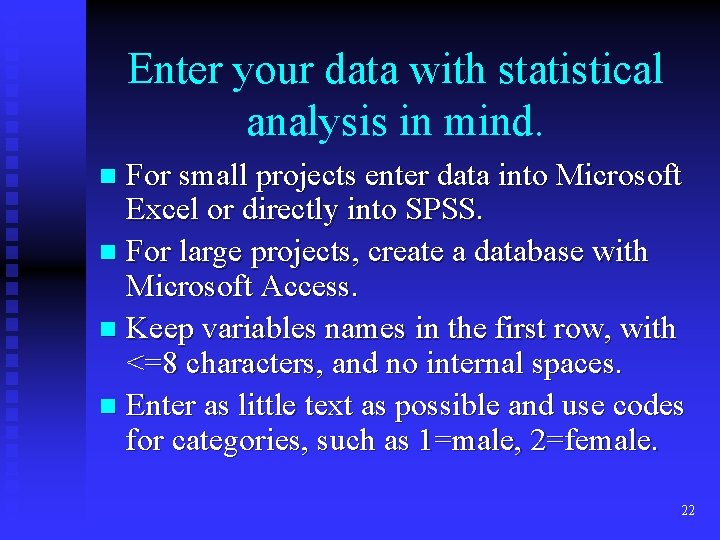
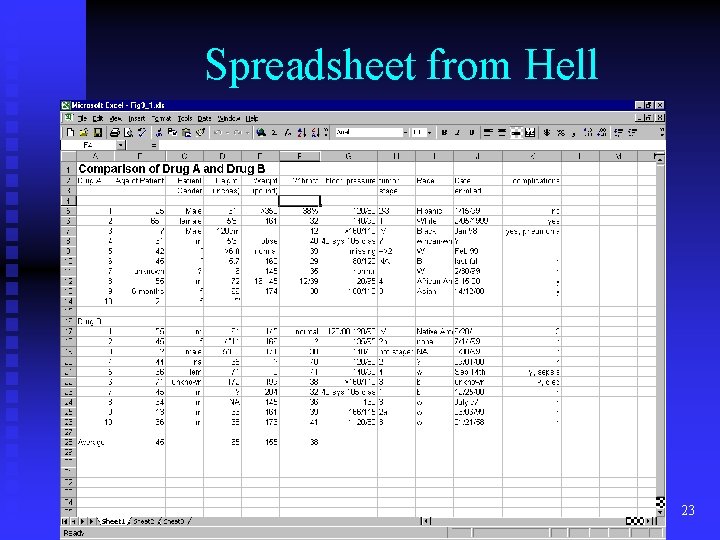
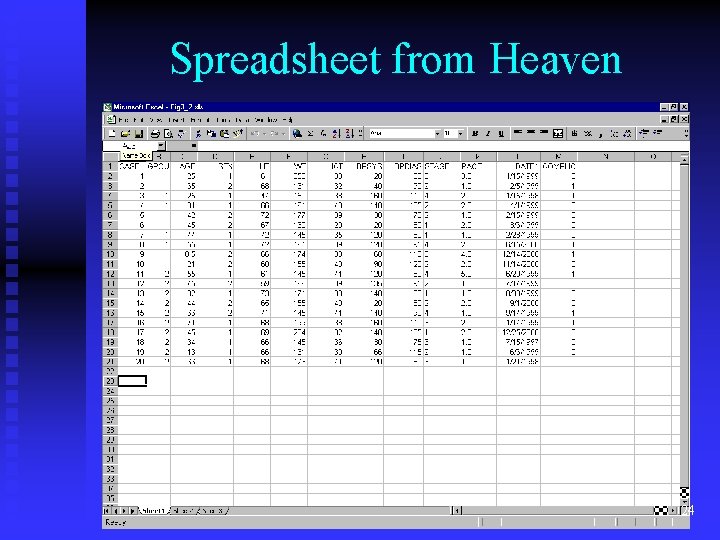
Enter your data with statistical analysis in mind. For small projects enter data into Microsoft Excel or directly into SPSS. n For large projects, create a database with Microsoft Access. n Keep variables names in the first row, with <=8 characters, and no internal spaces. n Enter as little text as possible and use codes for categories, such as 1=male, 2=female. n 22
Spreadsheet from Hell 23
Spreadsheet from Heaven 24
IV. You Will Need to Learn Descriptive Statistics 25
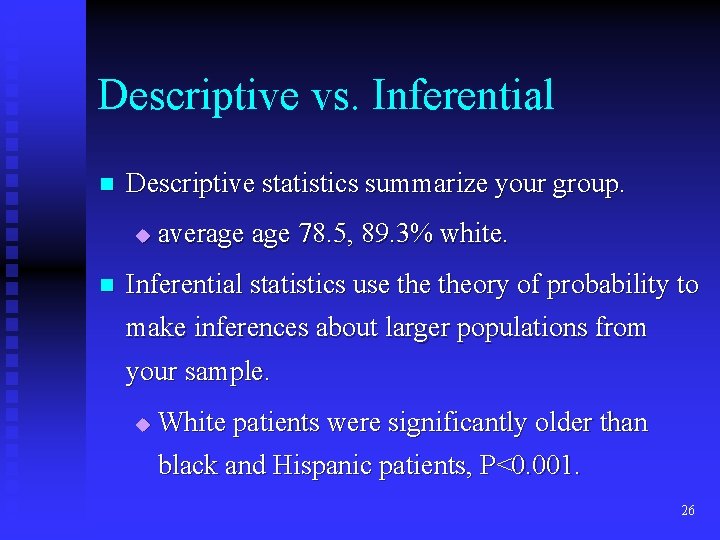
Descriptive vs. Inferential n Descriptive statistics summarize your group. u n average 78. 5, 89. 3% white. Inferential statistics use theory of probability to make inferences about larger populations from your sample. u White patients were significantly older than black and Hispanic patients, P<0. 001. 26
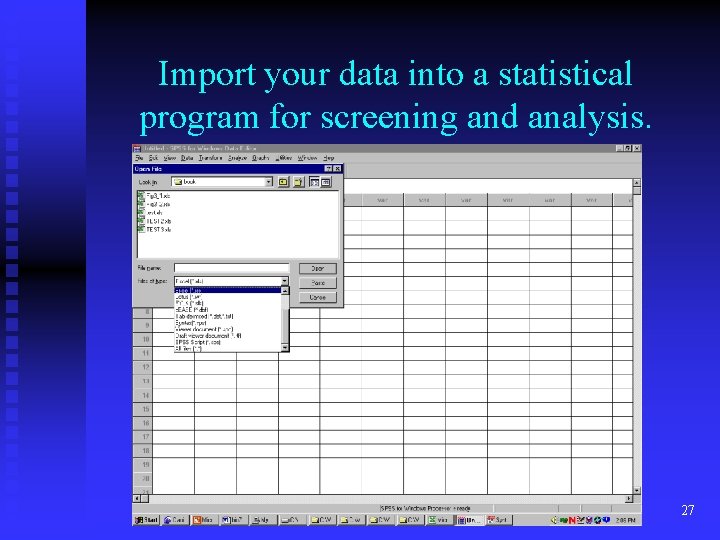
Import your data into a statistical program for screening and analysis. 27
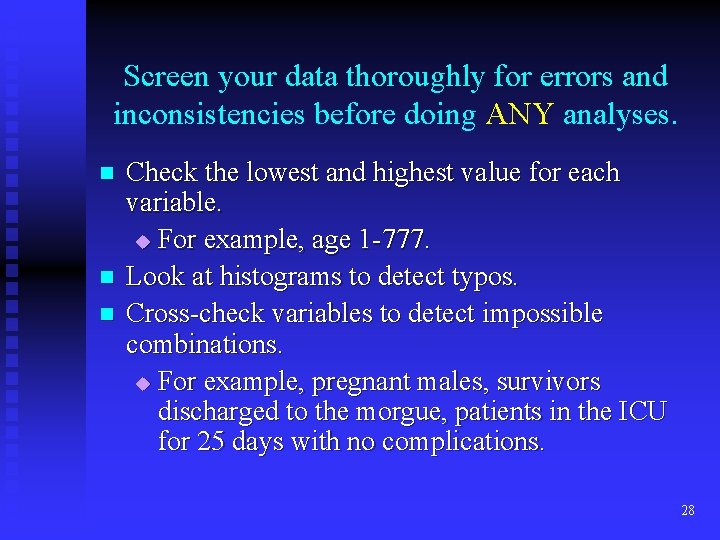
Screen your data thoroughly for errors and inconsistencies before doing ANY analyses. n n n Check the lowest and highest value for each variable. u For example, age 1 -777. Look at histograms to detect typos. Cross-check variables to detect impossible combinations. u For example, pregnant males, survivors discharged to the morgue, patients in the ICU for 25 days with no complications. 28
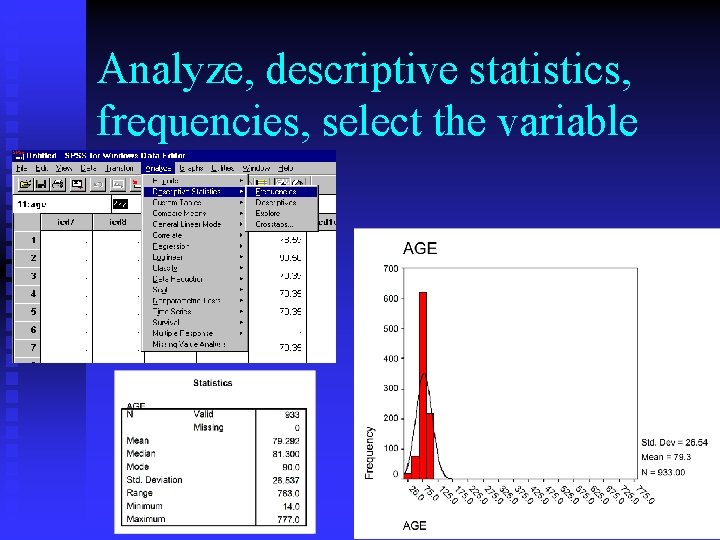
Analyze, descriptive statistics, frequencies, select the variable 29
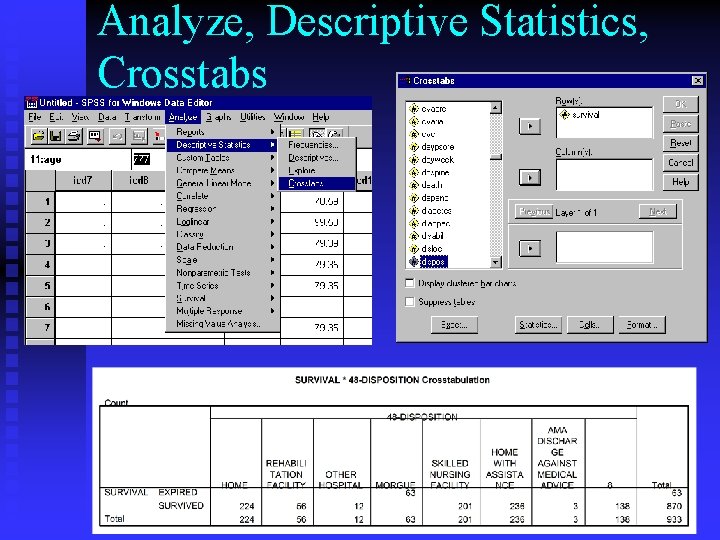
Analyze, Descriptive Statistics, Crosstabs 30
Correct the data in the original database or spreadsheet and import a revised version into the statistical package. n The age of 777 should be checked and changed to the correct age. n Suspicious values, such as an age of 106 should be checked. In this case it is correct. 31
Interpret the Data 32
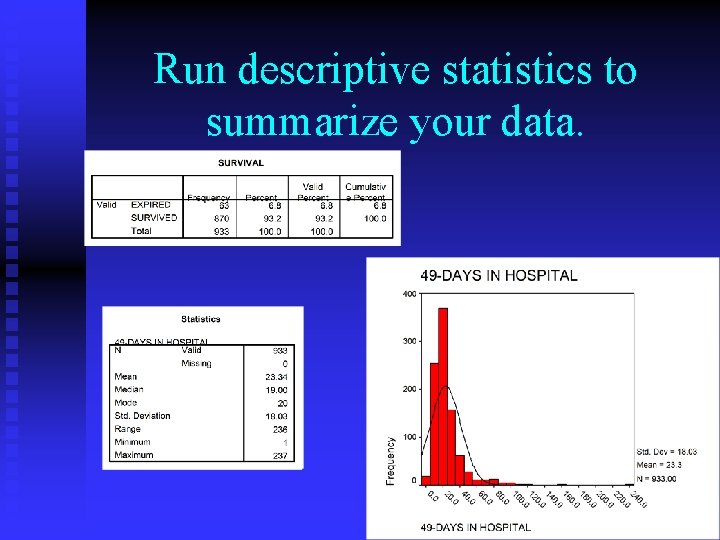
Run descriptive statistics to summarize your data. 33
V. You Will Need to Learn Inferential Statistics 34
P Value n n A P value is an estimate of the probability of results such as yours could have occurred by chance alone if there truly was no difference or association. P < 0. 05 = 5% chance, 1 in 20. P <0. 01 = 1% chance, 1 in 100. Alpha is the threshold. If P is < this threshold, you consider it statistically significant. 35
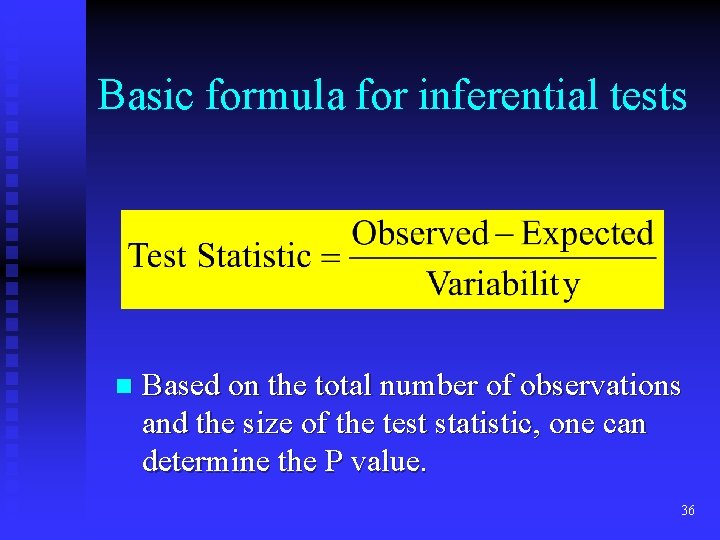
Basic formula for inferential tests n Based on the total number of observations and the size of the test statistic, one can determine the P value. 36
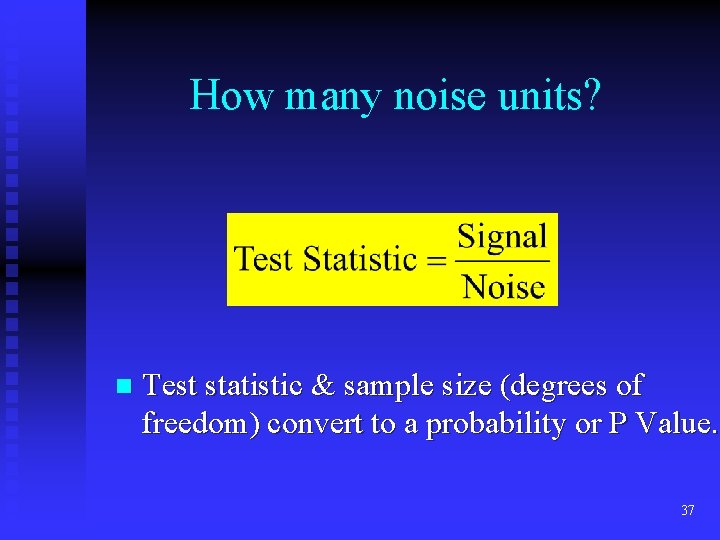
How many noise units? n Test statistic & sample size (degrees of freedom) convert to a probability or P Value. 37
Use inference statistics to test for differences and associations. n There are hundreds of statistical tests. n A clinical researcher does not need to know them all. n Learn how to perform the most common tests on SPSS. n Learn how to use the statistical flowchart to determine which test to use. 38
VI. You Will Need to Understand the Statistical Terminology Required to Select the Proper Inferential Test 39
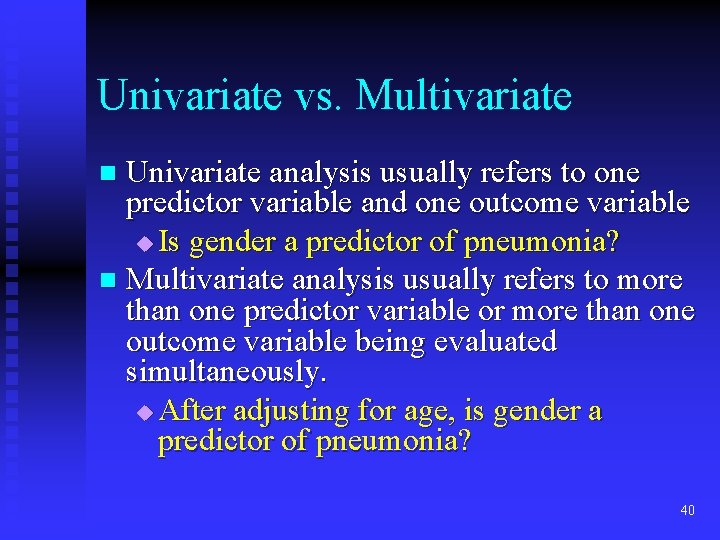
Univariate vs. Multivariate Univariate analysis usually refers to one predictor variable and one outcome variable u Is gender a predictor of pneumonia? n Multivariate analysis usually refers to more than one predictor variable or more than one outcome variable being evaluated simultaneously. u After adjusting for age, is gender a predictor of pneumonia? n 40
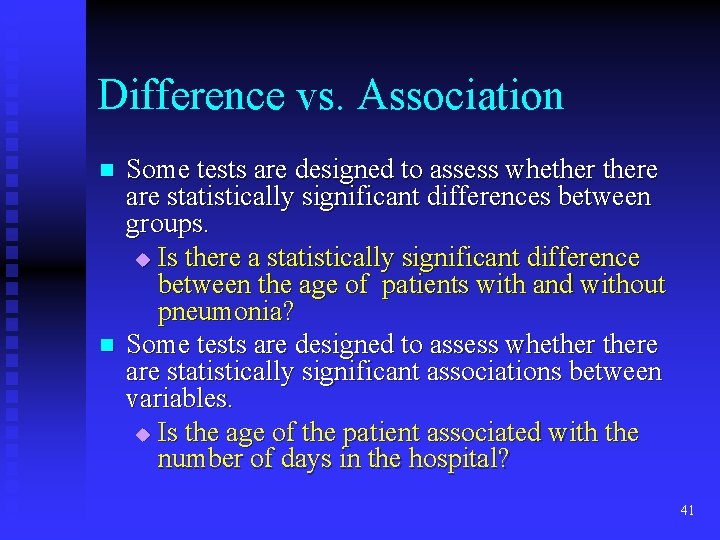
Difference vs. Association n n Some tests are designed to assess whethere are statistically significant differences between groups. u Is there a statistically significant difference between the age of patients with and without pneumonia? Some tests are designed to assess whethere are statistically significant associations between variables. u Is the age of the patient associated with the number of days in the hospital? 41
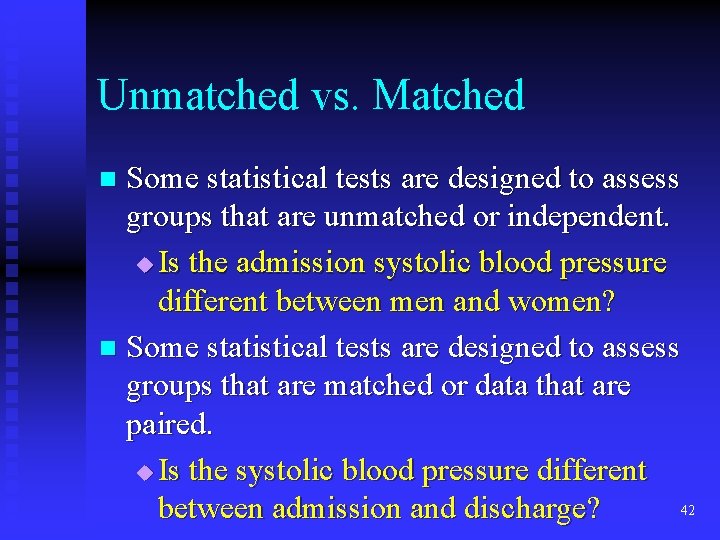
Unmatched vs. Matched Some statistical tests are designed to assess groups that are unmatched or independent. u Is the admission systolic blood pressure different between men and women? n Some statistical tests are designed to assess groups that are matched or data that are paired. u Is the systolic blood pressure different 42 between admission and discharge? n
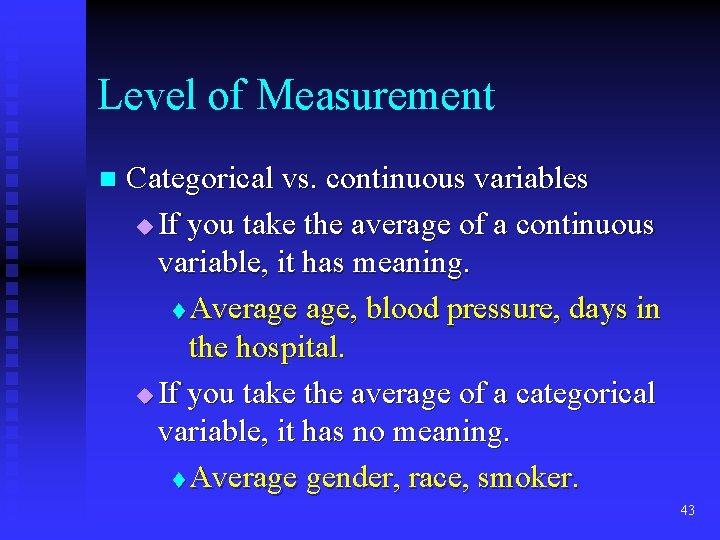
Level of Measurement n Categorical vs. continuous variables u If you take the average of a continuous variable, it has meaning. t Average age, blood pressure, days in the hospital. u If you take the average of a categorical variable, it has no meaning. t Average gender, race, smoker. 43
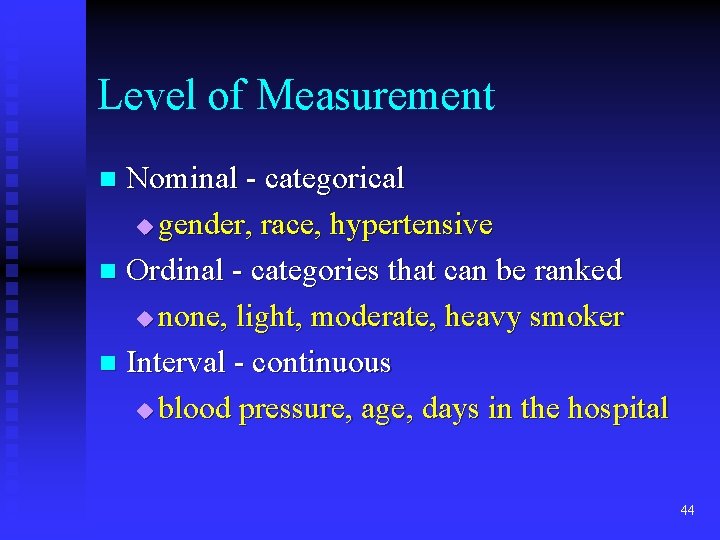
Level of Measurement Nominal - categorical u gender, race, hypertensive n Ordinal - categories that can be ranked u none, light, moderate, heavy smoker n Interval - continuous u blood pressure, age, days in the hospital n 44
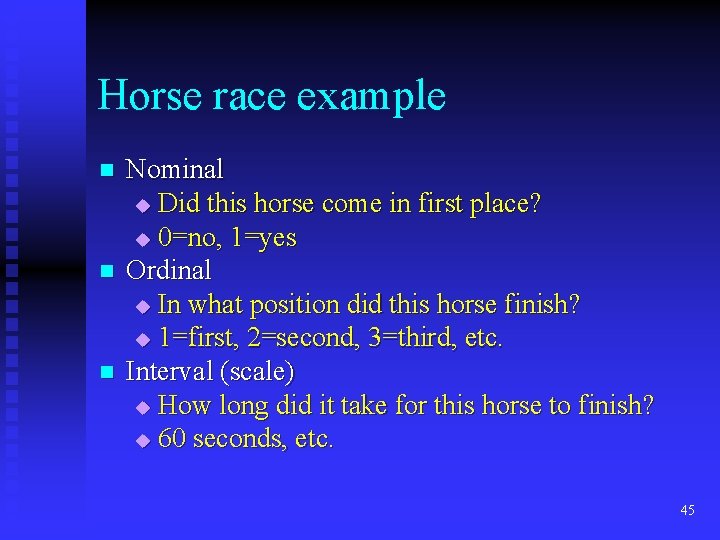
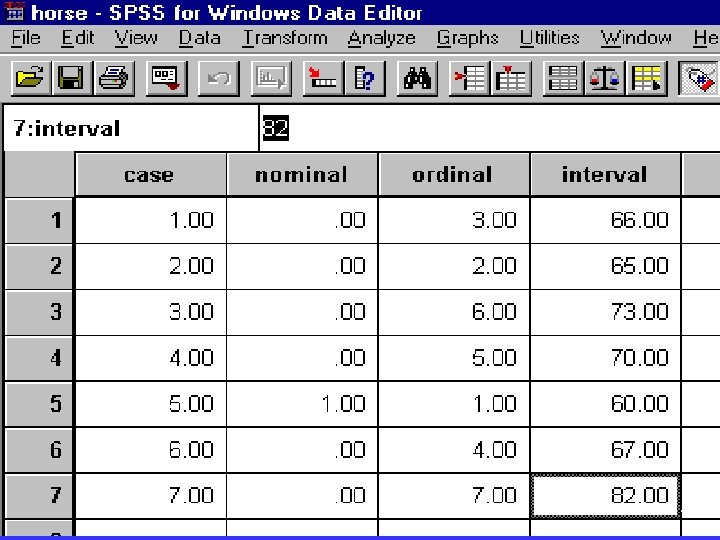
Horse race example n n n Nominal u Did this horse come in first place? u 0=no, 1=yes Ordinal u In what position did this horse finish? u 1=first, 2=second, 3=third, etc. Interval (scale) u How long did it take for this horse to finish? u 60 seconds, etc. 45
46
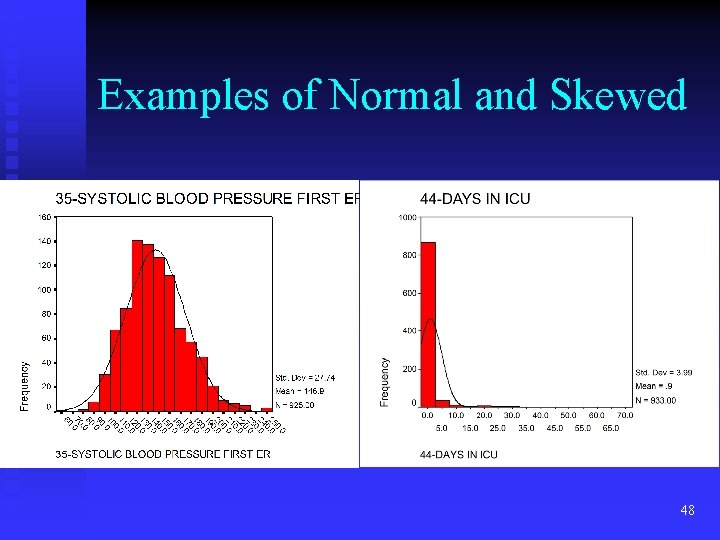
Normal vs. Skewed Distributions Parametric statistical test can be used to assess variables that have a “normal” or symmetrical bell-shaped distribution curve for a histogram. n Nonparamettric statistical test can be used to assess variables that are skewed or nonnormal. n Look at a histogram to decide. n 47
Examples of Normal and Skewed 48
VII. You Will Need to Know Which Statistical Test to Use 49
Flowchart of common inferential statistics n See the handout, Figure 16 -1, pages 78 -79. 50
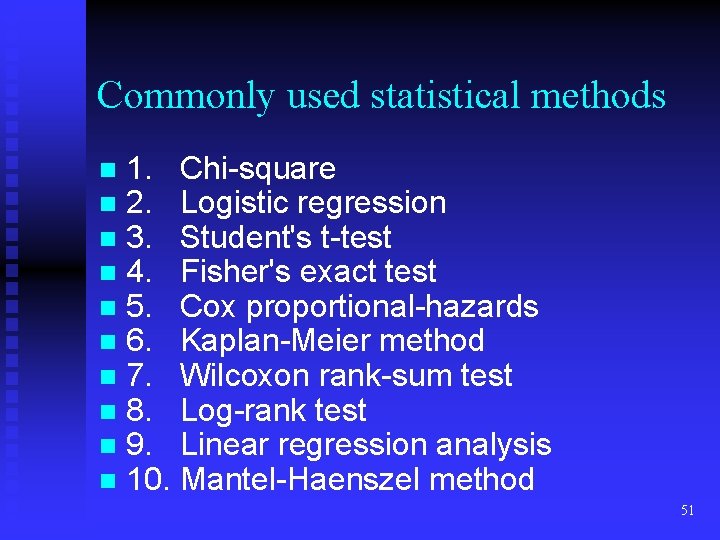
Commonly used statistical methods n n n n n 1. Chi-square 2. Logistic regression 3. Student's t-test 4. Fisher's exact test 5. Cox proportional-hazards 6. Kaplan-Meier method 7. Wilcoxon rank-sum test 8. Log-rank test 9. Linear regression analysis 10. Mantel-Haenszel method 51
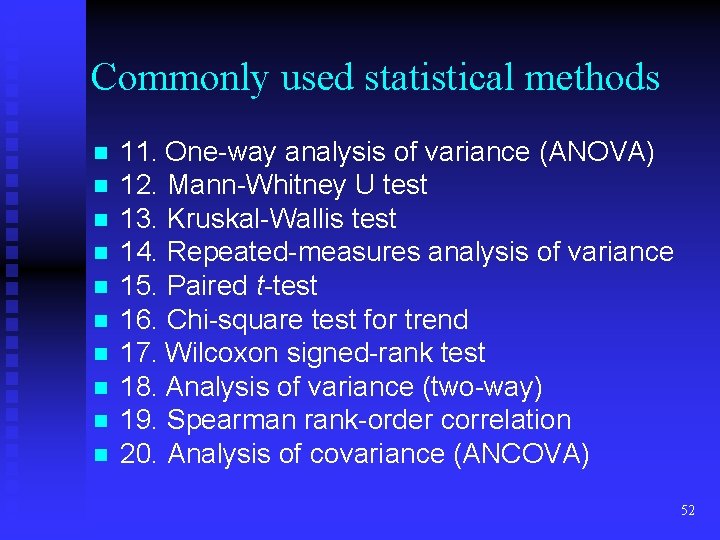
Commonly used statistical methods n n n n n 11. One-way analysis of variance (ANOVA) 12. Mann-Whitney U test 13. Kruskal-Wallis test 14. Repeated-measures analysis of variance 15. Paired t-test 16. Chi-square test for trend 17. Wilcoxon signed-rank test 18. Analysis of variance (two-way) 19. Spearman rank-order correlation 20. Analysis of covariance (ANCOVA) 52
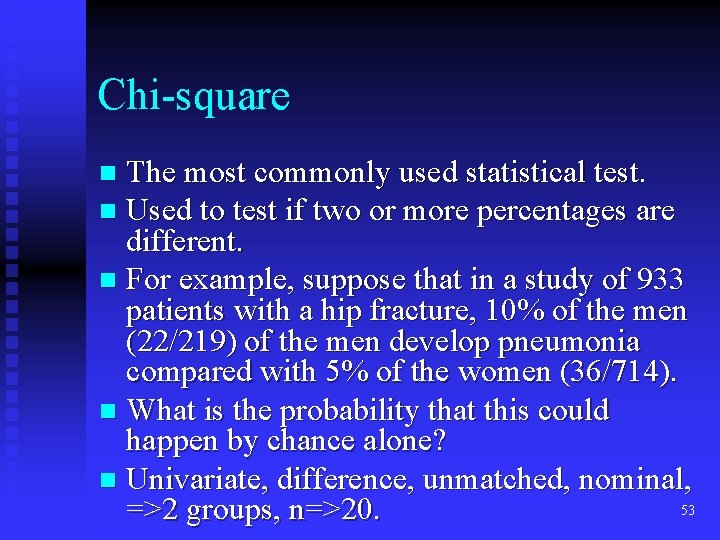
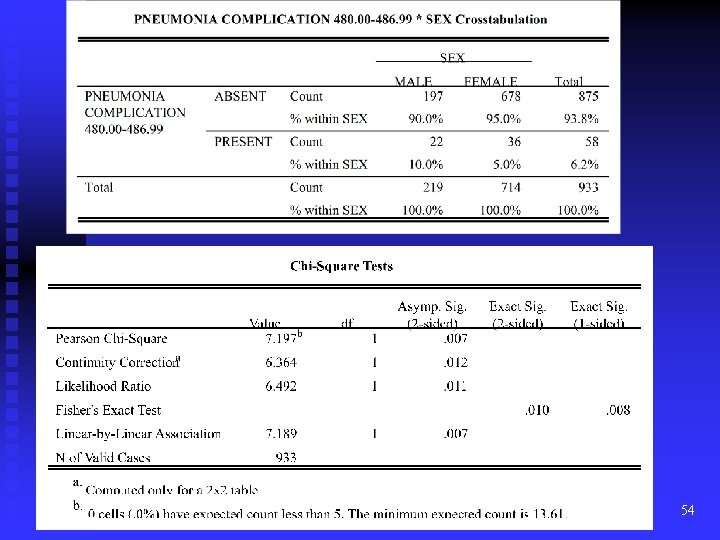
Chi-square The most commonly used statistical test. n Used to test if two or more percentages are different. n For example, suppose that in a study of 933 patients with a hip fracture, 10% of the men (22/219) of the men develop pneumonia compared with 5% of the women (36/714). n What is the probability that this could happen by chance alone? n Univariate, difference, unmatched, nominal, 53 =>2 groups, n=>20. n
Chi-square example 54
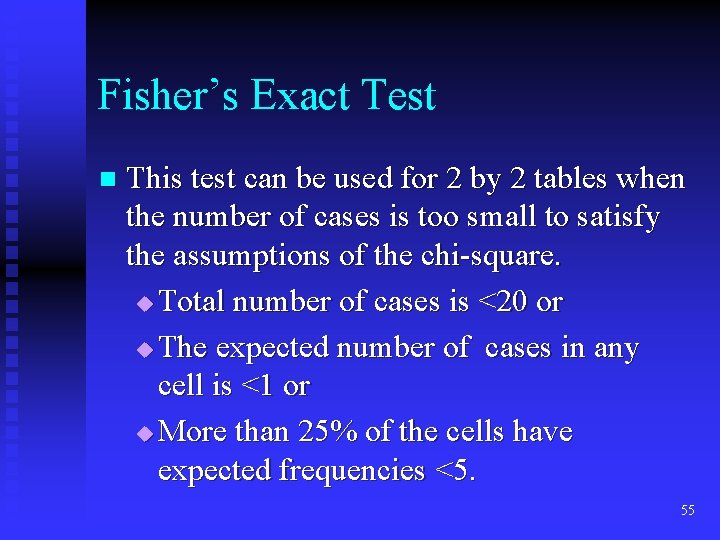
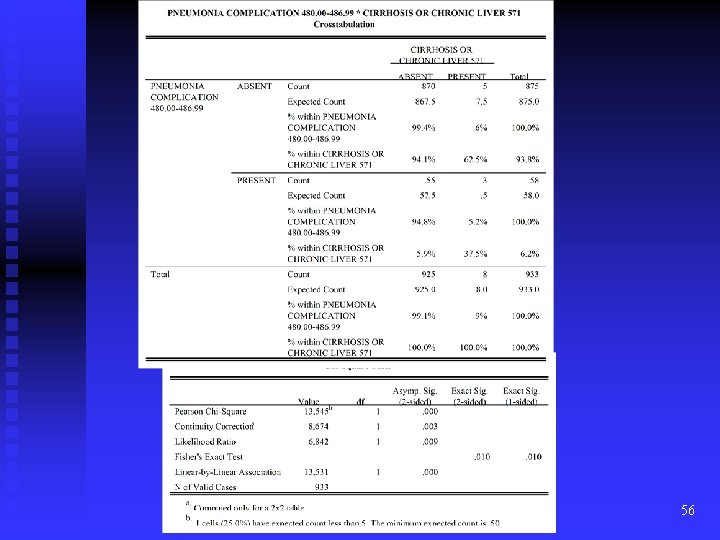
Fisher’s Exact Test n This test can be used for 2 by 2 tables when the number of cases is too small to satisfy the assumptions of the chi-square. u Total number of cases is <20 or u The expected number of cases in any cell is <1 or u More than 25% of the cells have expected frequencies <5. 55
56
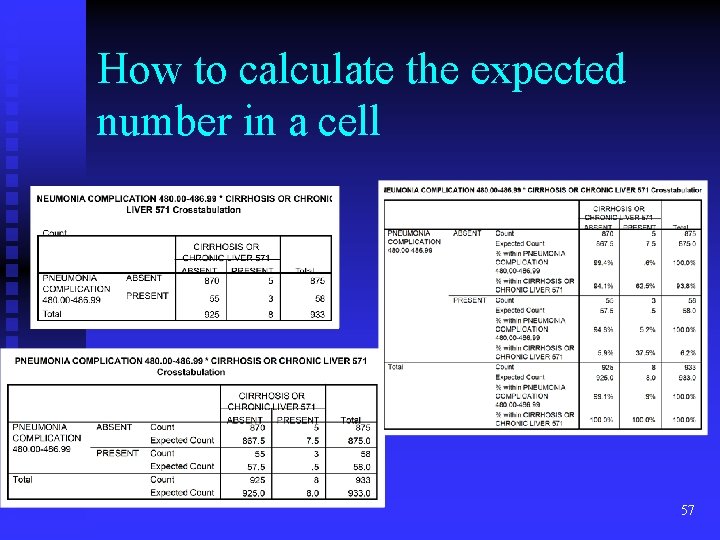
How to calculate the expected number in a cell 57
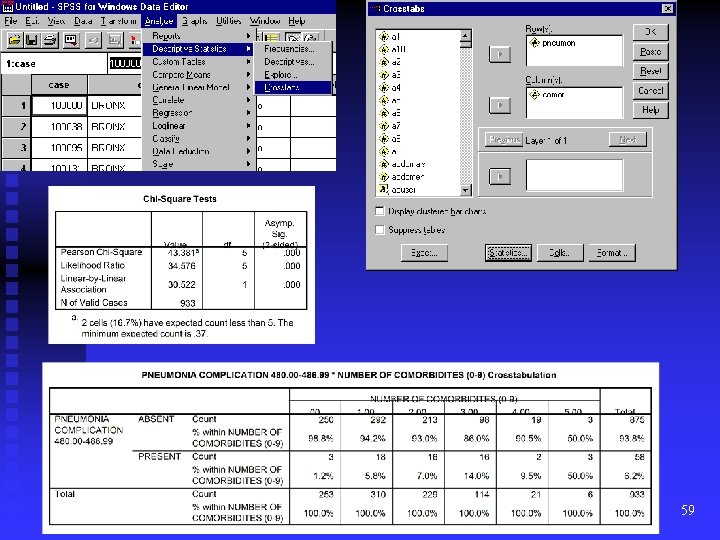
Chi-square for a trend test Used to assess a nominal variable and an ordinal variable. n Does the pneumonia rate increase with the total number of comorbidities? n Univariate, association, nominal. n Analyze, Descriptive Statistics, Crosstabs. n 58
59
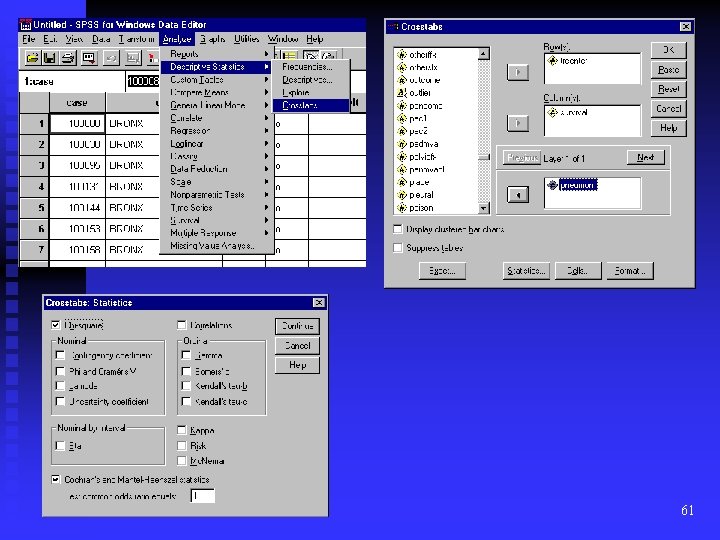
Mantel-Haenszel Method Used to assess a factor across a number of 2 by 2 tables. n Is the mortality rate associated with pneumonia different between trauma centers and nontrauma centers? n Analyze, Descriptive Statistics, Crosstabs. n 60
61
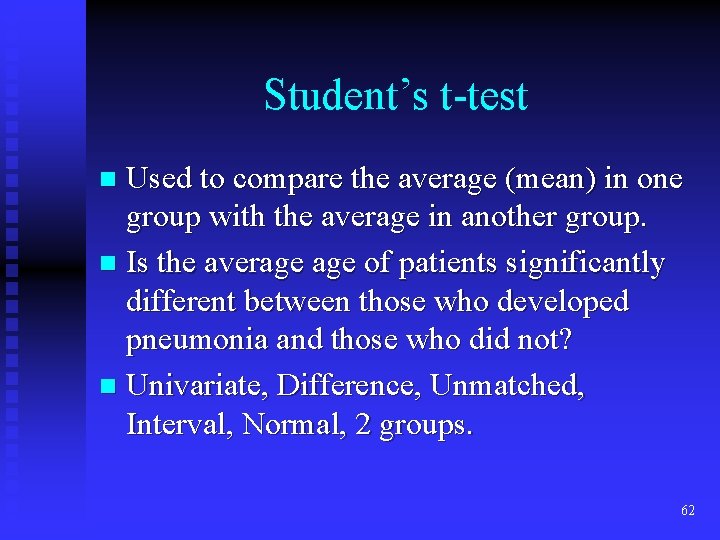
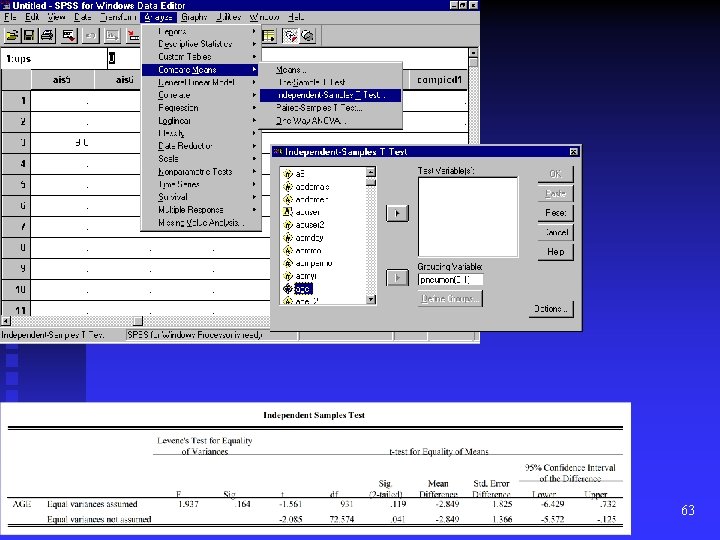
Student’s t-test Used to compare the average (mean) in one group with the average in another group. n Is the average of patients significantly different between those who developed pneumonia and those who did not? n Univariate, Difference, Unmatched, Interval, Normal, 2 groups. n 62
63
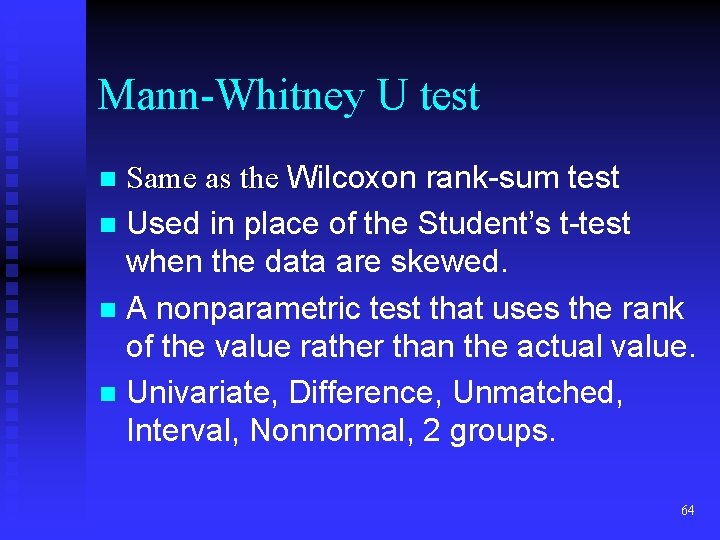
Mann-Whitney U test Same as the Wilcoxon rank-sum test n Used in place of the Student’s t-test when the data are skewed. n A nonparametric test that uses the rank of the value rather than the actual value. n Univariate, Difference, Unmatched, Interval, Nonnormal, 2 groups. n 64
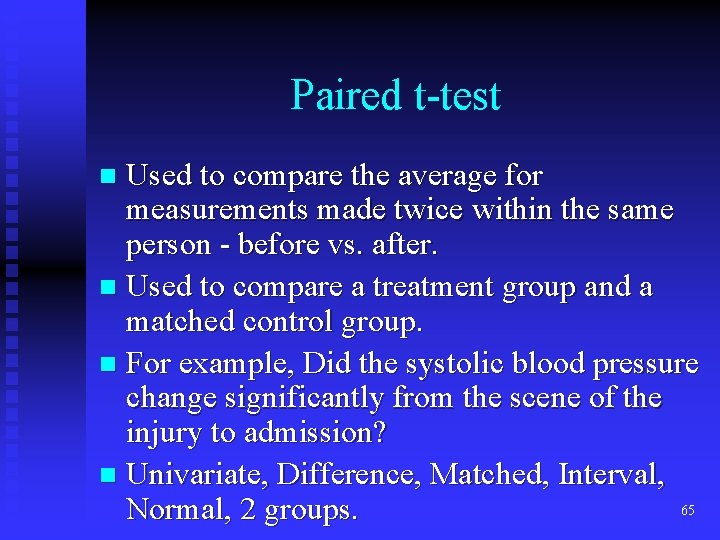
Paired t-test Used to compare the average for measurements made twice within the same person - before vs. after. n Used to compare a treatment group and a matched control group. n For example, Did the systolic blood pressure change significantly from the scene of the injury to admission? n Univariate, Difference, Matched, Interval, 65 Normal, 2 groups. n
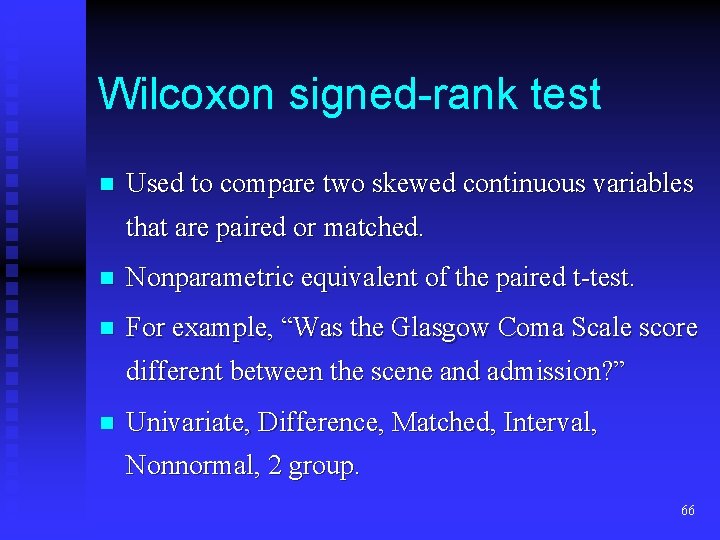
Wilcoxon signed-rank test n Used to compare two skewed continuous variables that are paired or matched. n Nonparametric equivalent of the paired t-test. n For example, “Was the Glasgow Coma Scale score different between the scene and admission? ” n Univariate, Difference, Matched, Interval, Nonnormal, 2 group. 66
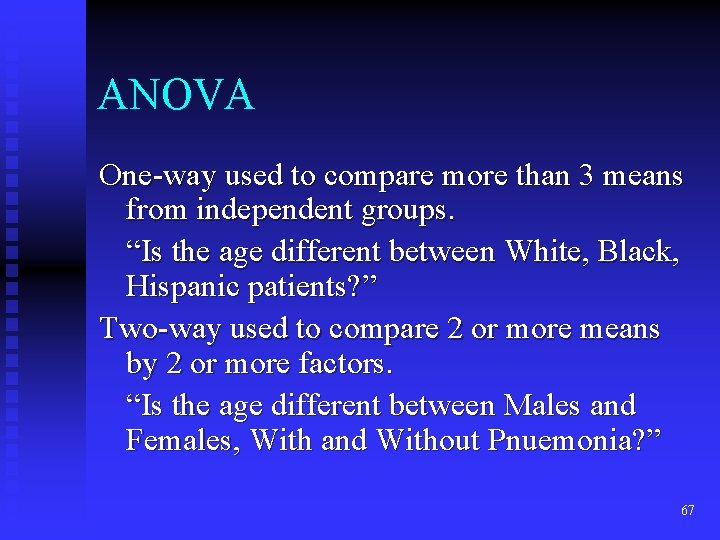
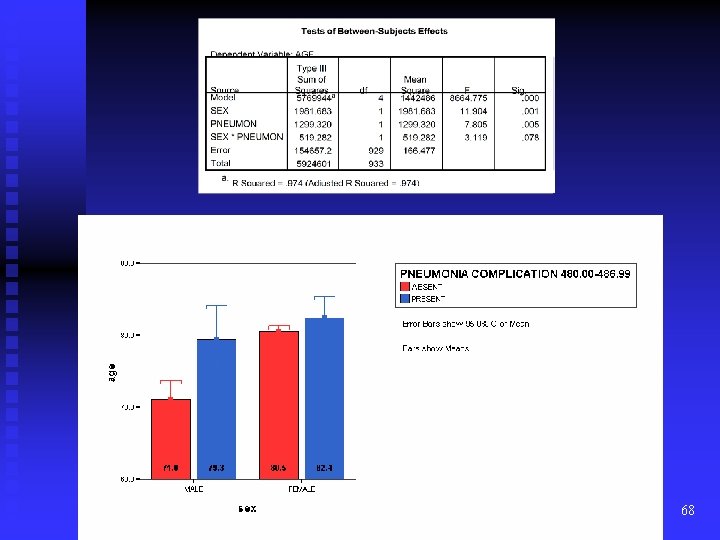
ANOVA One-way used to compare more than 3 means from independent groups. “Is the age different between White, Black, Hispanic patients? ” Two-way used to compare 2 or more means by 2 or more factors. “Is the age different between Males and Females, With and Without Pnuemonia? ” 67
68
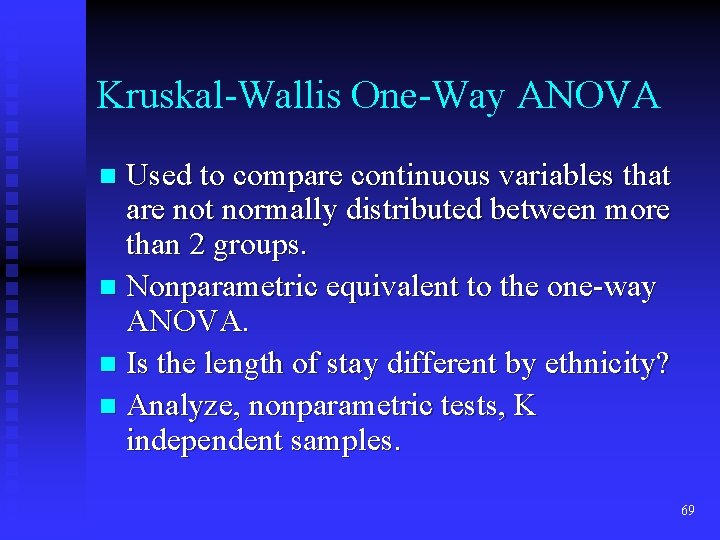
Kruskal-Wallis One-Way ANOVA Used to compare continuous variables that are not normally distributed between more than 2 groups. n Nonparametric equivalent to the one-way ANOVA. n Is the length of stay different by ethnicity? n Analyze, nonparametric tests, K independent samples. n 69
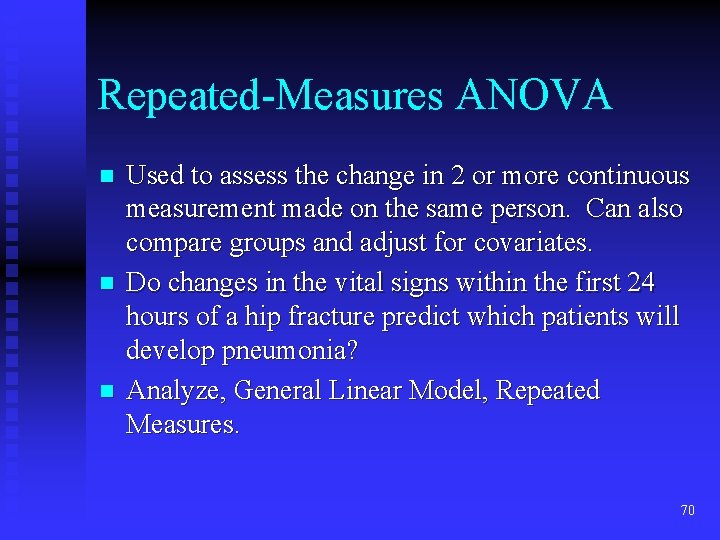
Repeated-Measures ANOVA n n n Used to assess the change in 2 or more continuous measurement made on the same person. Can also compare groups and adjust for covariates. Do changes in the vital signs within the first 24 hours of a hip fracture predict which patients will develop pneumonia? Analyze, General Linear Model, Repeated Measures. 70
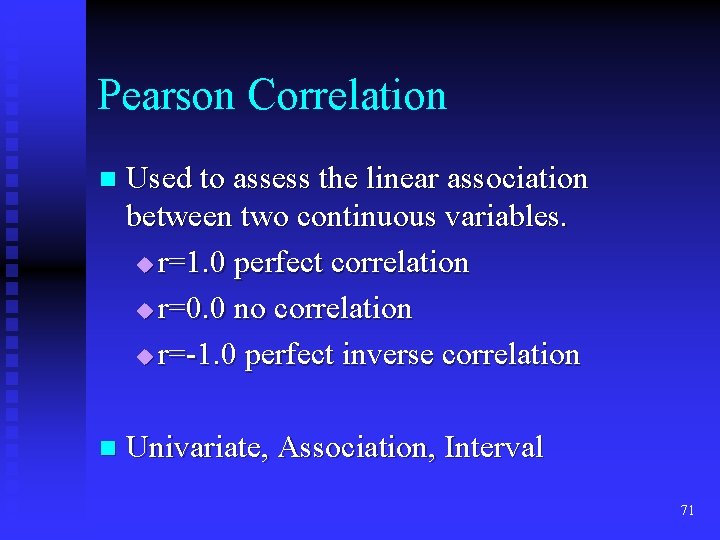
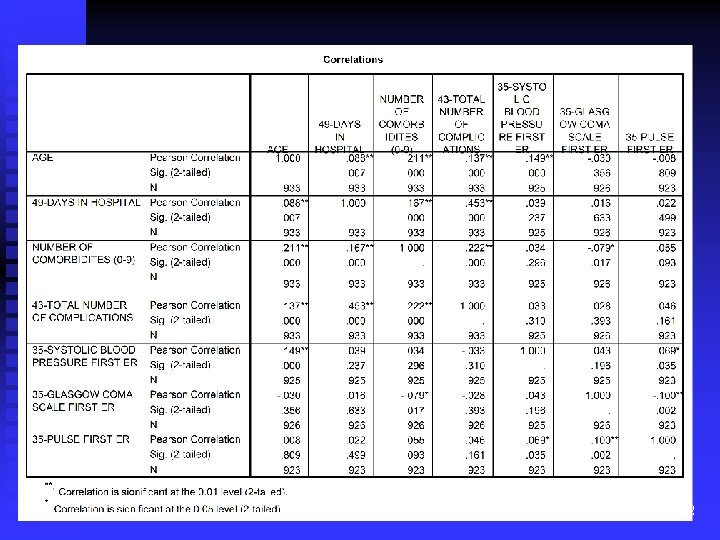
Pearson Correlation n Used to assess the linear association between two continuous variables. u r=1. 0 perfect correlation u r=0. 0 no correlation u r=-1. 0 perfect inverse correlation n Univariate, Association, Interval 71
72
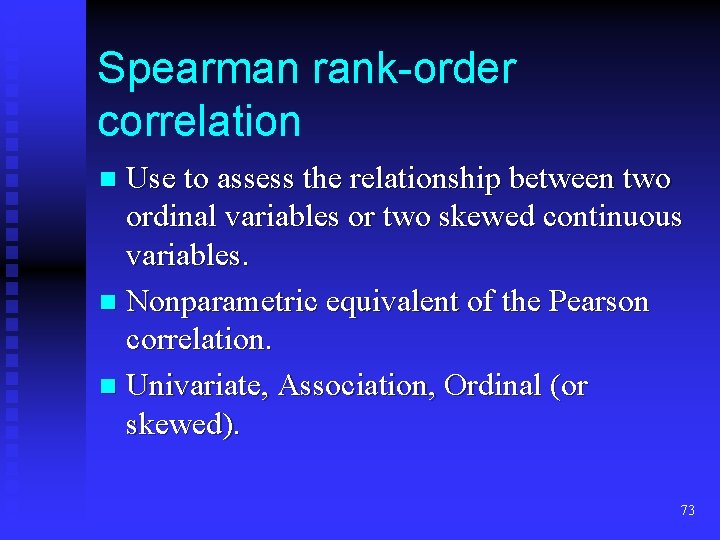
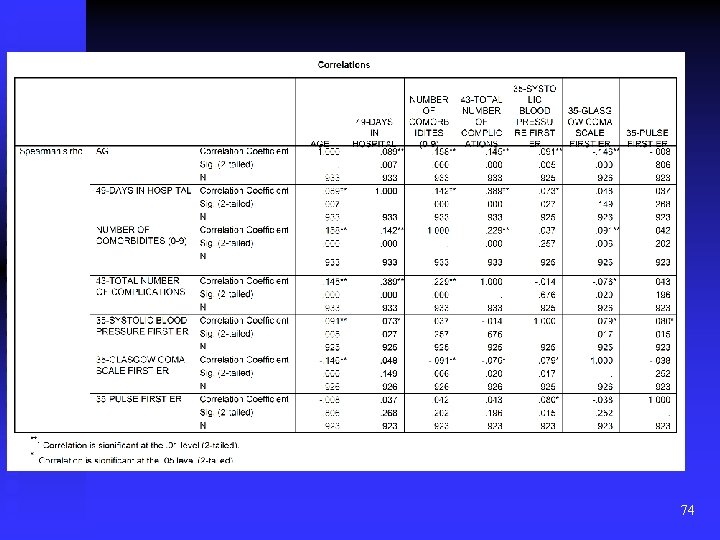
Spearman rank-order correlation Use to assess the relationship between two ordinal variables or two skewed continuous variables. n Nonparametric equivalent of the Pearson correlation. n Univariate, Association, Ordinal (or skewed). n 73
74
Summary of Inferential Tests 75
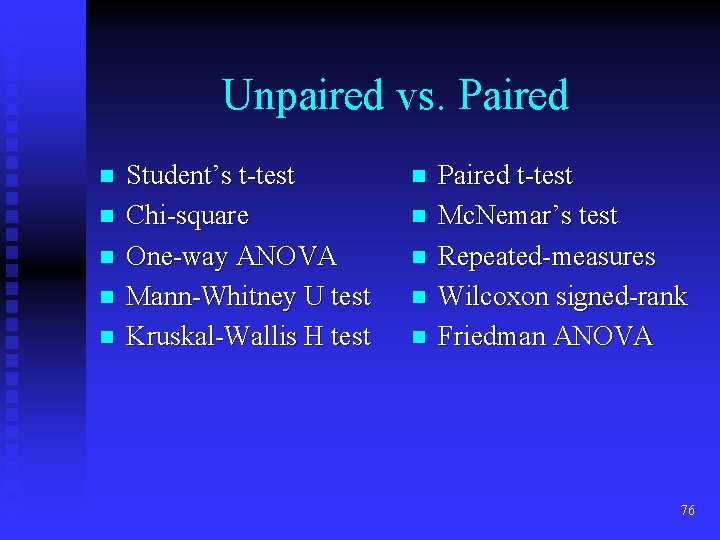
Unpaired vs. Paired n n n Student’s t-test Chi-square One-way ANOVA Mann-Whitney U test Kruskal-Wallis H test n n n Paired t-test Mc. Nemar’s test Repeated-measures Wilcoxon signed-rank Friedman ANOVA 76
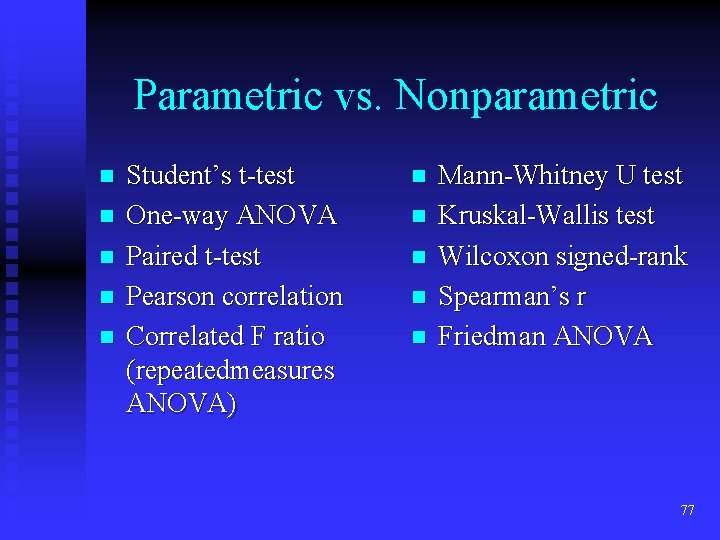
Parametric vs. Nonparametric n n n Student’s t-test One-way ANOVA Paired t-test Pearson correlation Correlated F ratio (repeatedmeasures ANOVA) n n n Mann-Whitney U test Kruskal-Wallis test Wilcoxon signed-rank Spearman’s r Friedman ANOVA 77
A Good Rule to Follow Always check your results with a nonparametric. n If you test your null hypothesis with a Student’s t-test, also check it with a Mann. Whitney U test. n It will only take an extra 25 seconds. n 78
VIII. You Will Need to Understand Regression Techniques 79
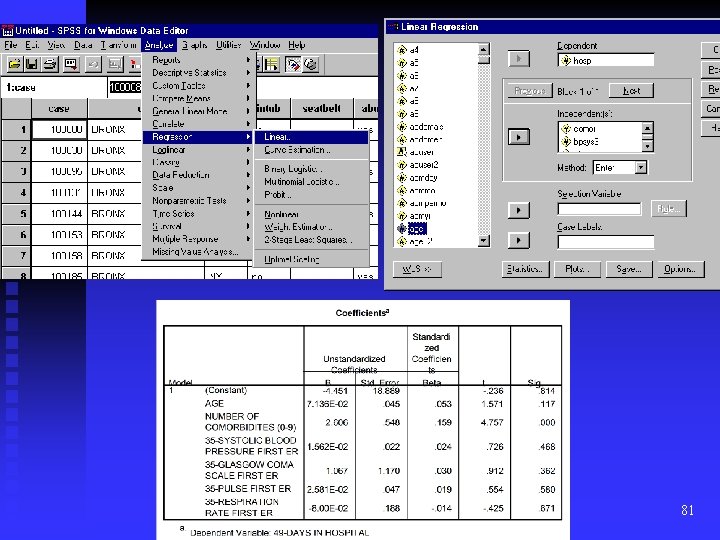
Linear Regression Used to assess how one or more predictor variables can be used to predict a continuous outcome variable. n “Do age, number of comorbidities, or admission vital signs predict the length of stay in the hospital after a hip fracture? ” n Multivariate, Association, Interval/Ordinal dependent variable. n 80
81
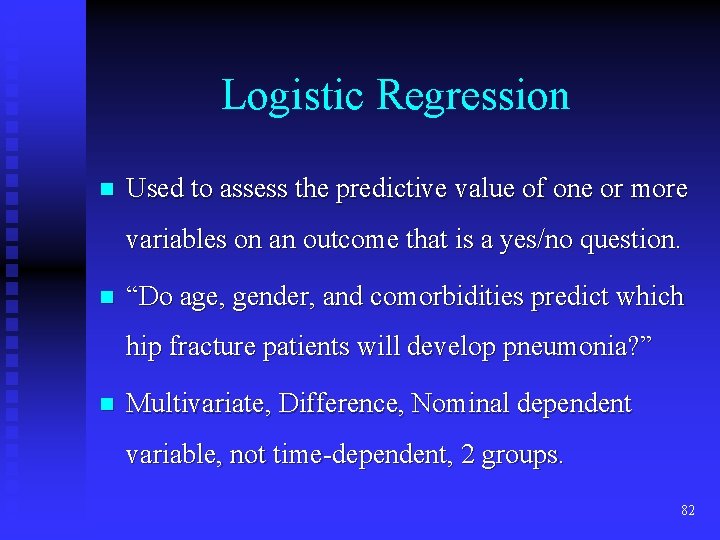
Logistic Regression n Used to assess the predictive value of one or more variables on an outcome that is a yes/no question. n “Do age, gender, and comorbidities predict which hip fracture patients will develop pneumonia? ” n Multivariate, Difference, Nominal dependent variable, not time-dependent, 2 groups. 82
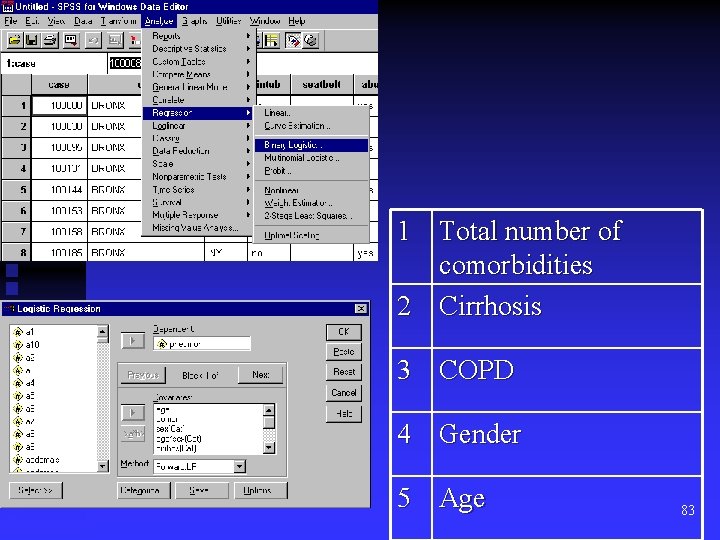
1 Total number of comorbidities 2 Cirrhosis 3 COPD 4 Gender 5 Age 83
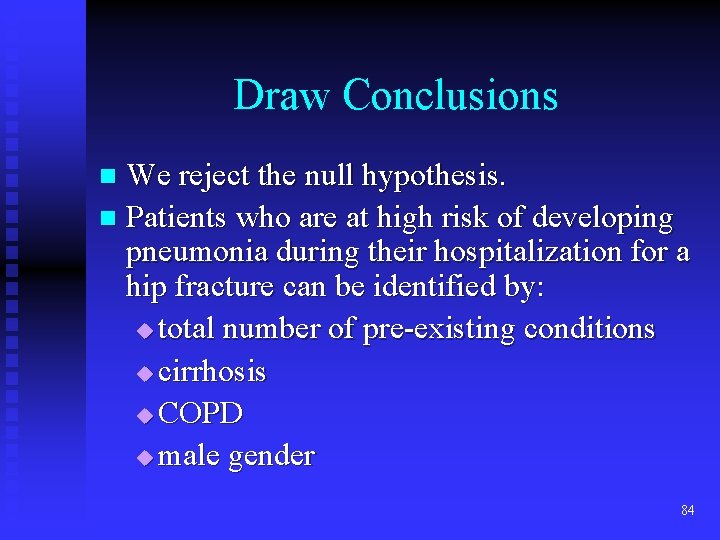
Draw Conclusions We reject the null hypothesis. n Patients who are at high risk of developing pneumonia during their hospitalization for a hip fracture can be identified by: u total number of pre-existing conditions u cirrhosis u COPD u male gender n 84
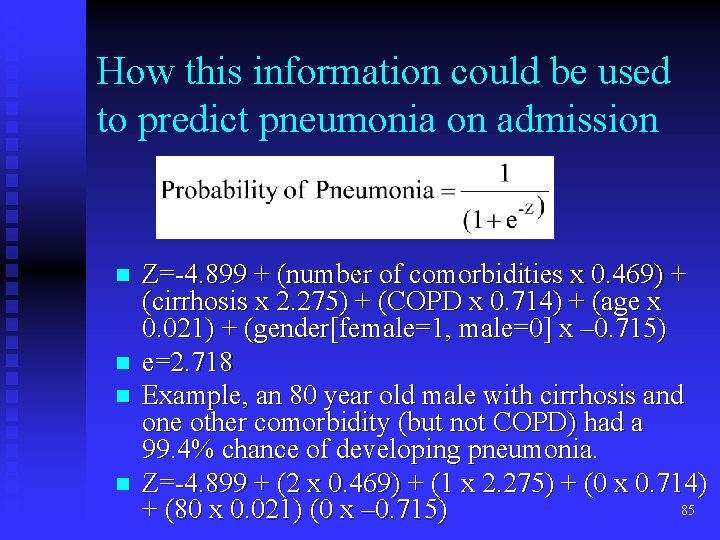
How this information could be used to predict pneumonia on admission n n Z=-4. 899 + (number of comorbidities x 0. 469) + (cirrhosis x 2. 275) + (COPD x 0. 714) + (age x 0. 021) + (gender[female=1, male=0] x – 0. 715) e=2. 718 Example, an 80 year old male with cirrhosis and one other comorbidity (but not COPD) had a 99. 4% chance of developing pneumonia. Z=-4. 899 + (2 x 0. 469) + (1 x 2. 275) + (0 x 0. 714) 85 + (80 x 0. 021) (0 x – 0. 715)
Survival Analysis Kaplan-Meier method u Used to plot cumulative survival n Log-rank test u Used to compare survival curves n Cox proportional-hazards u Used to adjust for covariates in survival analysis n 86
Odds and Ends You Will Need 87
95% Confidence Intervals n n n A 95% confidence interval is an estimate that you make from your sample as to where the true population value lies. If your study were to be repeated 100 times, you would expect the 95% CIs to cross the true value for the population in 95 of these 100 studies. u the value might be a mean, percentage or RR Confidence intervals should be included in publications for the major findings of the study. 88
Prevalence vs. Incidence Prevalence u How many of you now have the flu? n Incidence u How many of you have had the flu in the past year? n 89
Random is not the same as haphazard, unplanned, incidental. n Allocating patients to the treatment group on even days and to the control group on odd days is systematic – not random. n Random refers to the idea that each element in a set has an equal probability of occurrence. n 90
Improving a RCT See the handout, Table 3 -2 pages 18 -19. n “Checklist to Be Used by Authors When Preparing or by Readers When Analyzing a Report of a Randomized Controlled Trial”. n 91
IX. You Will Need to Continue Learning About Statistics 92
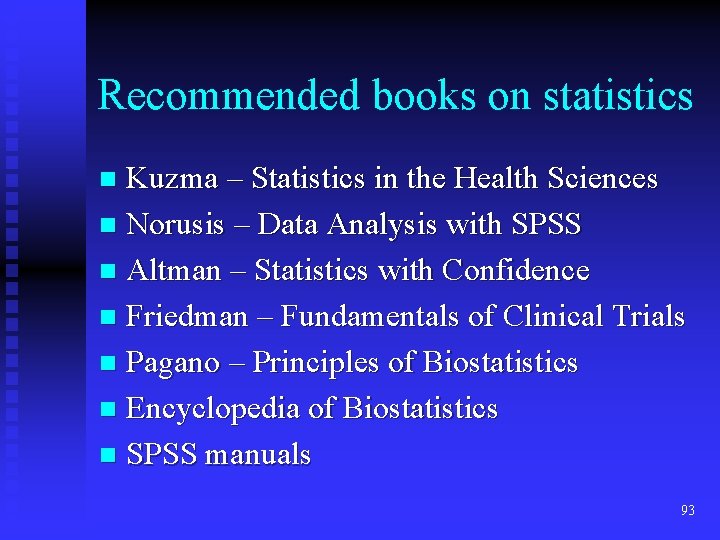
Recommended books on statistics Kuzma – Statistics in the Health Sciences n Norusis – Data Analysis with SPSS n Altman – Statistics with Confidence n Friedman – Fundamentals of Clinical Trials n Pagano – Principles of Biostatistics n Encyclopedia of Biostatistics n SPSS manuals n 93
Future Workshops 94
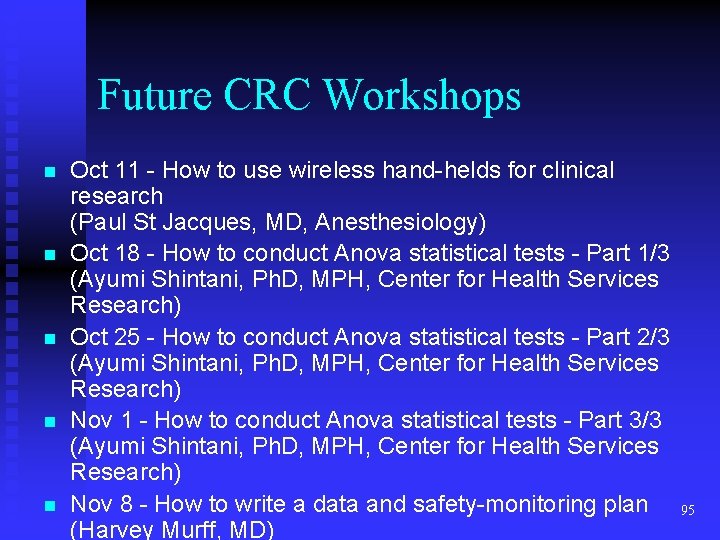
Future CRC Workshops n n n Oct 11 - How to use wireless hand-helds for clinical research (Paul St Jacques, MD, Anesthesiology) Oct 18 - How to conduct Anova statistical tests - Part 1/3 (Ayumi Shintani, Ph. D, MPH, Center for Health Services Research) Oct 25 - How to conduct Anova statistical tests - Part 2/3 (Ayumi Shintani, Ph. D, MPH, Center for Health Services Research) Nov 1 - How to conduct Anova statistical tests - Part 3/3 (Ayumi Shintani, Ph. D, MPH, Center for Health Services Research) Nov 8 - How to write a data and safety-monitoring plan (Harvey Murff, MD) 95
X. One Final Skill You Will Need to Master 96
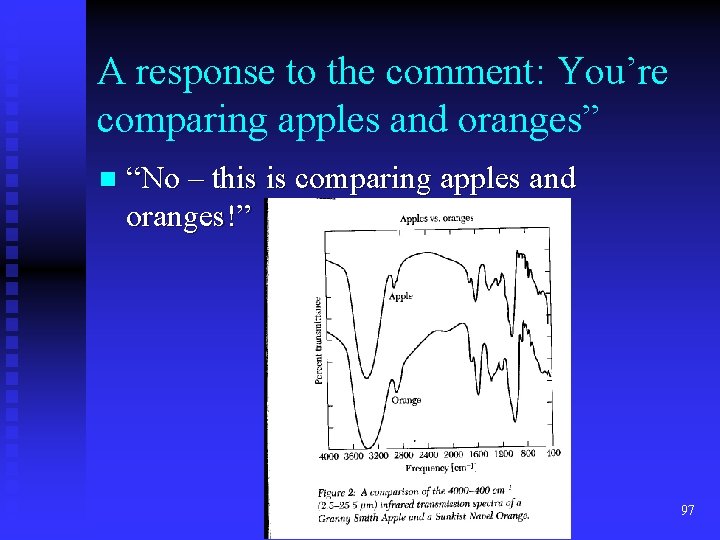
A response to the comment: You’re comparing apples and oranges” n “No – this is comparing apples and oranges!” 97