Homework 8 due today Homework 9 last one
 assigned: due Monday 4 December Start")


: atomic bonding- example of London dispersion in")


")
 • Phase diagrams (solid-liquid-gas (not")
 concepts & measures in “Physics-speak “ 1 kg = m s 2")

 impressed")

: barometers Evacuated space External atmospheric pressure, P")
 Lesson from 17 th century")

 vs. T curves are generated Vacuum state to start: T")

 (a, b) b latitude")

 P(atm) Solid (s) only s+l melting (mp)")


")


- Slides: 33
Homework 8 due today Homework 9 (last one) assigned: due Monday 4 December Start reading Chapter 7: Liquids and Solids- pp 235 -260
• Solids are rigid and don’t fill up space they’re put in • Liquids are fluid and fill up any space they’re put in • Solids are ~incompressible • Liquids are ~ incompressible
Evidence of the incompressibility of solids Evidence of the incompressibility of liquids
Evidence of the unusual strength of `H-O, H-F and H-N intermolecular `H-bonding’ force (see also Figure 7. 9, p. 245 of your text)
Dipole-Dipole forces Melting point of HCl = -114 o. C=-174 o. F Boiling point of HCl = -85 o. C =-122 o. F
Induced dipole = Dispersion forces= `London’ forces N 2 -initially equal sharing of electrons
N 2 melts at -231 o. C=-346 o. F boils at -196 o. C=-321 o. F example of London-only dispersion bonds
Model for atomic metal bonding: `Sea of electrons’ These don’t move Electrons move and `flow’ about freely in around cations
Atomic solid
Solid Argon (mp= -189 C= -309 F): atomic bonding- example of London dispersion in atoms
Trends in intermolecular forces • Ionic and network covalent interactions are the strongest examples: Na. Cl (ionic) melts at 820 o. C, Si. O 2 (network covalent) melts at 1800 o. C • H-bonding is the next most powerful interaction (see Figure 7. 9 -despite being smallest water melts the highest) • Dipole-dipole interactions are less potent than H-bonding (see Figure 7. 9 again…) • Dispersion is the weakest and is present in every molecule or atom.
More trends in intermolecular forces • Bigger molecules always have more intermolecular interaction than smaller ones, if the same collection of intermolecular interactions exist for them. Example: compound F 2 MW 38 Order boiling points ? Cl 2 86 -188 -34 Br 2 160 +59 g/mol o. C
In-class practice ordering melting and boiling points (text book problems)
Describing phase changes • P vs. T diagrams (liquid-vapor) • Phase diagrams (solid-liquid-gas (not in text)
Pressure (P) concepts & measures in “Physics-speak “ 1 kg = m s 2 1 Pascal (Pa)= force area
Some lowbrow chem insights into Pressure üGetting hammered üBed of nails
What the bed of nails demonstration illustrates…. Pressure expresses how much a (constant) impressed force is spread out… • MORE AREA, LOWER PRESSURE • LESS AREA, HIGHER PRESSURE
Atmospheric Pressure in `lowbrow’ Chem speak: barometers outer space tall column of air in Earth’s atmosphere creates pressure we all feel Pressure =1 atm at sea level ~20 mile Earth Edge of Earth’s atmosphere
Measuring Pressure in `lowbrow’ Chem speak (continued): barometers Evacuated space External atmospheric pressure, P P in mm Hg=760 Hg A Torricelli barometer
Atmosphere demonstrated the Italian Way (BIG time Torricelli Barometers) Lesson from 17 th century picture Vat of mercury (Hg) Height of Hg columns is independent of crosssectional areas of tubes
Variation of Various Liquid Vapor Pressures with Temperature (see also Fig. 7. 16 p. 251) Normal boiling point is the temperature where the liquid vapor pressure = 1 atm
How vapor pressure (P) vs. T curves are generated Vacuum state to start: T constant Rate of H 2 O escape from liquid higher than return to liquid Rate of H O leaving liquid and 2 returning to liquid becomes equal
Phase diagrams: mapping the phase behavior of materials as a function of T and P
Map reading & Phase diagrams longitude (42° 16'N, 77° 48‘W) (a, b) b latitude a = Alfred, NY
Part of the Phase `map’ of water
Phase diagram map reading (on board too…) P(atm) Solid (s) only s+l melting (mp) Supercritical region Liquid (l) only l+g boiling (bp) Critical pt (cp) normal line* 1 s+l+g triple point (tp) Gas (g) only *Temperature of LIQ/GAS transition at 1 atm is called the normal boiling point s + g sublimation (sp) T (o C)
More complete phase map of water Cat’s Cradle By Kurt Vonnegut …where Ice 9 freezes everything….
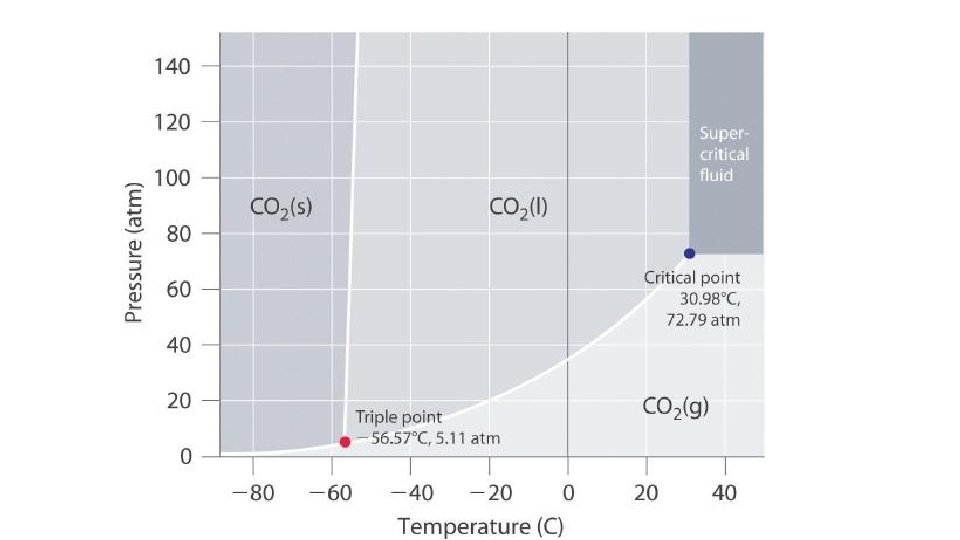
Supercritical behavior: CO 2 example 1 2 3 5 4 73 atm Supercritical region https: //www. youtube. com/watch? v=L 6 Ix. VPxkf. QE ~31 o. C 1 all solid 2 Solid/liquid 3 All liquid 4 Liquid/gas 5 Supercritical Phase line gone
More Video of super critical phenomena
ice melting- the Movie-frame by frame : heating/cooling curves (on board too, with numbers) Heating up a block of ice at P=1 atm T( Water heats o. C) Ice Heats STARTH ERE 0 S Water boils Steam heats Ice melts S+L -10 Heat Energy in L L+G G
how phase diagrams are built from ZILLIONS of heating curves Heating curve T Phase diagram Put a big dot here to indicated L-G phase change P P=1 atm Heat gas until After melting…watch liquid anything else warm until L-G transition S all along the line happens (30 o. C) Put a big dot here to +30 start Heat up and wait for S-L transition (at 10 o. C) start S L G P=1 +10 -20 indicate S-L phase change S Keep heating and melt… Heat in (J) Keep heating and vaporize -20 +10 +30 T Liquid all Gas all along line after dot
P T G L S Adding more data at different Pressures, P L/ G solid P 1 S/L liquid P 1 P 2 S/G* P 3 gas P 2 Heat in P 3 * =sublimation T Heating Curve Phase Diagram