MS Win Non Lin Assignment Due Today Simulated


 Example CV=0. 5")
 C(0)A C(0)B a = k. T b=k")


 KP,")
 Organ k. T (/hr) KP, b Kidneys 0.")
 Organ CA(mg/L) Kidneys 1 Brain 2 Fat 3")
")

- Slides: 28
MS Win. Non. Lin Assignment • Due Today: Simulated Plot in MS Word (. docx) format. • Due 9/9/15: Simulated Table in MS Word (. docx) format. – You won’t have to do calculations, but understand what the terms mean.
Values B C Probability A Probability Example #1: Which has negative, positive and no skew? Values
Example #2: Which has a higher standard deviation? Values B Probability A Values
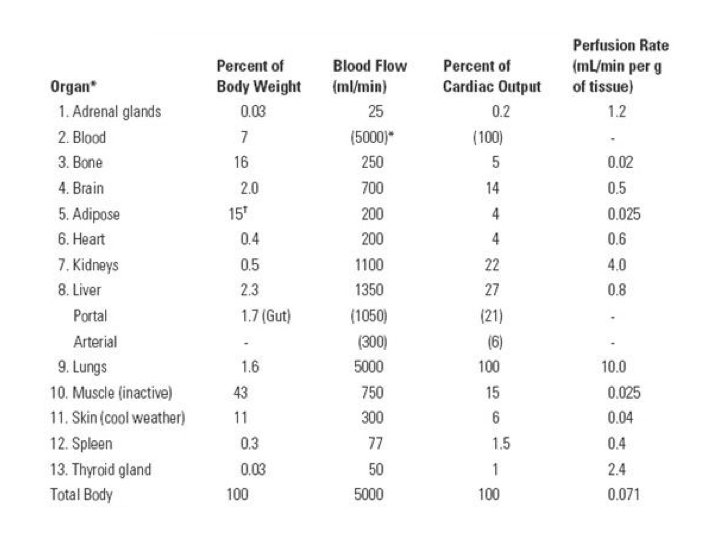
Lecture #7 DISTRIBUTION IN TISSUES
Drug Amount, ug Distribution Rate vary with Tissues
Why does the distribution rate vary? Perfusion and Permeability Perfusion transcellular transport paracellular transport transcytosis Vascular Endothelium Caveolae
Why does the distribution rate vary? Perfusion and Permeability Lymphatic System Permeability Perfusion
Permeability-Limited Permeability Perfusion
Perfusion-Limited Permeability Perfusion
Perfusion-Limited Permeability Rate Hydrophobic Molecule In-between Permeability-Limited Hydrophilic Molecule or Ionic Perfusion Rate
Log P 2. 9 Perfusion-Limited Log P 1. 5 Log P 0. 6 Permeability-Limited Log P 2. 26 (Ionic) Salicylic Acid
CV Vein Side CA Artery Side
Vein End Cv Artery End CA Q Blood Flow
Rate of Presentation Cv CA Q Blood Flow Example: • Q =70 L/hr • CA= 1 mg/L • Rate of Presentation = 70 mg/hr
Rate of Leaving Cv CA Q Blood Flow Example: • Q =70 L/hr • CV= 0. 5 mg/L • Rate of Leaving = 35 mg/hr
Rate of Extravasation 1 mg/L 0. 5 mg/L Cv DC = CA-CV CA Q Blood Flow Example: • Q =70 L/hr • CA= 1 mg/L • CV = 0. 5 mg/L • Rate of Extravasation = 35 mg/hr
Blood Vessel Cross-section
Blood Vessel Cross-section CT, V T Example CT=1 mg/L VT=65 L Amount = 65 mg
Blood Vessel Cross-section CT CV tissue-to-blood equilibrium distribution ratio (KP, b) Example CV=0. 5 mg/L CT=1. 0 mg/L KP, b= 2
Distribution Rate Constant (k. T) C(0)A C(0)B a = k. T b=k
Distribution Half Life
Tissue Concentration
Effect of Distribution Rate on Tissue Concentration fast medium Organ k. T (/hr) KP, b Kidneys 245 1 Brain 3 1 Fat 1. 8 1 slow CA = 1 mg/ml
tissue-to-blood equilibrium distribution ratio (KP, b) Organ k. T (/hr) KP, b Kidneys 0. 5 1 Brain 0. 5 2 Fat 0. 5 5 CA = 1 mg/ml
tissue-to-blood equilibrium distribution ratio (KP, b) Organ CA(mg/L) Kidneys 1 Brain 2 Fat 3 k. T = 0. 5 /hr; KP, b=1
Summary KP, b * CA k. T (How fast)
Which one has the higher KP, b? A CA = arterial blood drug concentration = 1 mg/L B