HLLHCUK Thermal Shield Update Niklas Templeton 060416 Cool


- Slides: 13

HL-LHC-UK Thermal Shield Update Niklas Templeton 06/04/16

Cool Down Stress Analysis Initial conditions as recommended by Krzysztof Brodzinski: delta. T of 200 K between the inlet and outlet of the pipe. The temperature profile on the panels along the line will follow. Analysis Steady state thermal + Static structural Boundary Conditions Pipe Temperature: 50 – 250 K Vacuum vessel interface: Fixed & 293 K Includes static and radiation but no dynamic heat loads (i. e. HOMs/FPC off) Engineering Data: Non-linear material properties used (see previous presentations) Connections & Contact Conductance as previous Temperature profile applied to pipe

Cu Concept Initial Cool Down Stress Results Cu ETP Stress Results Comment Analysis represents the worst case thermal stress conditions on the shield • Max Pipe Stress 51 Mpa >> Yield Stress for Cu ETP • Max Stress in Panels is a sheet metal bend feature anomaly • Some high stress at the flexure interface which may be slightly over constrained – can be corrected with flexure optimisation • Majority of Panel >> Yield Stress for Cu OFE Temperature results omitted as panel T-profile is not of concern during cool down. Cu OFE Stress

Al / SS Concept Initial Cool Down Stress Results SS 316 Stress Results Comment Analysis represents the worst case thermal stress conditions on the shield • Model is slightly over constrained for conservative results • Max Pipe Stress occurs in integrated flange corner creating a stress concentration – chamfer required • Majority of Panel >> Yield Stress for SS 316 • Some high stress at the flexure interface - can be corrected with flexure optimisation • Majority of Panel >> Yield Stress for Al 1100 Temperature results omitted as panel T-profile is not of concern during cool down. Al 1100 Stress

FPC Thermalisation Design

FPC Thermalisation Analysis Steady State Thermal Aim Determine optimal thermal strap geometry to achieve d. T specification Engineering Data Non-Linear thermal properties (as previous) Boundary Conditions (see image) *dynamic heat load applied to inner FPC can Assumptions Approximate FPC thermal profile Ideal contact conductance Model Strap width 50 mm, Length ~160 mm Strap thickness varied Ansys Model

FPC Thermalisation Results 2 mm Thick Strap d. T = 63. 6 K 5 mm Thick Strap d. T = 28. 4 K 6 mm Thick Strap d. T = 23. 9 K

FPC Thermalisation Results To improve results: • Decrease Strap Length • Increase Strap width/thickness • Reduce shield interface temperature (cooling power) • Improve strap conductivity K Conclusions • Thick straps required • Good contact between FPC-Collar-Strap. Shield essential 6 mm strap with 60 K Shield Interface d. T = 22. 6

Further Work • Optimisation of thermal analysis for comparison • Analysis of intercepts and thermalisation • Select Concept (order material? ) • Define Pipe ID/OD • Define Shield Geometry with Vacuum Vessel • Design & Analysis of flexure supports • Detailed Design & Drawings

Thank you Questions?

Additional Slides

Convection Coefficient Calculation Pipe Temperature replaced with Convection – Film Coefficient: 250 W/m 2. K & Ambient Temperature gradient Calculations U (m/s): 3. 72 Re: 26677 Pr: 0. 78 Heat Transfer Coefficient Dittus - Boelter Correlation for turbulent pipe flow (Accuracy ± 15%) h (W/m 2. K): Flow Properties P (Bar) 4 m (kg/s) 2. 20 E-03 T (K): 50 -70 Fluid Properties μ (Pa. s) 7. 50 E-06 k (W/m. K) 0. 05 cp (J/kg. K): 5200 ρ (kg/m 3): 3. 84 Pipe Properties D (m): 0. 014 258. 42 Pipe Thermal Gradient Elbow Pipe Length (mm) Heat Load (W) 1 262. 5 2 2 585. 5 13 3 1068. 5 15 4 1911. 5 62 5 2394. 5 28 6 3175. 5 62 T(K) h (W/m 2. K) 50. 2 250 51. 2 250 52. 5 250 57. 6 250 60. 0 250 65. 1 250 7 4072. 5 1 65. 2 250 8 9 10 11 12 4653. 5 5475. 5 6066 6819 7409. 5 2 1 25 65. 4 67. 5 67. 6 69. 7 250 250 250 13 7772. 5 1 69. 8 250 14 15 7972. 5 8959. 5 2 1 69. 9 70 250

Thermal Performance Summary Al Cooling Temp. Result Summary Panels Al/SS Pipe Panels Cu Pipe Al Cooling Convection Pipe Temperature Tmin (K) Tmax (K) 64 50 53 50 81 105 75 70 Pipe Convection Tmin (K) Tmax (K) 70 50 55 50 87 139 84 75 SS Cooling Convection Cu Cooling Temp. Cu Cooling Convection
 Is an alternative of log based recovery.
 Sandra templeton big fish
 Franklin templeton municipal bonds
 Krista templeton
 Franklin templeton renaissance charitable foundation
 Common stock
 Thermal energy section 3
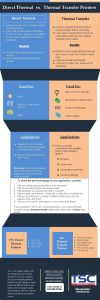
 Thermal transfer vs direct thermal printing
 Tdts21
 Maitohapoton nopeuskestävyys
 Sven bollinger
 Niklas serdberg
 Niklas von wyle
 Christina niklas


