Q 3 2018 WHAT FRANKLIN TEMPLETON THINKS An

- Slides: 39
Q 3 2018 WHAT FRANKLIN TEMPLETON THINKS…. An Update on Today’s Financial Markets The information provided is not a complete analysis of every material fact regarding any country, region, market, investment, or strategy. Because market and economic conditions are subject to change, comments, opinions and analyses are rendered as of July 31, 2018, and may change without notice. Opinions are intended to provide insight on macroeconomic issues and commentary is not intended as individual investment advice or a recommendation or solicitation to buy, sell or hold any security or to adopt any investment strategy. Not FDIC Insured | May Lose Value | No Bank Guarantee
…About Volatility Hostage to the headlines; uncertainty may persist 2
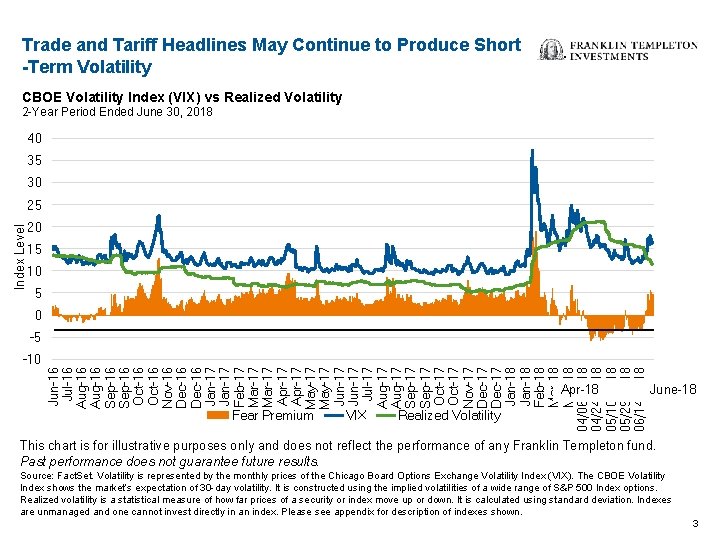
Trade and Tariff Headlines May Continue to Produce Short -Term Volatility CBOE Volatility Index (VIX) vs Realized Volatility 2 -Year Period Ended June 30, 2018 40 35 30 Index Level 25 20 15 10 5 0 -10 Jun-16 Jul-16 Aug-16 Sep-16 Oct-16 Nov-16 Dec-16 Jan-17 Feb-17 Mar-17 Apr-17 May-17 Jun-17 Jul-17 Aug-17 Sep-17 Oct-17 Nov-17 Dec-17 Jan-18 Feb-18 Mar-18 04/06/2018 04/24/2018 05/10/2018 05/29/2018 06/14/2018 -5 Apr-18 Fear Premium VIX June-18 Realized Volatility This chart is for illustrative purposes only and does not reflect the performance of any Franklin Templeton fund. Past performance does not guarantee future results. Source: Fact. Set. Volatility is represented by the monthly prices of the Chicago Board Options Exchange Volatility Index (VIX). The CBOE Volatility Index shows the market’s expectation of 30 -day volatility. It is constructed using the implied volatilities of a wide range of S&P 500 Index options. Realized volatility is a statistical measure of how far prices of a security or index move up or down. It is calculated using standard deviation. Indexes are unmanaged and one cannot invest directly in an index. Please see appendix for description of indexes shown. 3
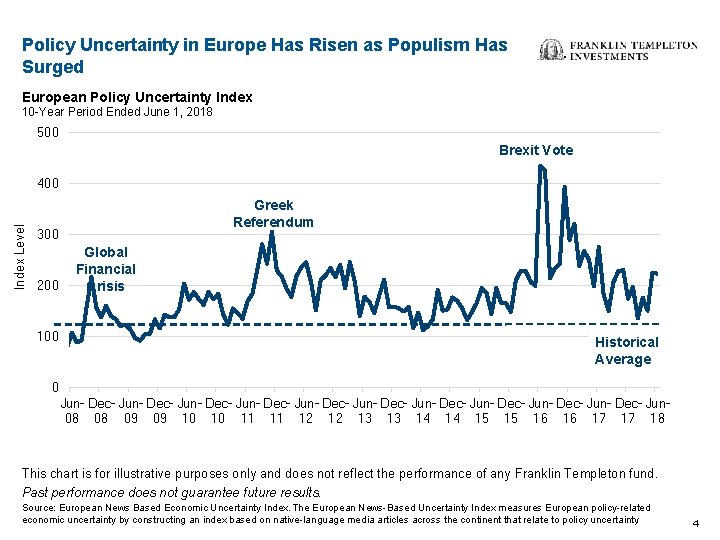
Policy Uncertainty in Europe Has Risen as Populism Has Surged European Policy Uncertainty Index 10 -Year Period Ended June 1, 2018 500 Brexit Vote Index Level 400 Greek Referendum 300 200 100 Global Financial Crisis Historical Average 0 Jun- Dec- Jun- Dec- Jun- Dec- Jun 08 08 09 09 10 10 11 11 12 12 13 13 14 14 15 15 16 16 17 17 18 This chart is for illustrative purposes only and does not reflect the performance of any Franklin Templeton fund. Past performance does not guarantee future results. Source: European News Based Economic Uncertainty Index. The European News-Based Uncertainty Index measures European policy-related economic uncertainty by constructing an index based on native-language media articles across the continent that relate to policy uncertainty. 4
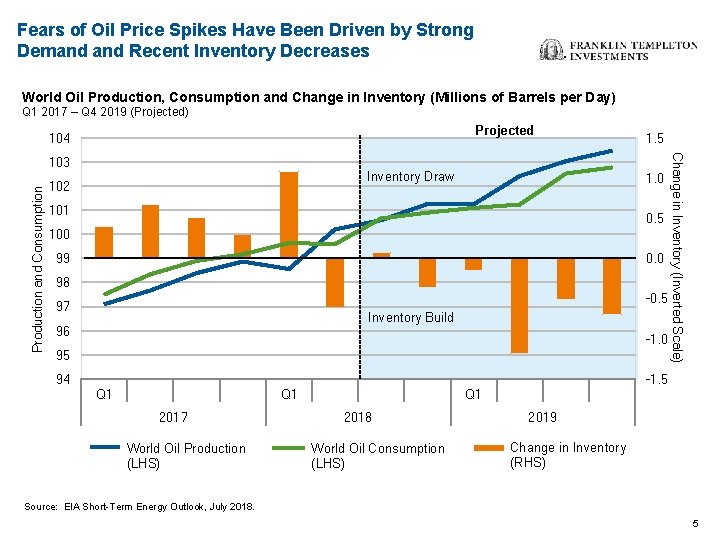
Fears of Oil Price Spikes Have Been Driven by Strong Demand Recent Inventory Decreases World Oil Production, Consumption and Change in Inventory (Millions of Barrels per Day) Q 1 2017 – Q 4 2019 (Projected) Projected 104 Production and Consumption Inventory Draw 102 1. 0 101 0. 5 100 99 0. 0 98 -0. 5 97 Inventory Build 96 -1. 0 95 94 Change in Inventory (Inverted Scale) 103 1. 5 -1. 5 Q 1 2017 World Oil Production (LHS) Q 1 2018 World Oil Consumption (LHS) 2019 Change in Inventory (RHS) Source: EIA Short-Term Energy Outlook, July 2018. 5
…About US Equities Positive growth remains despite headlines dampening investor sentiment 6
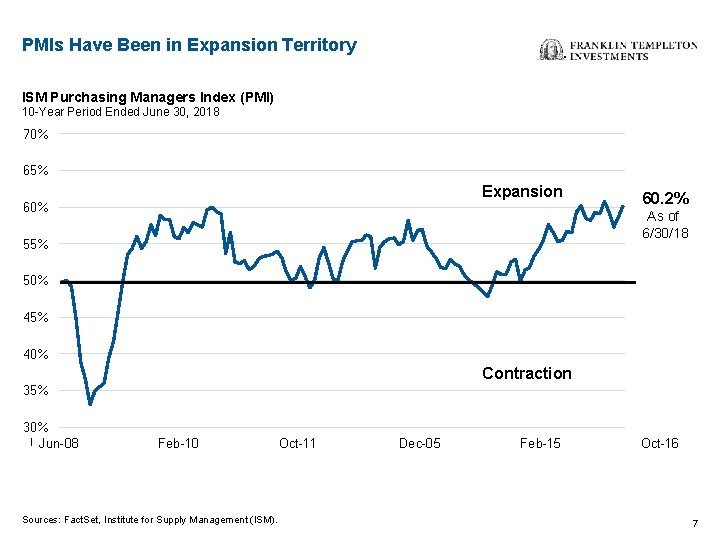
PMIs Have Been in Expansion Territory ISM Purchasing Managers Index (PMI) 10 -Year Period Ended June 30, 2018 70% 65% Expansion 60% 60. 2% As of 6/30/18 55% 50% 45% 40% Contraction 35% 30% 06/30/2008 Jun-08 02/26/2010 Feb-10 10/31/2011 Oct-11 06/28/2013 Sources: Fact. Set, Institute for Supply Management (ISM). 02/27/2015 Dec-05 10/31/2016 Feb-15 06/29/2018 Oct-16 7
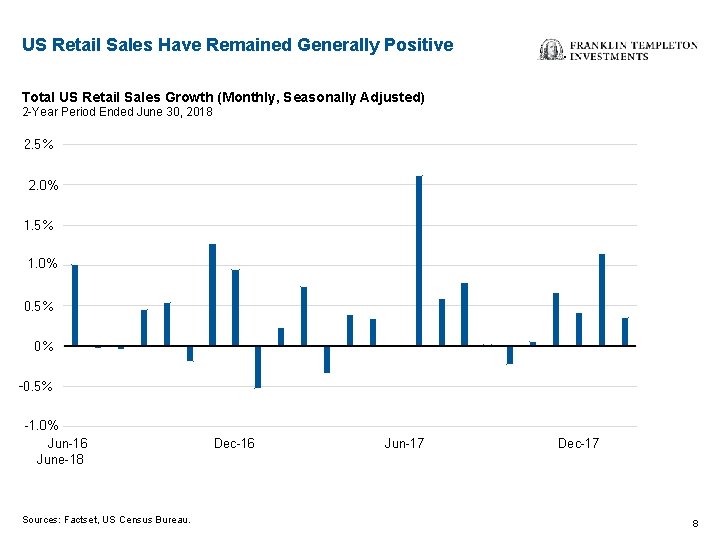
US Retail Sales Have Remained Generally Positive Total US Retail Sales Growth (Monthly, Seasonally Adjusted) 2 -Year Period Ended June 30, 2018 2. 5% 2% 2. 0% 1. 5% 1. 0% 1% 0. 5% 0% -0. 5% -1. 0% -1% 06/30/2016 Jun-16 June-18 12/30/2016 Dec-16 Sources: Factset, US Census Bureau. 06/30/2017 Jun-17 12/29/2017 06/29/2018 Dec-17 8
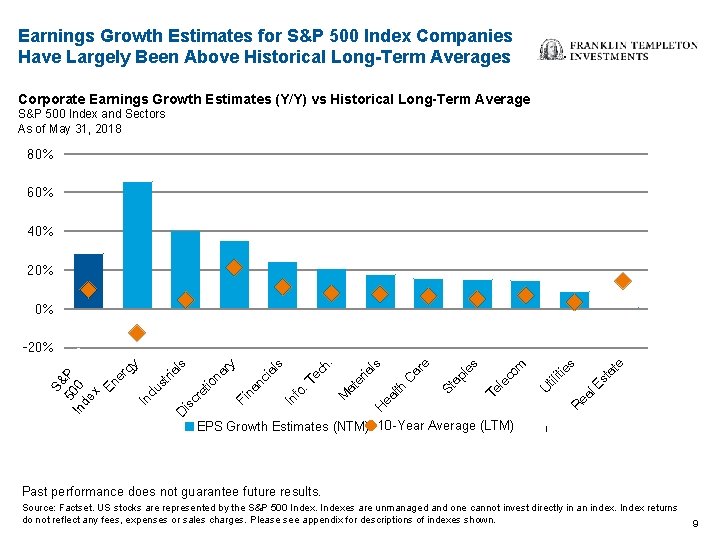
Earnings Growth Estimates for S&P 500 Index Companies Have Largely Been Above Historical Long-Term Averages Corporate Earnings Growth Estimates (Y/Y) vs Historical Long-Term Average S&P 500 Index and Sectors As of May 31, 2018 80% 60% 40% 20% 0% e ea l. E st at es R U til iti m co Te le es ap l St SS& & 50 PP 5 In 0 00 de x En er gy In du st ria ls D is cr et io na ry Fi na nc ia ls In fo. T ec h. M at er ia ls H ea lth C ar e -20% 10 -Year (LTM) EPS Growth Estimates NTM EPS growth (Y/Y) (NTM) LTM EPS Average 10 Y growth - median Past performance does not guarantee future results. Source: Factset. US stocks are represented by the S&P 500 Indexes are unmanaged and one cannot invest directly in an index. Index returns do not reflect any fees, expenses or sales charges. Please see appendix for descriptions of indexes shown. 9
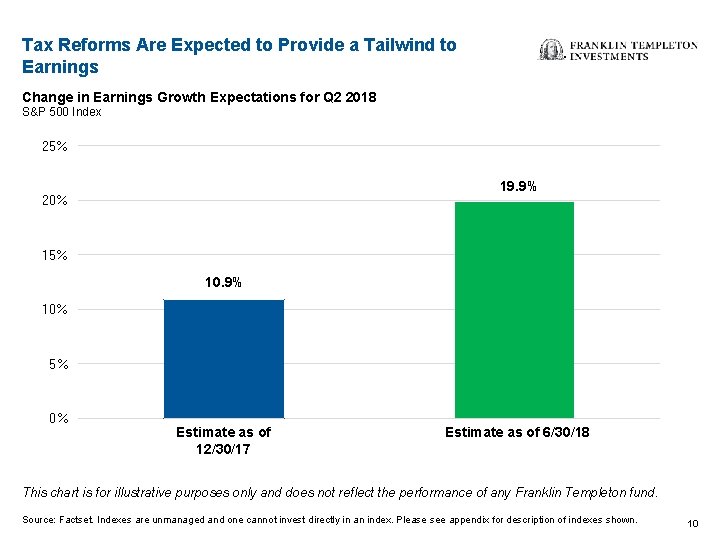
Tax Reforms Are Expected to Provide a Tailwind to Earnings Change in Earnings Growth Expectations for Q 2 2018 S&P 500 Index 25% 19. 9% 20% 15% 10. 9% 10% 5% 0% Estimate as of 12/30/17 Estimate as of 6/30/18 This chart is for illustrative purposes only and does not reflect the performance of any Franklin Templeton fund. Source: Factset. Indexes are unmanaged and one cannot invest directly in an index. Please see appendix for description of indexes shown. 10
…About Europe, Japan, and UK Equities Japan may surprise; political concerns fog the UK and European outlooks 11
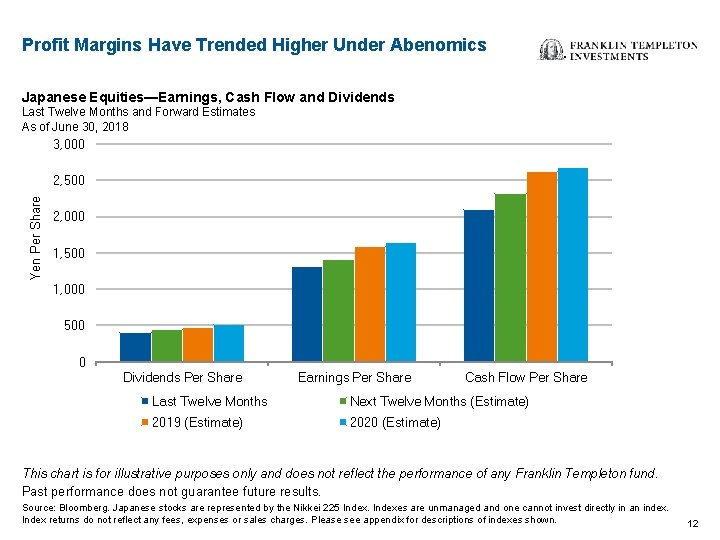
Profit Margins Have Trended Higher Under Abenomics Japanese Equities—Earnings, Cash Flow and Dividends Last Twelve Months and Forward Estimates As of June 30, 2018 3, 000 Yen Per Share 2, 500 2, 000 1, 500 1, 000 500 0 Dividends Per Share Earnings Per Share Cash Flow Per Share Last Twelve Months Next Twelve Months (Estimate) 2019 (Estimate) 2020 (Estimate) This chart is for illustrative purposes only and does not reflect the performance of any Franklin Templeton fund. Past performance does not guarantee future results. Source: Bloomberg. Japanese stocks are represented by the Nikkei 225 Indexes are unmanaged and one cannot invest directly in an index. Index returns do not reflect any fees, expenses or sales charges. Please see appendix for descriptions of indexes shown. 12
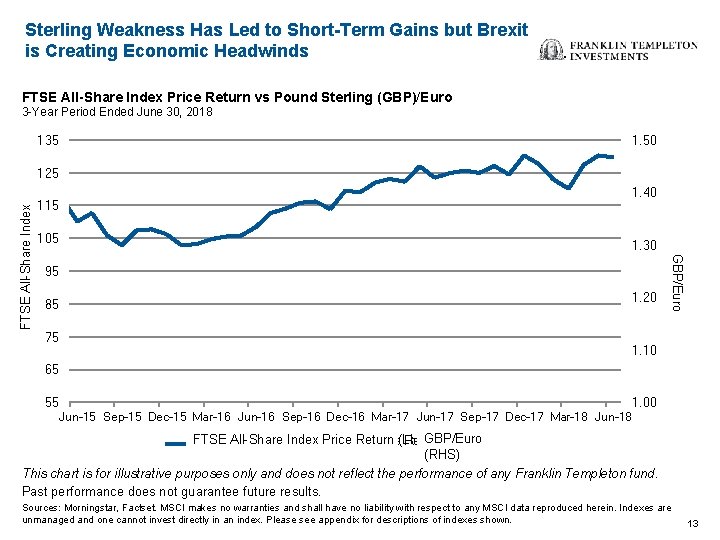
Sterling Weakness Has Led to Short-Term Gains but Brexit is Creating Economic Headwinds FTSE All-Share Index Price Return vs Pound Sterling (GBP)/Euro 3 -Year Period Ended June 30, 2018 135 1. 50 1. 40 115 105 1. 30 95 85 75 1. 20 GBP/Euro FTSE All-Share Index 125 1. 10 65 55 1. 00 Jun-15 Sep-15 Dec-15 Mar-16 Jun-16 Sep-16 Dec-16 Mar-17 Jun-17 Sep-17 Dec-17 Mar-18 Jun-18 GBP/Euro FTSE All-Share. FTSE Index. All Price Return Share Price(LHS) Return (RHS) This chart is for illustrative purposes only and does not reflect the performance of any Franklin Templeton fund. Past performance does not guarantee future results. Sources: Morningstar, Factset. MSCI makes no warranties and shall have no liability with respect to any MSCI data reproduced herein. Indexes are unmanaged and one cannot invest directly in an index. Please see appendix for descriptions of indexes shown. 13
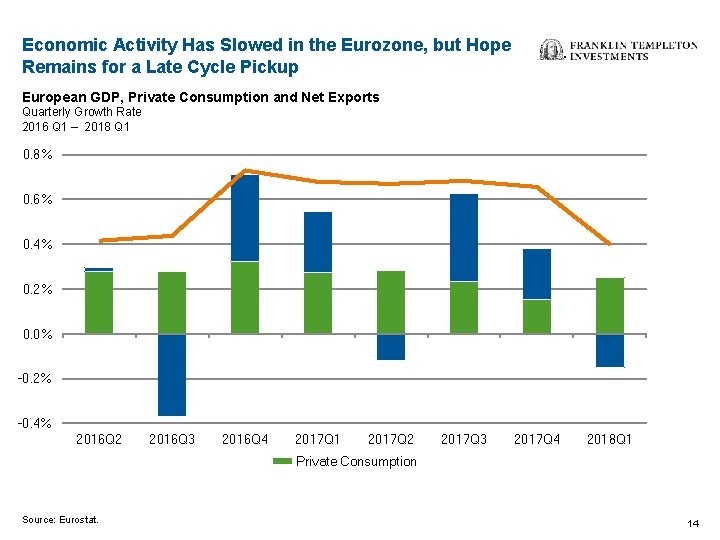
Economic Activity Has Slowed in the Eurozone, but Hope Remains for a Late Cycle Pickup European GDP, Private Consumption and Net Exports Quarterly Growth Rate 2016 Q 1 – 2018 Q 1 0. 8% 0. 6% 0. 4% 0. 2% 0. 0% -0. 2% -0. 4% 2016 Q 2 2016 Q 3 2016 Q 4 2017 Q 1 2017 Q 2 2017 Q 3 2017 Q 4 2018 Q 1 Private Consumption Source: Eurostat. 14
…About Emerging Markets Equities Volatility may continue in 2018 but seems unlikely to deter continued growth 15
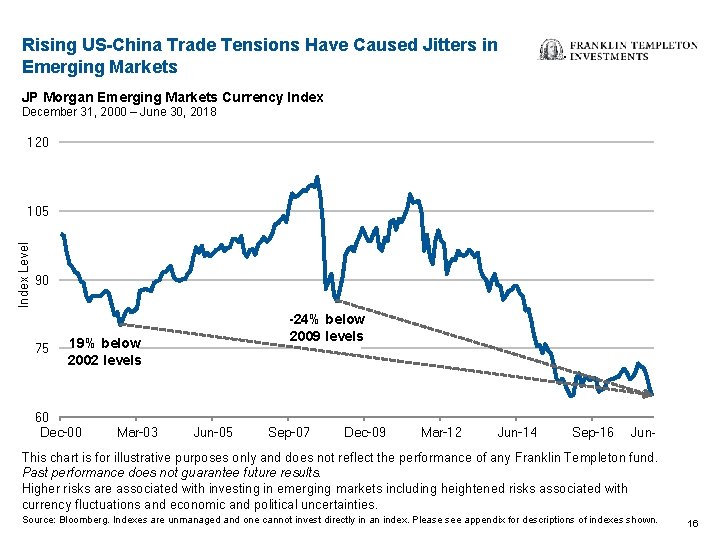
Rising US-China Trade Tensions Have Caused Jitters in Emerging Markets JP Morgan Emerging Markets Currency Index December 31, 2000 – June 30, 2018 120 Index Level 105 90 75 -24% below 2009 levels 19% below 2002 levels 60 Dec-00 Mar-03 Jun-05 Sep-07 Dec-09 Mar-12 Jun-14 Sep-16 Jun- This chart is for illustrative purposes only and does not reflect the performance of any Franklin Templeton fund. Past performance does not guarantee future results. Higher risks are associated with investing in emerging markets including heightened risks associated with currency fluctuations and economic and political uncertainties. Source: Bloomberg. Indexes are unmanaged and one cannot invest directly in an index. Please see appendix for descriptions of indexes shown. 16
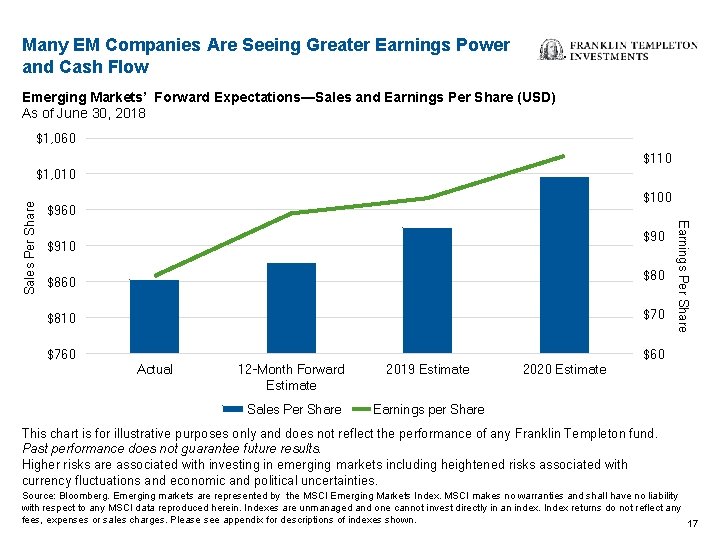
Many EM Companies Are Seeing Greater Earnings Power and Cash Flow Emerging Markets’ Forward Expectations—Sales and Earnings Per Share (USD) As of June 30, 2018 $1, 060 $110 $100 $960 $910 $860 $810 $760 $60 Actual 12 -Month Forward Estimate 2019 Estimate Sales Per Share Earnings per Share Earnings Per Share Sales Per Share $1, 010 2020 Estimate This chart is for illustrative purposes only and does not reflect the performance of any Franklin Templeton fund. Past performance does not guarantee future results. Higher risks are associated with investing in emerging markets including heightened risks associated with currency fluctuations and economic and political uncertainties. Source: Bloomberg. Emerging markets are represented by the MSCI Emerging Markets Index. MSCI makes no warranties and shall have no liability with respect to any MSCI data reproduced herein. Indexes are unmanaged and one cannot invest directly in an index. Index returns do not reflect any fees, expenses or sales charges. Please see appendix for descriptions of indexes shown. 17
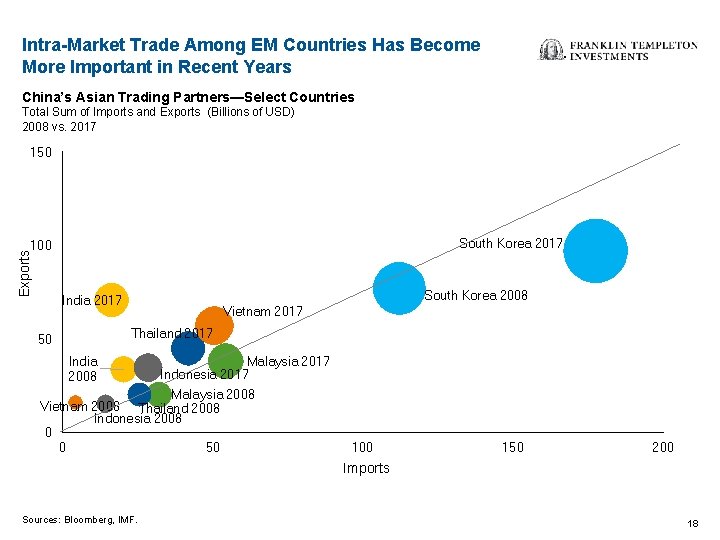
Intra-Market Trade Among EM Countries Has Become More Important in Recent Years China’s Asian Trading Partners—Select Countries Total Sum of Imports and Exports (Billions of USD) 2008 vs. 2017 150 South Korea 2017 Exports 100 South Korea 2008 India 2017 Vietnam 2017 Thailand 2017 50 India 2008 Malaysia 2017 Indonesia 2017 Malaysia 2008 Vietnam 2008 Thailand 2008 Indonesia 2008 0 0 50 100 150 200 Imports Sources: Bloomberg, IMF. 18
…About Interest Rates & Inflation Modestly rising inflation should not be problematic in the US and generally remains below central bank targets globally 19
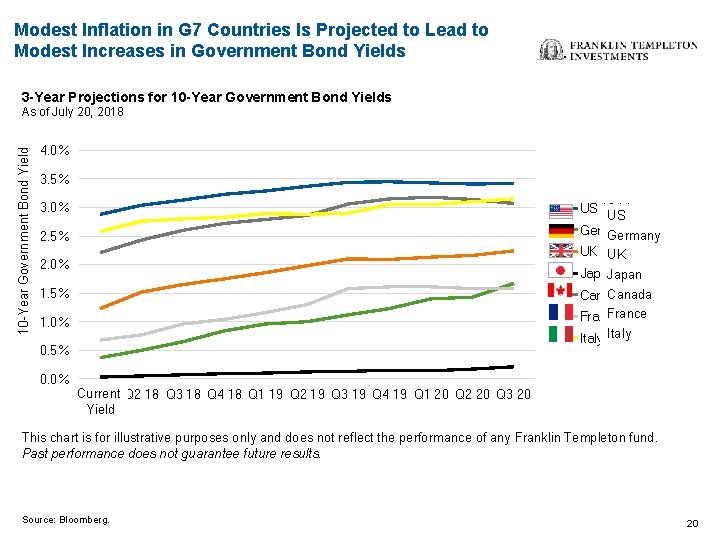
Modest Inflation in G 7 Countries Is Projected to Lead to Modest Increases in Government Bond Yields 3 -Year Projections for 10 -Year Government Bond Yields 10 -Year Government Bond Yield As of July 20, 2018 4. 0% 3. 5% 3. 0% US 10 -Year US Germany 10 -Year Germany 2. 5% UK 10 -Year UK 2. 0% Japan 10 -Year Japan 1. 5% Canada 10 -Year France 10 -Year 1. 0% Italy 10 -Year 0. 5% 0. 0% Current Market Q 1 18 Q 2 18 Q 3 18 Q 4 18 Q 1 19 Q 2 19 Q 3 19 Q 4 19 Q 1 20 Q 2 20 Q 3 20 Yield This chart is for illustrative purposes only and does not reflect the performance of any Franklin Templeton fund. Past performance does not guarantee future results. Source: Bloomberg. 20
Markets Took the June Fed Rate Hike in Stride Dow Jones Industrial Average (DJIA) Index Amid Recent Fed Rate Hikes Index March 1, 2018–June 30, 2018 This chart is for illustrative purposes only and does not reflect the performance of any Franklin Templeton fund. Past performance does not guarantee future results. Source: Bloomberg. Indexes are unmanaged and one cannot invest directly in an index. Index returns do not reflect any fees, expenses or sales charges. Please see appendix for descriptions of indexes shown. 21
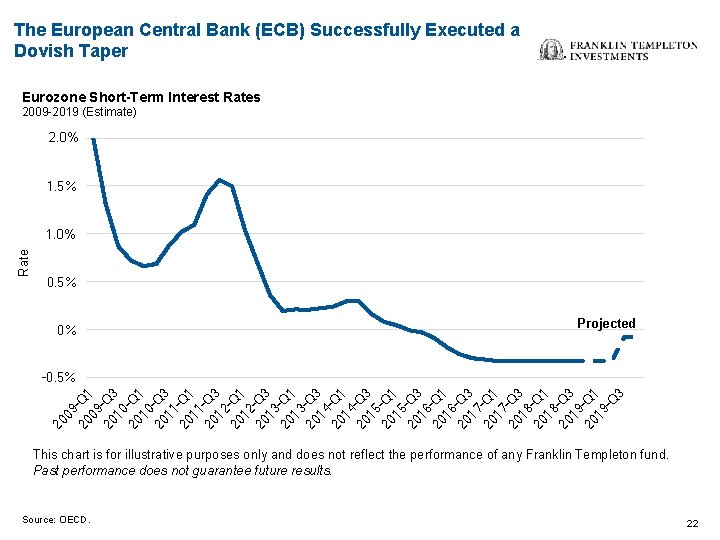
The European Central Bank (ECB) Successfully Executed a Dovish Taper Eurozone Short-Term Interest Rates 2009 -2019 (Estimate) 2. 0% 2% 1. 5% Rate 1% 1. 0% 0. 5% 0% Projected 20 09 20 -Q 1 09 20 -Q 3 10 20 -Q 1 10 20 -Q 3 11 20 -Q 1 11 20 -Q 3 12 20 -Q 1 12 20 -Q 3 13 20 -Q 1 13 20 -Q 3 14 20 -Q 1 14 20 -Q 3 15 20 -Q 1 15 20 -Q 3 16 20 -Q 1 16 20 -Q 3 17 20 -Q 1 17 20 -Q 3 18 20 -Q 1 18 20 -Q 3 19 20 -Q 1 19 -Q 3 -0. 5% This chart is for illustrative purposes only and does not reflect the performance of any Franklin Templeton fund. Past performance does not guarantee future results. Source: OECD. 22
…About Fixed Income Opportunities still may be better in risk categories and munis 23
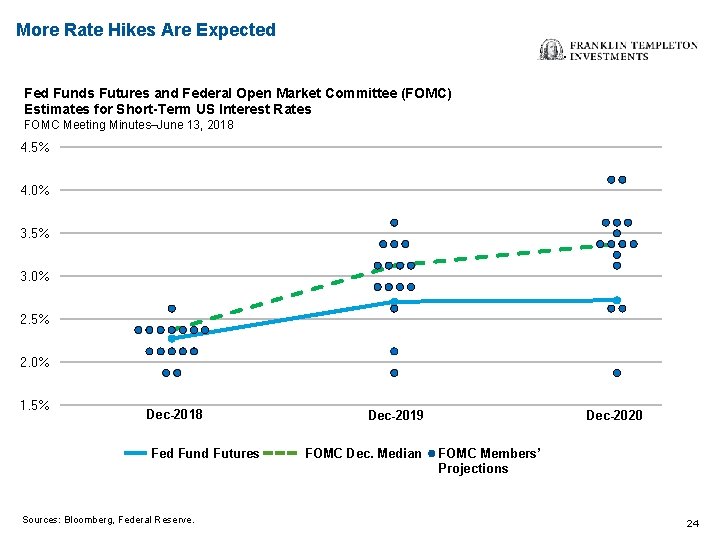
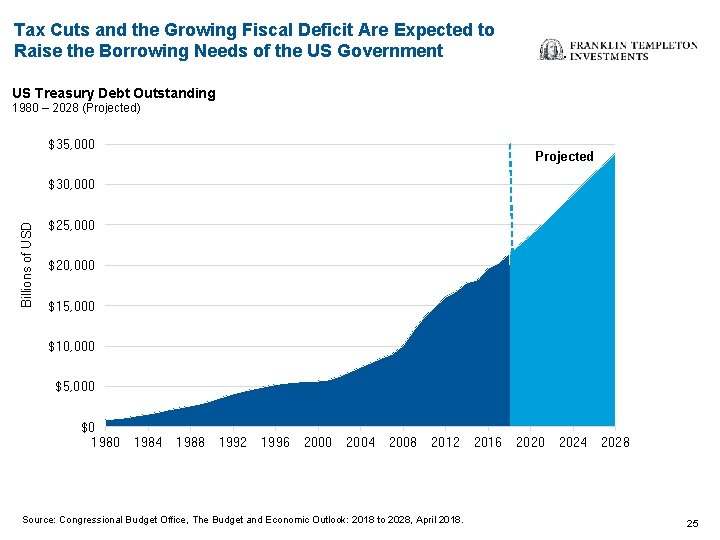
More Rate Hikes Are Expected Funds Futures and Federal Open Market Committee (FOMC) Estimates for Short-Term US Interest Rates FOMC Meeting Minutes–June 13, 2018 4. 5% 4. 0% 3. 5% 3. 0% 2. 5% 2. 0% 1. 5% Dec-2018 Fed Fund Futures Sources: Bloomberg, Federal Reserve. Dec-2019 FOMC Dec. Median Dec-2020 FOMC Members’ Projections 24
Tax Cuts and the Growing Fiscal Deficit Are Expected to Raise the Borrowing Needs of the US Government US Treasury Debt Outstanding 1980 – 2028 (Projected) $35, 000 Projected Billions of USD $30, 000 $25, 000 $20, 000 $15, 000 $10, 000 $5, 000 $0 1984 1988 1992 1996 2000 2004 2008 2012 Source: Congressional Budget Office, The Budget and Economic Outlook: 2018 to 2028, April 2018. 2016 2020 2024 2028 25
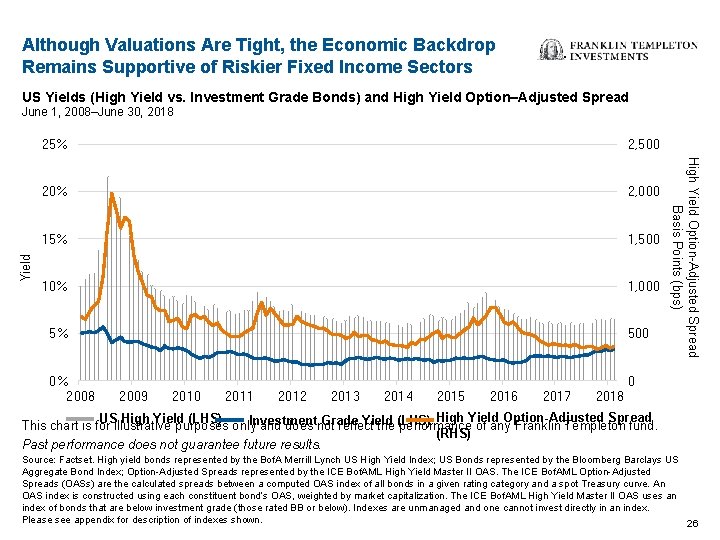
Although Valuations Are Tight, the Economic Backdrop Remains Supportive of Riskier Fixed Income Sectors US Yields (High Yield vs. Investment Grade Bonds) and High Yield Option–Adjusted Spread 25% 2, 500 20% 2, 000 15% 1, 500 10% 1, 000 5% 500 High Yield Option-Adjusted Spread Basis Points (bps) Yield June 1, 2008–June 30, 2018 0% 2008 0 2009 2010 2011 2012 2013 2014 2015 2016 2017 2018 High Yield Option-Adjusted Spread US High Yield (LHS) Investment Grade Yield This chart is for illustrative purposes only and does not reflect the (LHS) performance of any Franklin Templeton fund. (RHS) Past performance does not guarantee future results. Source: Factset. High yield bonds represented by the Bof. A Merrill Lynch US High Yield Index; US Bonds represented by the Bloomberg Barclays US Aggregate Bond Index; Option-Adjusted Spreads represented by the ICE Bof. AML High Yield Master II OAS. The ICE Bof. AML Option-Adjusted Spreads (OASs) are the calculated spreads between a computed OAS index of all bonds in a given rating category and a spot Treasury curve. An OAS index is constructed using each constituent bond’s OAS, weighted by market capitalization. The ICE Bof. AML High Yield Master II OAS uses an index of bonds that are below investment grade (those rated BB or below). Indexes are unmanaged and one cannot invest directly in an index. Please see appendix for description of indexes shown. 26
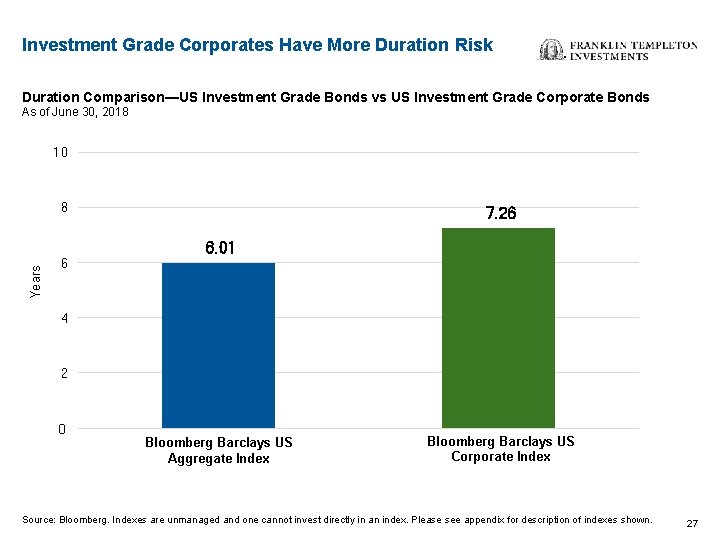
Investment Grade Corporates Have More Duration Risk Duration Comparison—US Investment Grade Bonds vs US Investment Grade Corporate Bonds As of June 30, 2018 10 Years 8 6 7. 26 6. 01 4 2 0 - Bloomberg Barclays US Aggregate Index Bloomberg Barclays US Corporate Index Source: Bloomberg. Indexes are unmanaged and one cannot invest directly in an index. Please see appendix for description of indexes shown. 27
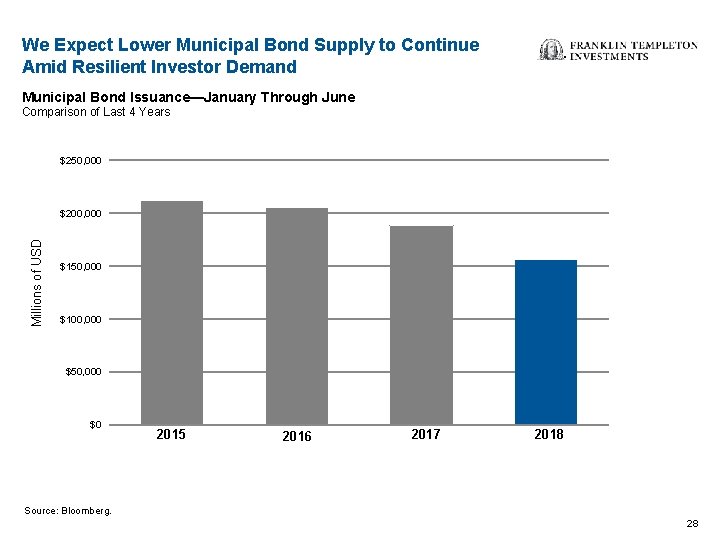
We Expect Lower Municipal Bond Supply to Continue Amid Resilient Investor Demand Municipal Bond Issuance—January Through June Comparison of Last 4 Years $250, 000 Millions of USD $200, 000 $150, 000 $100, 000 $50, 000 $0 2015 2016 2017 2018 Source: Bloomberg. 28
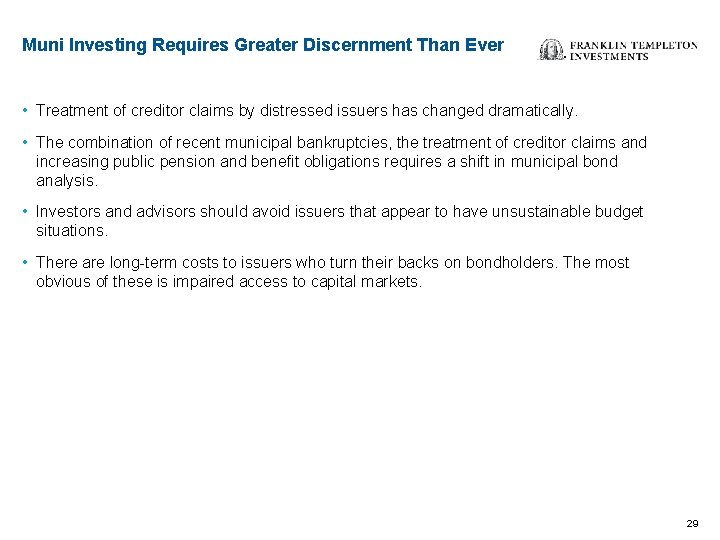
Muni Investing Requires Greater Discernment Than Ever • Treatment of creditor claims by distressed issuers has changed dramatically. • The combination of recent municipal bankruptcies, the treatment of creditor claims and increasing public pension and benefit obligations requires a shift in municipal bond analysis. • Investors and advisors should avoid issuers that appear to have unsustainable budget situations. • There are long-term costs to issuers who turn their backs on bondholders. The most obvious of these is impaired access to capital markets. 29
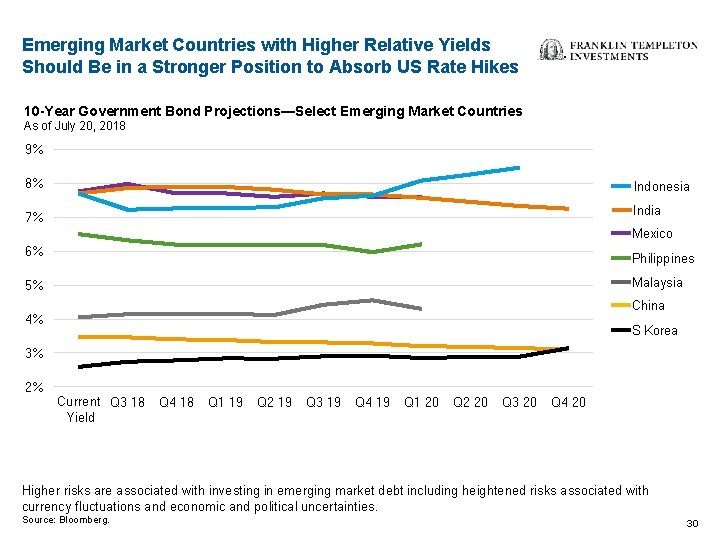
Emerging Market Countries with Higher Relative Yields Should Be in a Stronger Position to Absorb US Rate Hikes 10 -Year Government Bond Projections—Select Emerging Market Countries As of July 20, 2018 9% 8% Indonesia India 7% Mexico 6% Philippines Malaysia 5% China 4% S Korea 3% 2% Current Market Q 3 18 Yields Q 4 18 Q 1 19 Q 2 19 Q 3 19 Q 4 19 Q 1 20 Q 2 20 Q 3 20 Q 4 20 Higher risks are associated with investing in emerging market debt including heightened risks associated with currency fluctuations and economic and political uncertainties. Source: Bloomberg. 30
Key Themes 31
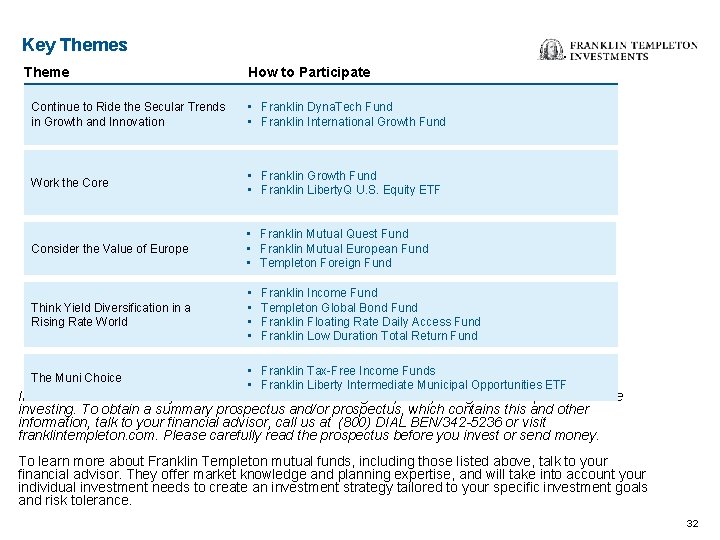
Key Themes Theme How to Participate Continue to Ride the Secular Trends in Growth and Innovation • Franklin Dyna. Tech Fund • Franklin International Growth Fund Work the Core • Franklin Growth Fund • Franklin Liberty. Q U. S. Equity ETF Consider the Value of Europe • Franklin Mutual Quest Fund • Franklin Mutual European Fund • Templeton Foreign Fund Think Yield Diversification in a Rising Rate World • • The Muni Choice • Franklin Tax-Free Income Funds • Franklin Liberty Intermediate Municipal Opportunities ETF Franklin Income Fund Templeton Global Bond Fund Franklin Floating Rate Daily Access Fund Franklin Low Duration Total Return Fund Investors should carefully consider a fund’s investment goals, risks, charges and expenses before investing. To obtain a summary prospectus and/or prospectus, which contains this and other information, talk to your financial advisor, call us at (800) DIAL BEN/342 -5236 or visit franklintempleton. com. Please carefully read the prospectus before you invest or send money. To learn more about Franklin Templeton mutual funds, including those listed above, talk to your financial advisor. They offer market knowledge and planning expertise, and will take into account your individual investment needs to create an investment strategy tailored to your specific investment goals and risk tolerance. 32
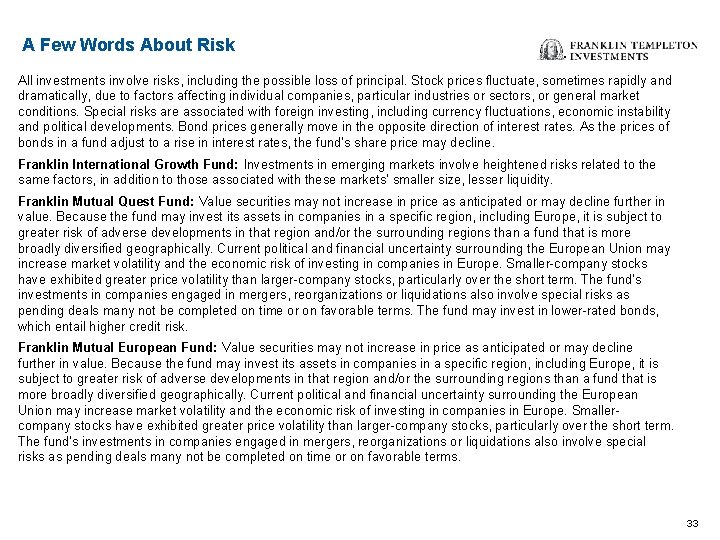
A Few Words About Risk All investments involve risks, including the possible loss of principal. Stock prices fluctuate, sometimes rapidly and dramatically, due to factors affecting individual companies, particular industries or sectors, or general market conditions. Special risks are associated with foreign investing, including currency fluctuations, economic instability and political developments. Bond prices generally move in the opposite direction of interest rates. As the prices of bonds in a fund adjust to a rise in interest rates, the fund’s share price may decline. Franklin International Growth Fund: Investments in emerging markets involve heightened risks related to the same factors, in addition to those associated with these markets’ smaller size, lesser liquidity. Franklin Mutual Quest Fund: Value securities may not increase in price as anticipated or may decline further in value. Because the fund may invest its assets in companies in a specific region, including Europe, it is subject to greater risk of adverse developments in that region and/or the surrounding regions than a fund that is more broadly diversified geographically. Current political and financial uncertainty surrounding the European Union may increase market volatility and the economic risk of investing in companies in Europe. Smaller-company stocks have exhibited greater price volatility than larger-company stocks, particularly over the short term. The fund’s investments in companies engaged in mergers, reorganizations or liquidations also involve special risks as pending deals many not be completed on time or on favorable terms. The fund may invest in lower-rated bonds, which entail higher credit risk. Franklin Mutual European Fund: Value securities may not increase in price as anticipated or may decline further in value. Because the fund may invest its assets in companies in a specific region, including Europe, it is subject to greater risk of adverse developments in that region and/or the surrounding regions than a fund that is more broadly diversified geographically. Current political and financial uncertainty surrounding the European Union may increase market volatility and the economic risk of investing in companies in Europe. Smallercompany stocks have exhibited greater price volatility than larger-company stocks, particularly over the short term. The fund’s investments in companies engaged in mergers, reorganizations or liquidations also involve special risks as pending deals many not be completed on time or on favorable terms. 33
A Few Words About Risk Templeton Foreign Fund: Special risks are associated with foreign investing, including currency fluctuations, economic instability and political developments; investments in developing markets involve heightened risks related to the same factors. Currency rates may fluctuate significantly over short periods of time, and can reduce returns. Because the fund may invest its assets in companies in a specific region, including Europe, it is subject to greater risk of adverse developments in that region and/or the surrounding regions than a fund that is more broadly diversified geographically. Current political and financial uncertainty surrounding the European Union may increase market volatility and the economic risk of investing in companies in Europe. Derivatives, including currency management strategies, involve costs and can create economic leverage in the portfolio which may result in significant volatility and cause the fund to participate in losses (as well as enable gains) on an amount that exceeds the fund’s initial investment. The fund may not achieve the anticipated benefits, and may realize losses when a counterparty fails to perform as promised. Franklin Dyna. Tech Fund: Investments in fast-growing industries like the technology sector (which has historically been volatile) could result in increased price fluctuation, especially over the short term, due to the rapid pace of product change and development and changes in government regulation of companies emphasizing scientific or technological advancement. The fund may also invest in small- and mid-capitalization companies, which can be particularly sensitive to changing economic conditions, and their prospects for growth are less certain than those of larger, more established companies. Franklin Growth Fund: Historically, the fund has focused on larger companies. The fund may also invest in small, relatively new and/or unseasoned companies, which involves additional risks, as the price of these securities can be volatile, particularly over the short term. The fund may focus on particular sectors of the market from time to time, which can carry greater risks of adverse developments in such sectors. In addition, the fund may invest up to 40% of its net assets in stocks of foreign companies, which involve special risks, including currency fluctuations and economic as well as political uncertainty. 34
A Few Words About Risk Franklin Liberty. Q U. S. Equity ETF: There can be no assurance that the fund’s multi-factor stock selection process will enhance performance. Exposure to such investment factors may detract from performance in some market environments, perhaps for extended periods. Performance of the fund may vary significantly from the performance of an index, as a result of transaction costs, expenses and other factors. Templeton Global Bond Fund: Derivatives, including currency management strategies, involve costs and can create economic leverage in the portfolio which may result in significant volatility and cause the fund to participate in losses (as well as enable gains) on an amount that exceeds the fund’s initial investment. The fund may not achieve the anticipated benefits, and may realize losses when a counterparty fails to perform as promised. The markets for particular securities or types of securities are or may become relatively illiquid. Reduced liquidity will have an adverse impact on a security’s value and on the fund’s ability to sell such securities when necessary to meet the fund’s liquidity needs or in response to a specific market event. Foreign securities involve specials risks, including currency fluctuations (which may be significant over the short term) and economic and political uncertainties; investments in emerging markets involve heightened risks related to the same factors. Sovereign debt securities are subject to various risks in addition to those relating to debt securities and foreign securities generally, including, but not limited to, the risk that a government entity may be unwilling or unable to pay interest and repay principal on its sovereign debt, or otherwise meet its obligations when due. Investments in lower-rated bonds include higher risk of default and loss of principal. Changes in the financial strength of a bond issuer or in a bond’s credit rating may affects its value. Franklin Tax-Free Income Funds and Franklin Liberty Intermediate Municipal Opportunities ETF: Because municipal bond are sensitive to interest rate movements, a fund’s yield and share price will fluctuate with market conditions. Changes in the credit rating of a bond, or in the credit rating or financial strength of a bond issuer, insurer or guarantor, may affect the bond’s value. The fund may invest a significant part of its assets in municipal securities that finance similar types of projects, such as utilities, hospitals, higher education and transportation. A change that affects one project would likely affect all similar projects, thereby increasing market risk. 35
A Few Words About Risk Franklin Income Fund: Changes in the financial strength of a bond issuer or in a bond’s credit rating may affect its value. The fund’s portfolio includes a substantial portion of higher-yielding, lower-rated corporate bonds because of the relative higher yields they offer. Floating-rate loans are lower-rated, higher-yielding instruments, which are subject to increased risk of default and can potentially result in loss of principal. These securities carry a greater degree of credit risk relative to investment-grade securities. Franklin Low Duration Total Return Fund: Interest rate movements and mortgage prepayments will affect the fund’s share price and yield. Changes in the financial strength of a bond issuer or in a bond’s credit rating may affects its value. The risks associated with higher-yielding, lower-rated securities include higher risk of default and loss of principal. Investment in foreign securities also involves special risks, including currency fluctuations, and political and economic uncertainty. Derivatives, including currency management strategies, involve costs and can create economic leverage in the portfolio which may result in significant volatility and cause the fund to participate in losses (as well as enable gains) on an amount that exceeds the fund’s initial investment. The fund may not achieve the anticipated benefits, and may realize losses when a counterparty fails to perform as promised. Franklin Floating Rate Daily Access Fund: Investors should be aware that the fund’s share price and yield will fluctuate with market conditions. The fund should not be considered an alternative to money market funds or certificates of deposit (CDs). The floating-rate loans and debt securities in which the fund invests tend to be rated below investment grade. Investing in higher-yielding, lower-rated, floating-rate loans and debt securities involves greater risk of default, which could result in loss of principal – a risk that may be heightened in a slowing economy. Interest earned of floating-rate loans varies with changes in prevailing interest rates. Therefore, while floating-rate loans offer higher interest income when interest rates rise, they will also generate less income when interest rates decline. Changes in the financial strength of a bond issuer or in a bond’s credit rating may affect its value. The fund is actively managed but there is no guarantee that the manager’s investment decisions will produce the desired results. 36
Appendix Index Descriptions Bof. A Merrill Lynch US High Yield Index tracks the performance of US dollar denominated below investment grade corporate debt publicly issued in the US domestic market. Bloomberg Barclays US Aggregate Index is a marketcapitalization weighted index representing the US investment grade fixed rate taxable bond market. Bloomberg Barclays US Corporate Index is a marketcapitalization weighted index representing the US investment grade corporate bond market. CBOE Volatility Index shows the market’s expectation of 30 -day volatility. It is constructed using the implied volatilities of a wide range of S&P 500 Index options. FTSE All-Share Index is a market value weighted index, comprising 641 companies traded on the London Stock Exchange. ICE Bof. AML US High Yield Master II Index tracks the performance of US dollar denominated below investment grade rated corporate debt publically issued in the US domestic market. To qualify for inclusion in the index, securities must have a below investment grade rating (based on an average of Moody's, S&P, and Fitch) and an investment grade rated country of risk. J. P. Morgan Emerging Markets Currency Index (USD) provides investors with a tradable index of emerging markets’ currency markets. The index comprises 10 liquid currencies across Latin America, Asia, Central & Eastern Europe, Middle East and Africa vs. the US dollar. MSCI All Country World Index (ex US) is a market capitalization weighted index designed to provide a broad measure of equitymarket performance throughout the world (excluding the US) and is comprised of stocks from both developed and emerging markets. MSCI Brazil Index is designed to measure the performance of the large and mid cap segments of the Brazilian market. With 53 MSCI China Index captures large and mid cap representation across China H shares, B shares, Red chips, P chips and foreign listings (e. g. ADRs). With 152 constituents, the index covers about 85% of this China equity universe. MSCI Emerging Markets Index is a market-capitalization weighted index designed to measure equity market performance in 23 global emerging market economies. MSCI India Index is designed to measure the performance of the large and mid cap segments of the Indian market. With 79 constituents, the index covers approximately 85% of the Indian equity universe. MSCI Korea Index is designed to measure the performance of the large and mid cap segments of the South Korean market. With 113 constituents, the index covers about 85% of the Korean equity universe. MSCI Russia Index is designed to measure the performance of the large and mid cap segments of the Russian market. With 23 constituents, the index covers approximately 85% of the free float -adjusted market capitalization in Russia. MSCI South Africa Index is designed to measure the performance of the large and mid cap segments of the South African market. With 52 constituents, the index covers approximately 85% of the free float-adjusted market capitalization in South Africa. MSCI Taiwan Index is designed to measure the performance of the large and mid cap segments of the Taiwan market. With 89 constituents, the index covers approximately 85% of the free float -adjusted market capitalization in Taiwan. MSCI World Index captures large and mid cap representation across 23 Developed Markets (DM) countries. With 1, 653 constituents, the index covers approximately 85% of the free float -adjusted market capitalization in each country. Nikkei 225 Index is a price-weighted index comprised of Japan's 37
Appendix Index Descriptions S&P 500 Index is a market capitalization-weighted index of 500 stocks designed to measure total US equity market performance. 38
WHAT FRANKLIN TEMPLETON THINKS… Q 3 2018 Important data provider notices and terms available at www. franklintempletondatasources. com. Investors should carefully consider a fund’s investment goals, risks, charges and expenses before investing. To obtain a summary prospectus and/or prospectus, which contains this and other information, talk to your financial advisor, call us at (800) DIAL BEN/342 -5236 or visit franklintempleton. com. Please carefully read the prospectus before you invest or send money. Franklin Templeton Distributors, Inc. One Franklin Parkway San Mateo, California 94403 -1906 (800) DIAL BEN®/342 -5236 franklintempleton. com © 2018 Franklin Templeton Investments. All rights reserved. FTTK 08/18