
Franklin Bissett Investment Management FRANKLIN BISSETT CORE PLUS
Franklin Bissett Investment Management FRANKLIN BISSETT CORE PLUS BOND FUND SERIES F Data as of December 31, 2020 Franklin Bissett Investment Management and Franklin Templeton Institutional, part of Franklin Templeton Investments Corp. Only /Not Notfor for. Distributionto to. The. Public For Dealer Use Only. www. franklintempleton. ca 800 -387 -0830
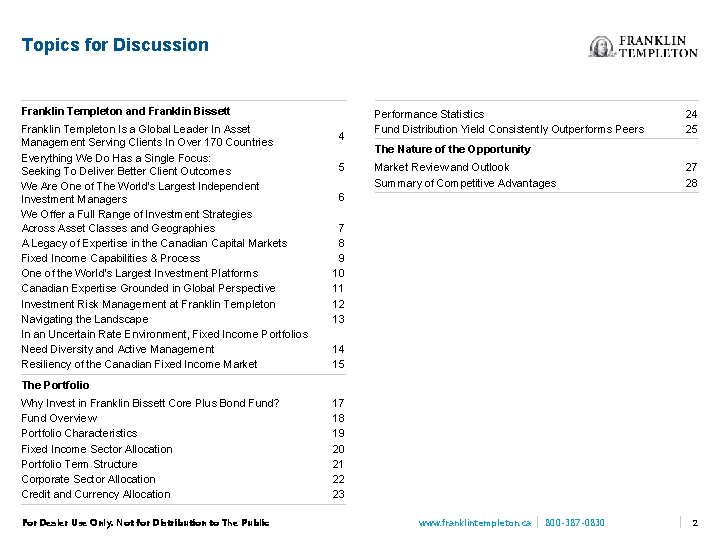
Topics for Discussion Franklin Templeton and Franklin Bissett Franklin Templeton Is a Global Leader In Asset Management Serving Clients In Over 170 Countries Everything We Do Has a Single Focus: Seeking To Deliver Better Client Outcomes We Are One of The World’s Largest Independent Investment Managers We Offer a Full Range of Investment Strategies Across Asset Classes and Geographies A Legacy of Expertise in the Canadian Capital Markets Fixed Income Capabilities & Process One of the World’s Largest Investment Platforms Canadian Expertise Grounded in Global Perspective Investment Risk Management at Franklin Templeton Navigating the Landscape In an Uncertain Rate Environment, Fixed Income Portfolios Need Diversity and Active Management Resiliency of the Canadian Fixed Income Market 4 Performance Statistics Fund Distribution Yield Consistently Outperforms Peers 24 25 The Nature of the Opportunity 5 Market Review and Outlook Summary of Competitive Advantages 27 28 6 7 8 9 10 11 12 13 14 15 The Portfolio Why Invest in Franklin Bissett Core Plus Bond Fund? Fund Overview Portfolio Characteristics Fixed Income Sector Allocation Portfolio Term Structure Corporate Sector Allocation Credit and Currency Allocation Only /Not Notfor for. Distributionto to. The. Public For Dealer Use Only. 17 18 19 20 21 22 23 www. franklintempleton. ca 800 -387 -0830 2
THE FRANKLIN BISSETT ADVANTAGE Only /Not Notfor for. Distributionto to. The. Public For Dealer Use Only. www. franklintempleton. ca 800 -387 -0830
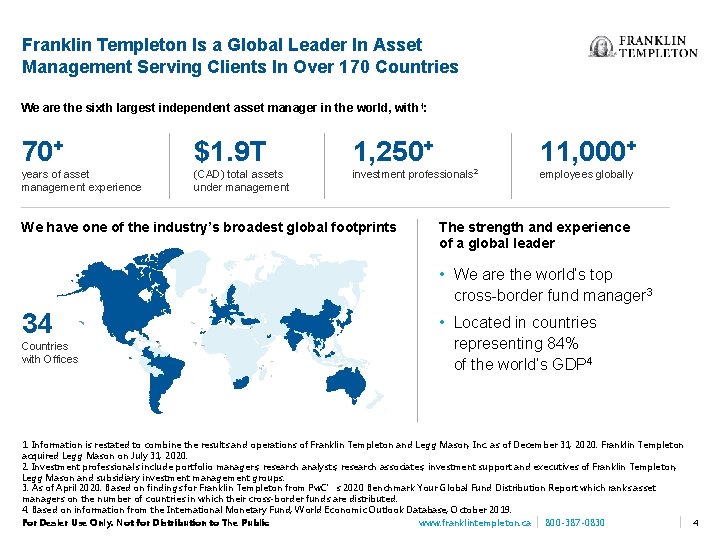
Franklin Templeton Is a Global Leader In Asset Management Serving Clients In Over 170 Countries We are the sixth largest independent asset manager in the world, with 1: 70+ $1. 9 T 1, 250+ 11, 000+ years of asset management experience (CAD) total assets under management investment professionals 2 employees globally We have one of the industry’s broadest global footprints The strength and experience of a global leader • We are the world’s top cross-border fund manager 3 34 Countries with Offices • Located in countries representing 84% of the world’s GDP 4 1. Information is restated to combine the results and operations of Franklin Templeton and Legg Mason, Inc. as of December 31, 2020. Franklin Templeton acquired Legg Mason on July 31, 2020. 2. Investment professionals include portfolio managers, research analysts, research associates, investment support and executives of Franklin Templeton, Legg Mason and subsidiary investment management groups. 3. As of April 2020. Based on findings for Franklin Templeton from Pw. C’s 2020 Benchmark Your Global Fund Distribution Report which ranks asset managers on the number of countries in which their cross‐border funds are distributed. 4. Based on information from the International Monetary Fund, World Economic Outlook Database, October 2019. Only /Not Notfor for. Distributionto to. The. Public For Dealer Use Only. www. franklintempleton. ca 800 -387 -0830 4
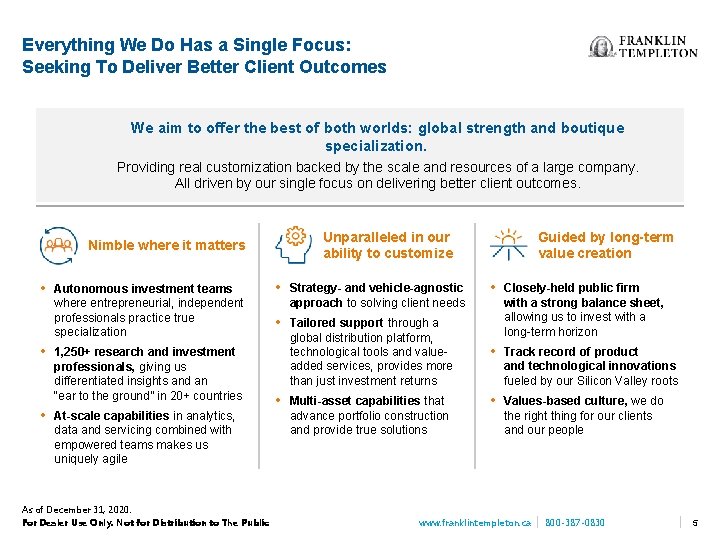
Everything We Do Has a Single Focus: Seeking To Deliver Better Client Outcomes We aim to offer the best of both worlds: global strength and boutique specialization. Providing real customization backed by the scale and resources of a large company. All driven by our single focus on delivering better client outcomes. Unparalleled in our ability to customize Nimble where it matters • Autonomous investment teams where entrepreneurial, independent professionals practice true specialization • 1, 250+ research and investment professionals, giving us differentiated insights and an “ear to the ground” in 20+ countries • At-scale capabilities in analytics, data and servicing combined with empowered teams makes us uniquely agile As of December 31, 2020. Only /Not Notfor for. Distributionto to. The. Public For Dealer Use Only. • Strategy- and vehicle-agnostic approach to solving client needs • Tailored support through a global distribution platform, technological tools and valueadded services, provides more than just investment returns • Multi-asset capabilities that advance portfolio construction and provide true solutions Guided by long-term value creation • Closely-held public firm with a strong balance sheet, allowing us to invest with a long-term horizon • Track record of product and technological innovations fueled by our Silicon Valley roots • Values-based culture, we do the right thing for our clients and our people www. franklintempleton. ca 800 -387 -0830 5
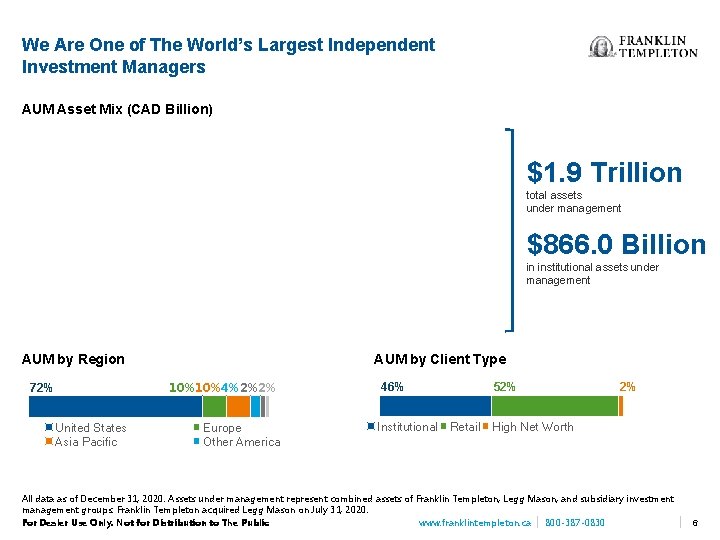
We Are One of The World’s Largest Independent Investment Managers AUM Asset Mix (CAD Billion) $852. 1 $630. 6 $161. 6 $1. 9 Trillion total assets under management $179. 5 $866. 0 Billion in institutional assets under management $81. 7 AUM by Region AUM by Client Type 10%10%4%2%2% 72% United States Asia Pacific Europe Other America 46% 52% 2% Institutional Retail High Net Worth All data as of December 31, 2020. Assets under management represent combined assets of Franklin Templeton, Legg Mason, and subsidiary investment management groups. Franklin Templeton acquired Legg Mason on July 31, 2020. Only /Not Notfor for. Distributionto to. The. Public For Dealer Use Only. www. franklintempleton. ca 800 -387 -0830 6
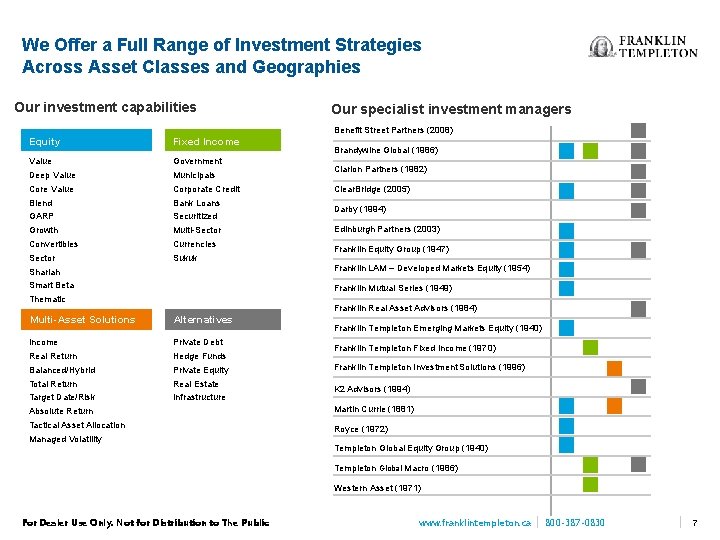
We Offer a Full Range of Investment Strategies Across Asset Classes and Geographies Our investment capabilities Our specialist investment managers Benefit Street Partners (2008) Equity Fixed Income Value Government Deep Value Municipals Core Value Corporate Credit Blend Bank Loans GARP Securitized Growth Multi-Sector Convertibles Currencies Sector Sukuk Brandywine Global (1986) Clarion Partners (1982) Clear. Bridge (2005) Darby (1994) Edinburgh Partners (2003) Franklin Equity Group (1947) Shariah Franklin LAM – Developed Markets Equity (1954) Smart Beta Franklin Mutual Series (1949) Thematic Franklin Real Asset Advisors (1984) Multi-Asset Solutions Alternatives Income Private Debt Real Return Hedge Funds Balanced/Hybrid Private Equity Franklin Templeton Investment Solutions (1996) Total Return Real Estate Target Date/Risk Infrastructure K 2 Advisors (1994) Franklin Templeton Emerging Markets Equity (1940) Franklin Templeton Fixed Income (1970) Absolute Return Martin Currie (1881) Tactical Asset Allocation Royce (1972) Managed Volatility Templeton Global Equity Group (1940) Templeton Global Macro (1986) Western Asset (1971) Only /Not Notfor for. Distributionto to. The. Public For Dealer Use Only. www. franklintempleton. ca 800 -387 -0830 7
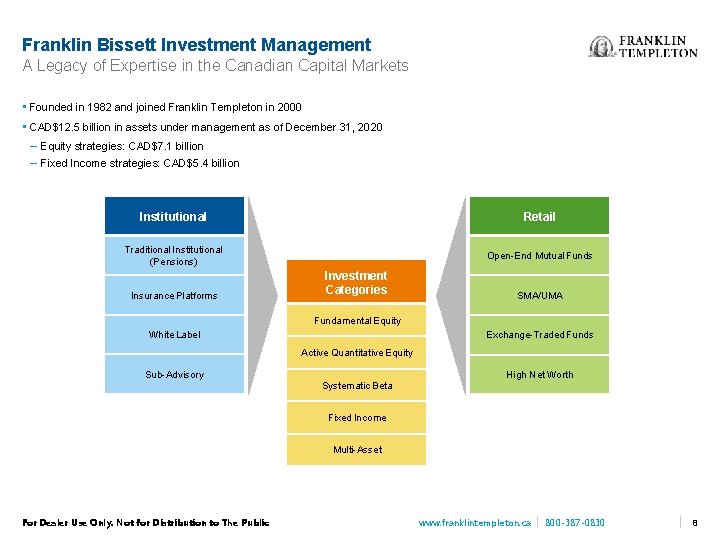
Franklin Bissett Investment Management A Legacy of Expertise in the Canadian Capital Markets • Founded in 1982 and joined Franklin Templeton in 2000 • CAD$12. 5 billion in assets under management as of December 31, 2020 – Equity strategies: CAD$7. 1 billion – Fixed Income strategies: CAD$5. 4 billion Institutional Retail Traditional Institutional (Pensions) Open-End Mutual Funds Insurance Platforms Investment Categories SMA/UMA Fundamental Equity White Label Exchange-Traded Funds Active Quantitative Equity Sub-Advisory Systematic Beta High Net Worth Fixed Income Multi-Asset Only /Not Notfor for. Distributionto to. The. Public For Dealer Use Only. www. franklintempleton. ca 800 -387 -0830 8
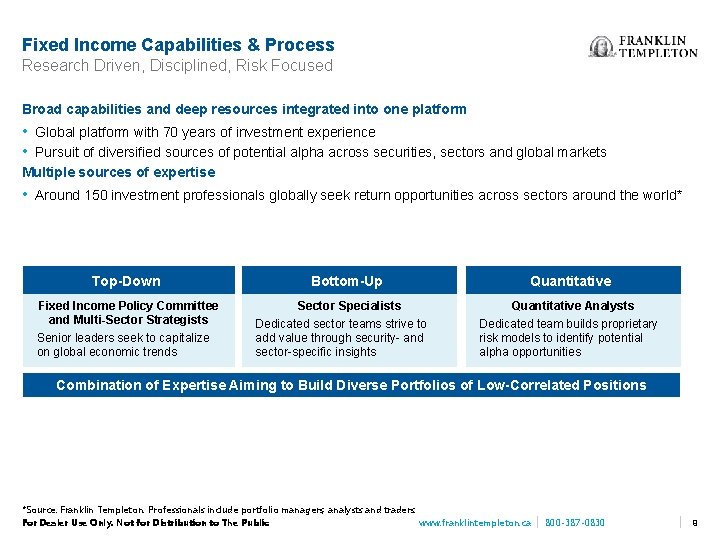
Fixed Income Capabilities & Process Research Driven, Disciplined, Risk Focused Broad capabilities and deep resources integrated into one platform • Global platform with 70 years of investment experience • Pursuit of diversified sources of potential alpha across securities, sectors and global markets Multiple sources of expertise • Around 150 investment professionals globally seek return opportunities across sectors around the world* Top-Down Fixed Income Policy Committee and Multi-Sector Strategists Senior leaders seek to capitalize on global economic trends Bottom-Up Sector Specialists Dedicated sector teams strive to add value through security- and sector-specific insights Quantitative Analysts Dedicated team builds proprietary risk models to identify potential alpha opportunities Combination of Expertise Aiming to Build Diverse Portfolios of Low-Correlated Positions *Source: Franklin Templeton. Professionals include portfolio managers, analysts and traders. Only /Not Notfor for. Distributionto to. The. Public For Dealer Use Only. www. franklintempleton. ca 800 -387 -0830 9
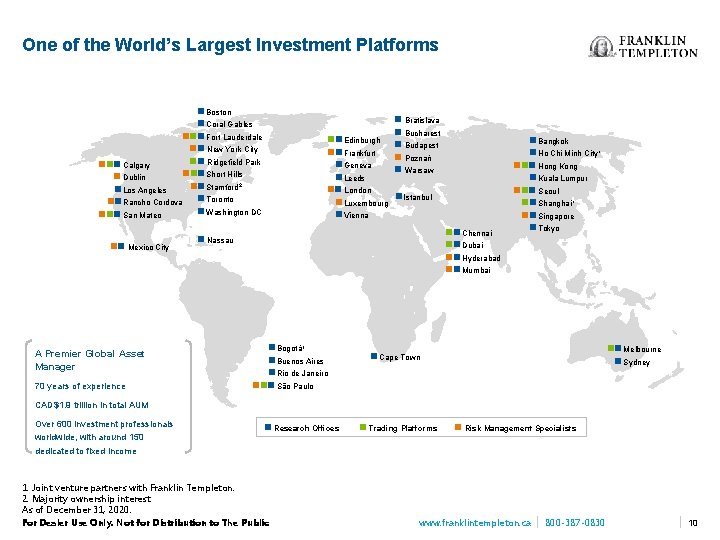
One of the World’s Largest Investment Platforms Boston Coral Gables Fort Lauderdale New York City Ridgefield Park Calgary Short Hills Dublin Stamford 2 Los Angeles Rancho Cordova Toronto Washington DC San Mateo Mexico City A Premier Global Asset Manager 70 years of experience Bratislava Bucharest Budapest Poznań Warsaw Edinburgh Frankfurt Geneva Leeds London Istanbul Luxembourg Vienna Chennai Dubai Hyderabad Mumbai Nassau Bogotá 1 Buenos Aires Rio de Janeiro São Paulo Bangkok Ho Chi Minh City¹ Hong Kong Kuala Lumpur Seoul Shanghai¹ Singapore Tokyo Melbourne Sydney Cape Town CAD$1. 9 trillion in total AUM Over 600 investment professionals worldwide, with around 150 dedicated to fixed income Research Offices 1. Joint venture partners with Franklin Templeton. 2. Majority ownership interest. As of December 31, 2020. Only /Not Notfor for. Distributionto to. The. Public For Dealer Use Only. Trading Platforms Risk Management Specialists www. franklintempleton. ca 800 -387 -0830 10
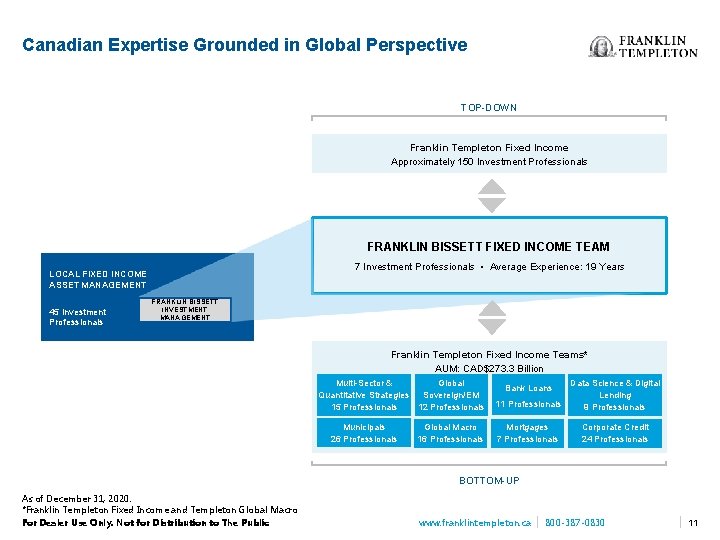
Canadian Expertise Grounded in Global Perspective TOP-DOWN Franklin Templeton Fixed Income Approximately 150 Investment Professionals FRANKLIN BISSETT FIXED INCOME TEAM 7 Investment Professionals • Average Experience: 19 Years LOCAL FIXED INCOME ASSET MANAGEMENT 45 Investment Professionals FRANKLIN BISSETT INVESTMENT MANAGEMENT Franklin Templeton Fixed Income Teams* AUM: CAD$273. 3 Billion Multi-Sector & Global Quantitative Strategies Sovereign/EM 15 Professionals 12 Professionals Municipals 26 Professionals Global Macro 16 Professionals Data Science & Digital Lending 11 Professionals 9 Professionals Bank Loans Mortgages 7 Professionals Corporate Credit 24 Professionals BOTTOM-UP As of December 31, 2020. *Franklin Templeton Fixed Income and Templeton Global Macro Only /Not Notfor for. Distributionto to. The. Public For Dealer Use Only. www. franklintempleton. ca 800 -387 -0830 11
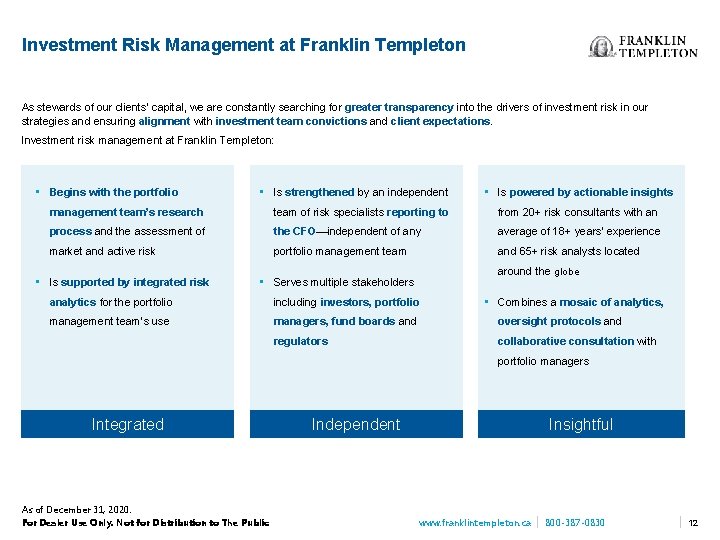
Investment Risk Management at Franklin Templeton As stewards of our clients’ capital, we are constantly searching for greater transparency into the drivers of investment risk in our strategies and ensuring alignment with investment team convictions and client expectations. Investment risk management at Franklin Templeton: • Begins with the portfolio • Is strengthened by an independent • Is powered by actionable insights management team’s research team of risk specialists reporting to from 20+ risk consultants with an process and the assessment of the CFO—independent of any average of 18+ years’ experience market and active risk portfolio management team and 65+ risk analysts located • Is supported by integrated risk around the globe • Serves multiple stakeholders • Combines a mosaic of analytics, analytics for the portfolio including investors, portfolio management team’s use managers, fund boards and oversight protocols and regulators collaborative consultation with portfolio managers Integrated As of December 31, 2020. Only /Not Notfor for. Distributionto to. The. Public For Dealer Use Only. Independent Insightful www. franklintempleton. ca 800 -387 -0830 12
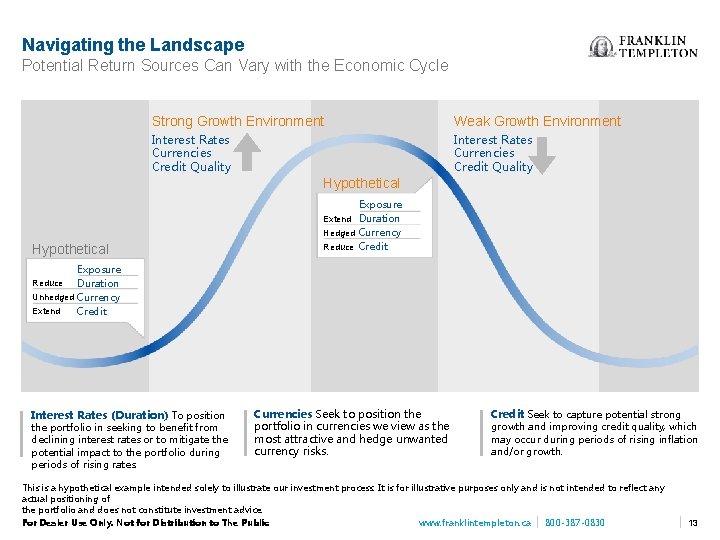
Navigating the Landscape Potential Return Sources Can Vary with the Economic Cycle Strong Growth Environment Weak Growth Environment Interest Rates Currencies Credit Quality Hypothetical Exposure Extend Duration Hedged Currency Reduce Credit Exposure Duration Unhedged Currency Extend Credit Reduce Interest Rates (Duration) To position the portfolio in seeking to benefit from declining interest rates or to mitigate the potential impact to the portfolio during periods of rising rates. Currencies Seek to position the portfolio in currencies we view as the most attractive and hedge unwanted currency risks. Credit Seek to capture potential strong growth and improving credit quality, which may occur during periods of rising inflation and/or growth. This is a hypothetical example intended solely to illustrate our investment process. It is for illustrative purposes only and is not intended to reflect any actual positioning of the portfolio and does not constitute investment advice. Only /Not Notfor for. Distributionto to. The. Public For Dealer Use Only. www. franklintempleton. ca 800 -387 -0830 13
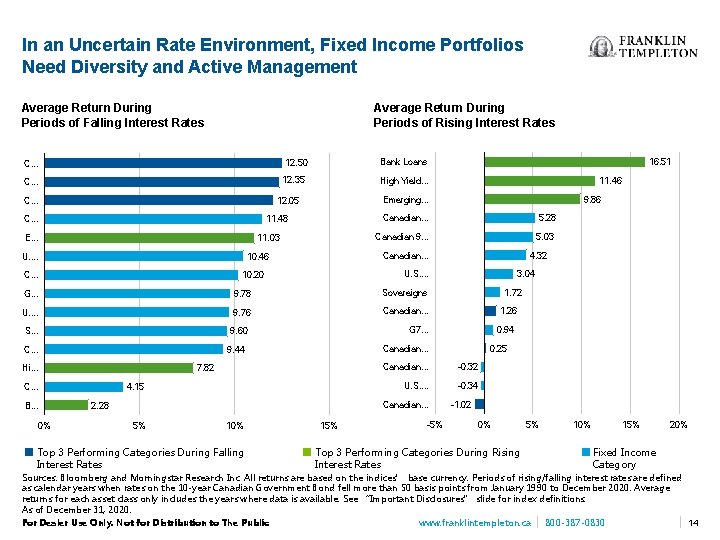
In an Uncertain Rate Environment, Fixed Income Portfolios Need Diversity and Active Management Average Return During Periods of Falling Interest Rates Average Return During Periods of Rising Interest Rates Bank Loans 12. 50 C. . . 12. 35 C. . . High Yield. . . 11. 48 E. . . 11. 03 U. . Canadian. . . 5. 28 Canadian 9. . . 5. 03 G. . . 9. 78 Sovereigns U. . 9. 76 Canadian. . . 7. 82 C. . . B. . . 4. 15 5% 10% Top 3 Performing Categories During Falling Interest Rates 1. 26 0. 94 15% 0. 25 Canadian. . . -0. 32 U. S. . -0. 34 Canadian. . . 2. 28 0% 1. 72 Canadian. . . 9. 44 Hi. . . 3. 04 G 7. . . 9. 60 C. . . 4. 32 U. S. . 10. 20 S. . . 9. 86 Canadian. . . 10. 46 C. . . 11. 46 Emerging. . . 12. 05 C. . . 16. 51 -5% -1. 02 0% Top 3 Performing Categories During Rising Interest Rates 5% 10% 15% 20% Fixed Income Category Sources: Bloomberg and Morningstar Research Inc. All returns are based on the indices’ base currency. Periods of rising/falling interest rates are defined as calendar years when rates on the 10 -year Canadian Government Bond fell more than 50 basis points from January 1990 to December 2020. Average returns for each asset class only includes the years where data is available. See “Important Disclosures” slide for index definitions. As of December 31, 2020. Only /Not Notfor for. Distributionto to. The. Public 14 For Dealer Use Only. www. franklintempleton. ca 800 -387 -0830
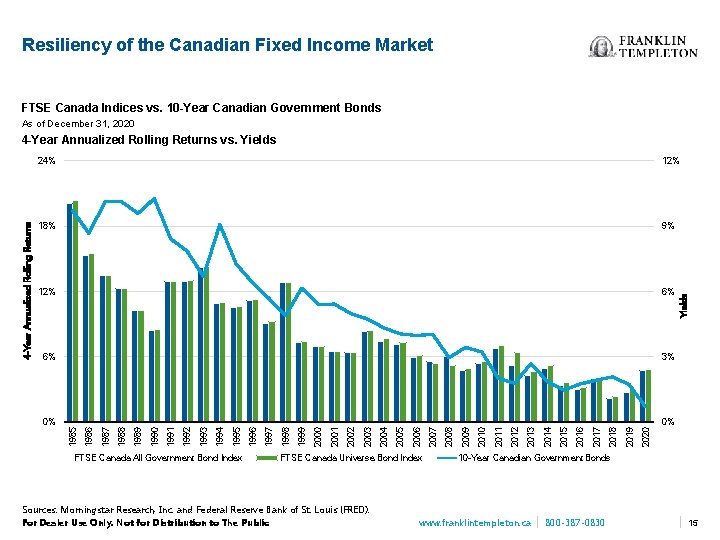
Resiliency of the Canadian Fixed Income Market FTSE Canada Indices vs. 10 -Year Canadian Government Bonds As of December 31, 2020 FTSE Canada All Government Bond Index FTSE Canada Universe Bond Index Sources: Morningstar Research, Inc. and Federal Reserve Bank of St. Louis (FRED). Only /Not Notfor for. Distributionto to. The. Public For Dealer Use Only. Yields 2020 2019 2018 2017 2016 2015 2014 2013 2012 2011 2010 2009 2008 2007 2006 2005 2004 2003 2002 2001 2000 1999 1998 1997 1996 1995 0% 1994 0% 1993 3% 1992 6% 1991 6% 1990 12% 1989 9% 1988 18% 1987 12% 1986 24% 1985 4 -Year Annualized Rolling Returns vs. Yields 10 -Year Canadian Government Bonds www. franklintempleton. ca 800 -387 -0830 15
FRANKLIN BISSETT CORE PLUS BOND FUND Only /Not Notfor for. Distributionto to. The. Public For Dealer Use Only. www. franklintempleton. ca 800 -387 -0830
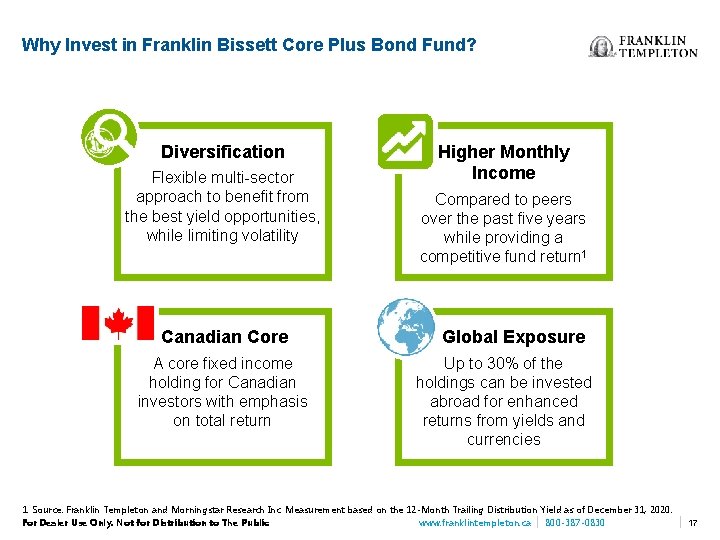
Why Invest in Franklin Bissett Core Plus Bond Fund? Diversification Flexible multi-sector approach to benefit from the best yield opportunities, while limiting volatility Canadian Core A core fixed income holding for Canadian investors with emphasis on total return Higher Monthly Income Compared to peers over the past five years while providing a competitive fund return 1 Global Exposure Up to 30% of the holdings can be invested abroad for enhanced returns from yields and currencies 1. Source: Franklin Templeton and Morningstar Research Inc. Measurement based on the 12 -Month Trailing Distribution Yield as of December 31, 2020. Only /Not Notfor for. Distributionto to. The. Public For Dealer Use Only. www. franklintempleton. ca 800 -387 -0830 17
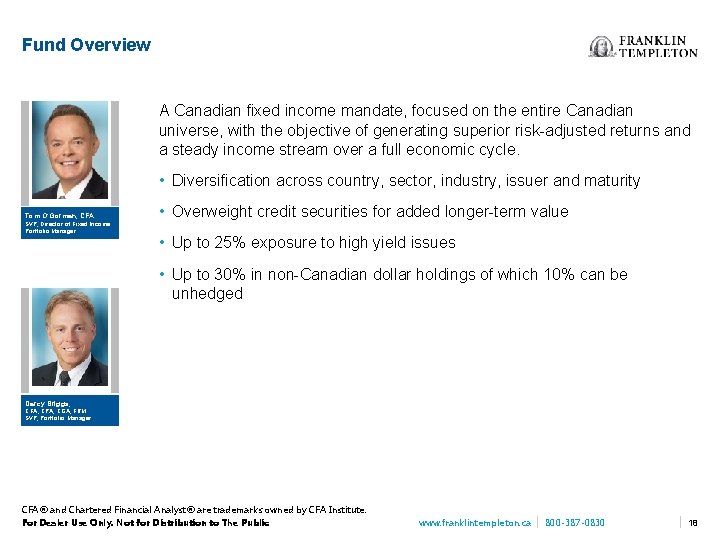
Fund Overview A Canadian fixed income mandate, focused on the entire Canadian universe, with the objective of generating superior risk-adjusted returns and a steady income stream over a full economic cycle. • Diversification across country, sector, industry, issuer and maturity Tom O’Gorman, CFA SVP, Director of Fixed Income Portfolio Manager • Overweight credit securities for added longer-term value • Up to 25% exposure to high yield issues • Up to 30% in non-Canadian dollar holdings of which 10% can be unhedged Darcy Briggs, CFA, CPA, CGA, FRM SVP, Portfolio Manager CFA® and Chartered Financial Analyst® are trademarks owned by CFA Institute. Only /Not Notfor for. Distributionto to. The. Public For Dealer Use Only. www. franklintempleton. ca 800 -387 -0830 18
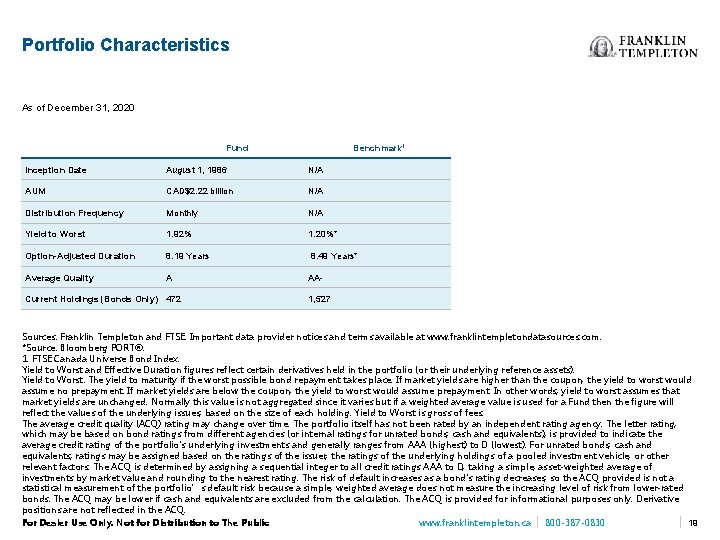
Portfolio Characteristics As of December 31, 2020 Fund Benchmark 1 Inception Date August 1, 1986 N/A AUM CAD$2. 22 billion N/A Distribution Frequency Monthly N/A Yield to Worst 1. 92% 1. 20%* Option-Adjusted Duration 8. 19 Years 8. 49 Years* Average Quality A AA- Current Holdings (Bonds Only) 472 1, 527 Sources: Franklin Templeton and FTSE. Important data provider notices and terms available at www. franklintempletondatasources. com. *Source: Bloomberg PORT®. 1. FTSE Canada Universe Bond Index. Yield to Worst and Effective Duration figures reflect certain derivatives held in the portfolio (or their underlying reference assets). Yield to Worst: The yield to maturity if the worst possible bond repayment takes place. If market yields are higher than the coupon, the yield to worst would assume no prepayment. If market yields are below the coupon, the yield to worst would assume prepayment. In other words, yield to worst assumes that market yields are unchanged. Normally this value is not aggregated since it varies but if a weighted average value is used for a Fund then the figure will reflect the values of the underlying issues, based on the size of each holding. Yield to Worst is gross of fees. The average credit quality (ACQ) rating may change over time. The portfolio itself has not been rated by an independent rating agency. The letter rating, which may be based on bond ratings from different agencies (or internal ratings for unrated bonds, cash and equivalents), is provided to indicate the average credit rating of the portfolio's underlying investments and generally ranges from AAA (highest) to D (lowest). For unrated bonds, cash and equivalents, ratings may be assigned based on the ratings of the issuer, the ratings of the underlying holdings of a pooled investment vehicle, or other relevant factors. The ACQ is determined by assigning a sequential integer to all credit ratings AAA to D, taking a simple, asset-weighted average of investments by market value and rounding to the nearest rating. The risk of default increases as a bond's rating decreases, so the ACQ provided is not a statistical measurement of the portfolio’s default risk because a simple, weighted average does not measure the increasing level of risk from lower-rated bonds. The ACQ may be lower if cash and equivalents are excluded from the calculation. The ACQ is provided for informational purposes only. Derivative positions are not reflected in the ACQ. Only /Not Notfor for. Distributionto to. The. Public 19 For Dealer Use Only. www. franklintempleton. ca 800 -387 -0830
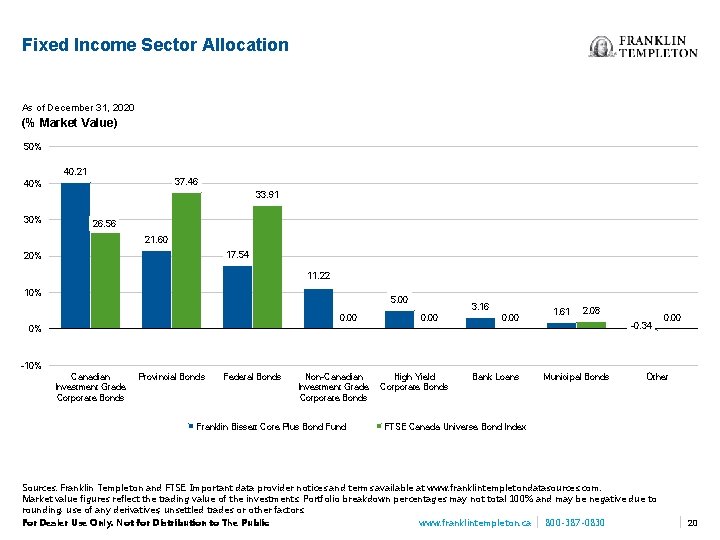
Fixed Income Sector Allocation As of December 31, 2020 (% Market Value) 50% 40. 21 37. 46 40% 33. 91 30% 26. 56 21. 60 17. 54 20% 11. 22 10% 5. 00 0. 00 3. 16 0. 00 1. 61 2. 08 -0. 34 0% 0. 00 -10% Canadian Investment Grade Corporate Bonds Provincial Bonds Federal Bonds Non-Canadian Investment Grade Corporate Bonds Franklin Bissett Core Plus Bond Fund High Yield Corporate Bonds Bank Loans Municipal Bonds Other FTSE Canada Universe Bond Index Sources: Franklin Templeton and FTSE. Important data provider notices and terms available at www. franklintempletondatasources. com. Market value figures reflect the trading value of the investments. Portfolio breakdown percentages may not total 100% and may be negative due to rounding, use of any derivatives, unsettled trades or other factors. Only /Not Notfor for. Distributionto to. The. Public For Dealer Use Only. www. franklintempleton. ca 800 -387 -0830 20
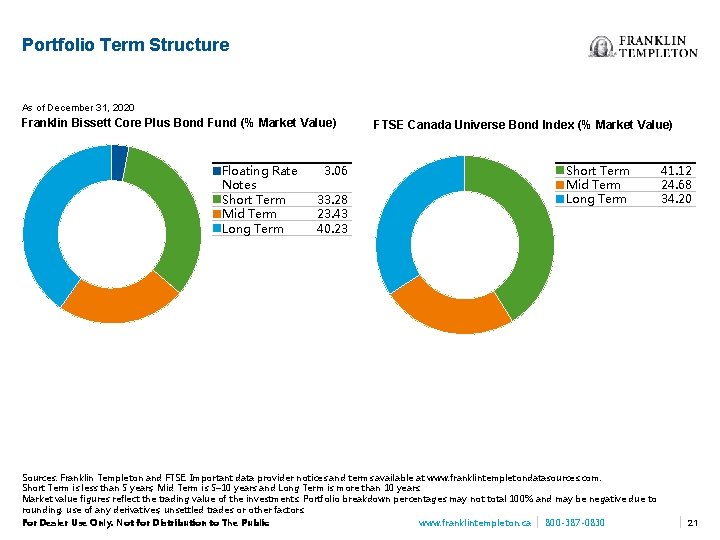
Portfolio Term Structure As of December 31, 2020 Franklin Bissett Core Plus Bond Fund (% Market Value) Floating Rate Notes Short Term Mid Term Long Term 3. 06 33. 28 23. 43 40. 23 FTSE Canada Universe Bond Index (% Market Value) Short Term Mid Term Long Term Sources: Franklin Templeton and FTSE. Important data provider notices and terms available at www. franklintempletondatasources. com. Short Term is less than 5 years, Mid Term is 5– 10 years and Long Term is more than 10 years. Market value figures reflect the trading value of the investments. Portfolio breakdown percentages may not total 100% and may be negative due to rounding, use of any derivatives, unsettled trades or other factors. Only /Not Notfor for. Distributionto to. The. Public For Dealer Use Only. www. franklintempleton. ca 800 -387 -0830 41. 12 24. 68 34. 20 21
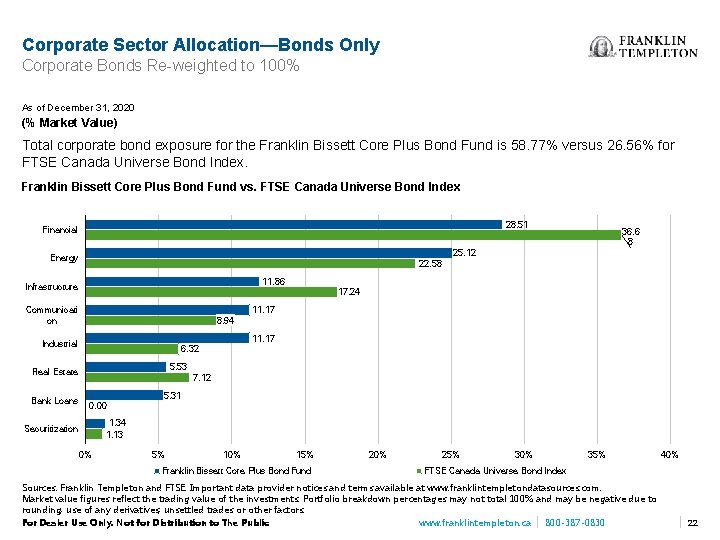
Corporate Sector Allocation—Bonds Only Corporate Bonds Re-weighted to 100% As of December 31, 2020 (% Market Value) Total corporate bond exposure for the Franklin Bissett Core Plus Bond Fund is 58. 77% versus 26. 56% for FTSE Canada Universe Bond Index. Franklin Bissett Core Plus Bond Fund vs. FTSE Canada Universe Bond Index 28. 51 Financial 25. 12 Energy 22. 58 11. 86 Infrastructure 17. 24 Communicati on 11. 17 8. 94 11. 17 Industrial 6. 32 5. 53 Real Estate Bank Loans 36. 6 8 7. 12 5. 31 0. 00 1. 34 1. 13 Securitization 0% 5% 10% 15% Franklin Bissett Core Plus Bond Fund 20% 25% 30% 35% 40% FTSE Canada Universe Bond Index Sources: Franklin Templeton and FTSE. Important data provider notices and terms available at www. franklintempletondatasources. com. Market value figures reflect the trading value of the investments. Portfolio breakdown percentages may not total 100% and may be negative due to rounding, use of any derivatives, unsettled trades or other factors. Only /Not Notfor for. Distributionto to. The. Public For Dealer Use Only. www. franklintempleton. ca 800 -387 -0830 22
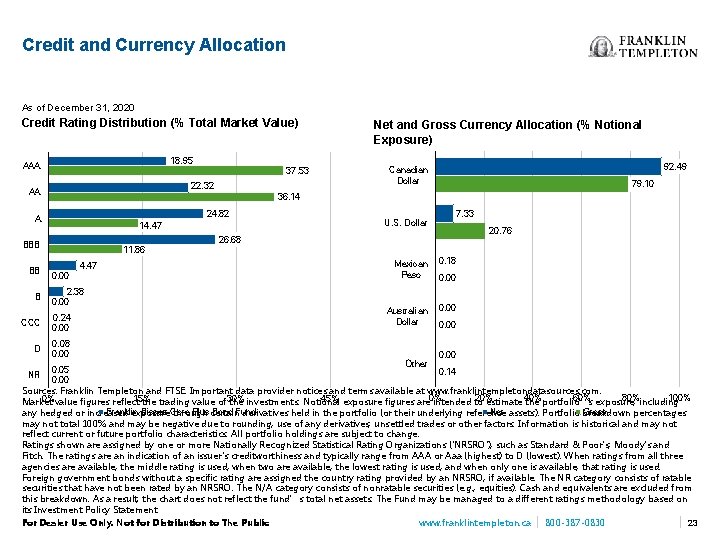
Credit and Currency Allocation As of December 31, 2020 Credit Rating Distribution (% Total Market Value) 18. 95 AAA 37. 53 22. 32 AA 24. 82 14. 47 79. 10 7. 33 U. S. Dollar 20. 76 26. 68 BBB B 92. 49 Canadian Dollar 36. 14 A BB Net and Gross Currency Allocation (% Notional Exposure) 11. 86 0. 00 4. 47 2. 38 0. 00 CCC 0. 24 0. 00 D 0. 08 0. 00 Mexican Peso Australian Dollar Other 0. 18 0. 00 0. 05 0. 14 0. 00 Sources: Franklin Templeton and FTSE. Important data provider notices and terms available at www. franklintempletondatasources. com. 20% 60% exposure, 80%including 100% 0%value figures reflect 15% 45% exposure figures are 0% Market the trading value of 30% the investments. Notional intended to estimate 40% the portfolio’s Net assets). Portfolio breakdown Gross Franklin Bissett Core Plus certain Bond Fund any hedged or increased exposure through derivatives held in the portfolio (or their underlying reference percentages may not total 100% and may be negative due to rounding, use of any derivatives, unsettled trades or other factors. Information is historical and may not reflect current or future portfolio characteristics. All portfolio holdings are subject to change. Ratings shown are assigned by one or more Nationally Recognized Statistical Rating Organizations ('NRSRO'), such as Standard & Poor's, Moody's and Fitch. The ratings are an indication of an issuer's creditworthiness and typically range from AAA or Aaa (highest) to D (lowest). When ratings from all three agencies are available, the middle rating is used; when two are available, the lowest rating is used; and when only one is available, that rating is used. Foreign government bonds without a specific rating are assigned the country rating provided by an NRSRO, if available. The NR category consists of ratable securities that have not been rated by an NRSRO. The N/A category consists of nonratable securities (e. g. , equities). Cash and equivalents are excluded from this breakdown. As a result, the chart does not reflect the fund’s total net assets. The Fund may be managed to a different ratings methodology based on its Investment Policy Statement. Only /Not Notfor for. Distributionto to. The. Public 23 For Dealer Use Only. www. franklintempleton. ca 800 -387 -0830 NR
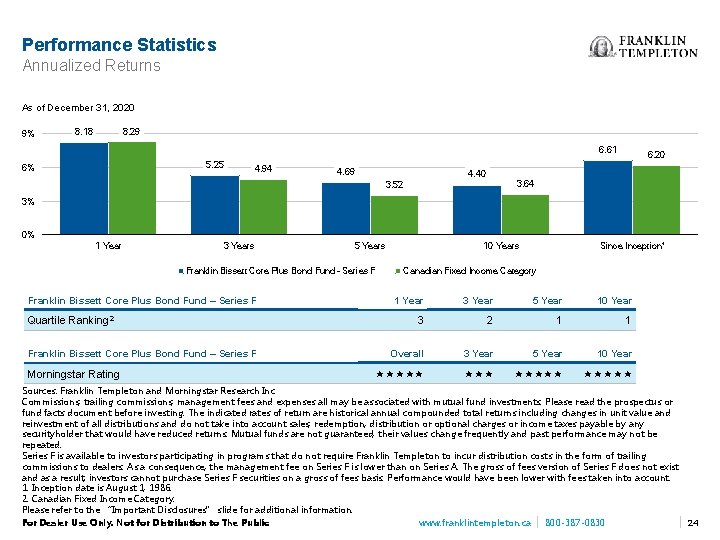
Performance Statistics Annualized Returns As of December 31, 2020 9% 8. 29 8. 18 6. 61 5. 25 6% 4. 94 4. 69 4. 40 6. 20 3. 64 3. 52 3% 0% 1 Year 3 Years 5 Years Franklin Bissett Core Plus Bond Fund – Series F Quartile Ranking 2 Franklin Bissett Core Plus Bond Fund – Series F Morningstar Rating 10 Years Since Inception¹ Canadian Fixed Income Category 1 Year 3 Year 5 Year 10 Year 3 2 1 1 Overall 3 Year 5 Year 10 Year Sources: Franklin Templeton and Morningstar Research Inc. Commissions, trailing commissions, management fees and expenses all may be associated with mutual fund investments. Please read the prospectus or fund facts document before investing. The indicated rates of return are historical annual compounded total returns including changes in unit value and reinvestment of all distributions and do not take into account sales, redemption, distribution or optional charges or income taxes payable by any securityholder that would have reduced returns. Mutual funds are not guaranteed, their values change frequently and past performance may not be repeated. Series F is available to investors participating in programs that do not require Franklin Templeton to incur distribution costs in the form of trailing commissions to dealers. As a consequence, the management fee on Series F is lower than on Series A. The gross of fees version of Series F does not exist and as a result, investors cannot purchase Series F securities on a gross of fees basis. Performance would have been lower with fees taken into account. 1. Inception date is August 1, 1986. 2. Canadian Fixed Income Category. Please refer to the “Important Disclosures” slide for additional information. Only /Not Notfor for. Distributionto to. The. Public For Dealer Use Only. www. franklintempleton. ca 800 -387 -0830 24
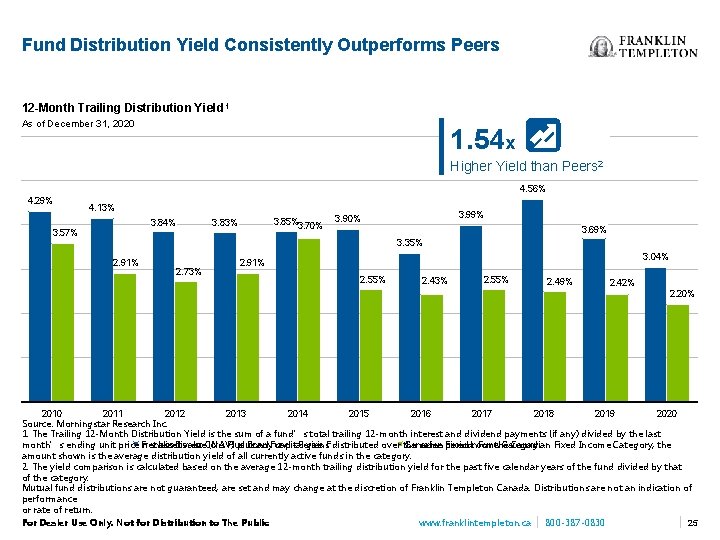
Fund Distribution Yield Consistently Outperforms Peers 12 -Month Trailing Distribution Yield 1 As of December 31, 2020 1. 54 x Higher Yield than Peers 2 4. 56% 4. 29% 4. 13% 3. 84% 3. 85%3. 70% 3. 83% 3. 57% 3. 99% 3. 90% 3. 69% 3. 35% 2. 91% 2. 73% 3. 04% 2. 91% 2. 55% 2. 43% 2. 55% 2. 49% 2. 42% 2. 20% 2010 2011 2012 2013 2014 2015 2016 2017 2018 2019 2020 Source: Morningstar Research Inc. 1. The Trailing 12 -Month Distribution Yield is the sum of a fund’s total trailing 12 -month interest and dividend payments (if any) divided by the last Bissett Plus Bond – Series Canadian Fixed Income Category month’s ending unit price Franklin net asset value. Core (NAV) plus any. Fund capital gains. F distributed over the same period. For the Canadian Fixed Income Category, the amount shown is the average distribution yield of all currently active funds in the category. 2. The yield comparison is calculated based on the average 12 -month trailing distribution yield for the past five calendar years of the fund divided by that of the category. Mutual fund distributions are not guaranteed, are set and may change at the discretion of Franklin Templeton Canada. Distributions are not an indication of performance or rate of return. Only /Not Notfor for. Distributionto to. The. Public 25 For Dealer Use Only. www. franklintempleton. ca 800 -387 -0830

THE NATURE OF THE OPPORTUNITY Only /Not Notfor for. Distributionto to. The. Public For Dealer Use Only. www. franklintempleton. ca 800 -387 -0830
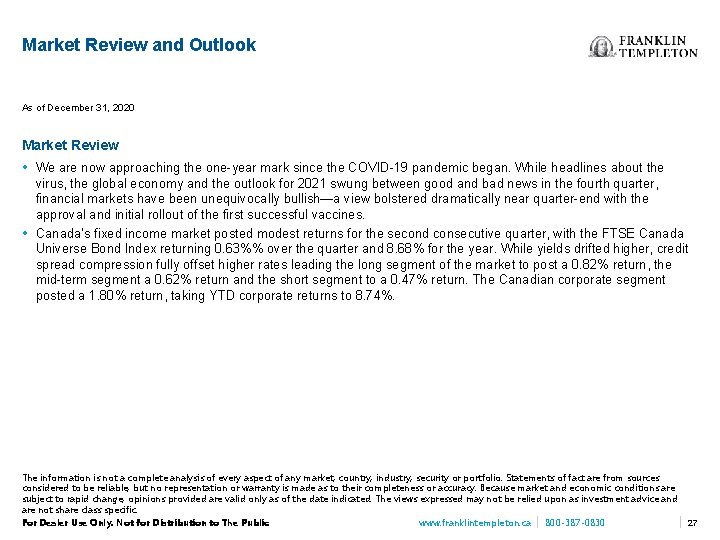
Market Review and Outlook As of December 31, 2020 Market Review • We are now approaching the one-year mark since the COVID-19 pandemic began. While headlines about the virus, the global economy and the outlook for 2021 swung between good and bad news in the fourth quarter, financial markets have been unequivocally bullish―a view bolstered dramatically near quarter-end with the approval and initial rollout of the first successful vaccines. • Canada’s fixed income market posted modest returns for the second consecutive quarter, with the FTSE Canada Universe Bond Index returning 0. 63%% over the quarter and 8. 68% for the year. While yields drifted higher, credit spread compression fully offset higher rates leading the long segment of the market to post a 0. 82% return, the mid-term segment a 0. 62% return and the short segment to a 0. 47% return. The Canadian corporate segment posted a 1. 80% return, taking YTD corporate returns to 8. 74%. The information is not a complete analysis of every aspect of any market, country, industry, security or portfolio. Statements of fact are from sources considered to be reliable, but no representation or warranty is made as to their completeness or accuracy. Because market and economic conditions are subject to rapid change, opinions provided are valid only as of the date indicated. The views expressed may not be relied upon as investment advice and are not share class specific. Only /Not Notfor for. Distributionto to. The. Public For Dealer Use Only. www. franklintempleton. ca 800 -387 -0830 27
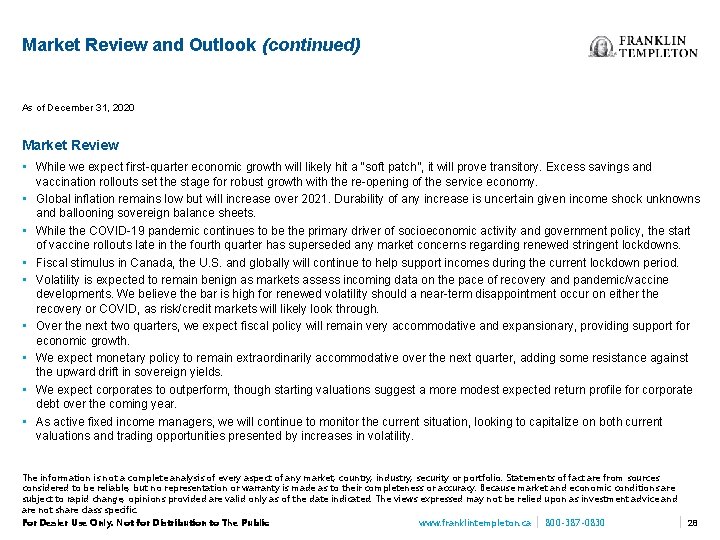
Market Review and Outlook (continued) As of December 31, 2020 Market Review • While we expect first-quarter economic growth will likely hit a “soft patch”, it will prove transitory. Excess savings and • • vaccination rollouts set the stage for robust growth with the re-opening of the service economy. Global inflation remains low but will increase over 2021. Durability of any increase is uncertain given income shock unknowns and ballooning sovereign balance sheets. While the COVID-19 pandemic continues to be the primary driver of socioeconomic activity and government policy, the start of vaccine rollouts late in the fourth quarter has superseded any market concerns regarding renewed stringent lockdowns. Fiscal stimulus in Canada, the U. S. and globally will continue to help support incomes during the current lockdown period. Volatility is expected to remain benign as markets assess incoming data on the pace of recovery and pandemic/vaccine developments. We believe the bar is high for renewed volatility should a near-term disappointment occur on either the recovery or COVID, as risk/credit markets will likely look through. Over the next two quarters, we expect fiscal policy will remain very accommodative and expansionary, providing support for economic growth. We expect monetary policy to remain extraordinarily accommodative over the next quarter, adding some resistance against the upward drift in sovereign yields. We expect corporates to outperform, though starting valuations suggest a more modest expected return profile for corporate debt over the coming year. As active fixed income managers, we will continue to monitor the current situation, looking to capitalize on both current valuations and trading opportunities presented by increases in volatility. The information is not a complete analysis of every aspect of any market, country, industry, security or portfolio. Statements of fact are from sources considered to be reliable, but no representation or warranty is made as to their completeness or accuracy. Because market and economic conditions are subject to rapid change, opinions provided are valid only as of the date indicated. The views expressed may not be relied upon as investment advice and are not share class specific. Only /Not Notfor for. Distributionto to. The. Public For Dealer Use Only. www. franklintempleton. ca 800 -387 -0830 28
APPENDIX Only /Not Notfor for. Distributionto to. The. Public For Dealer Use Only. www. franklintempleton. ca 800 -387 -0830
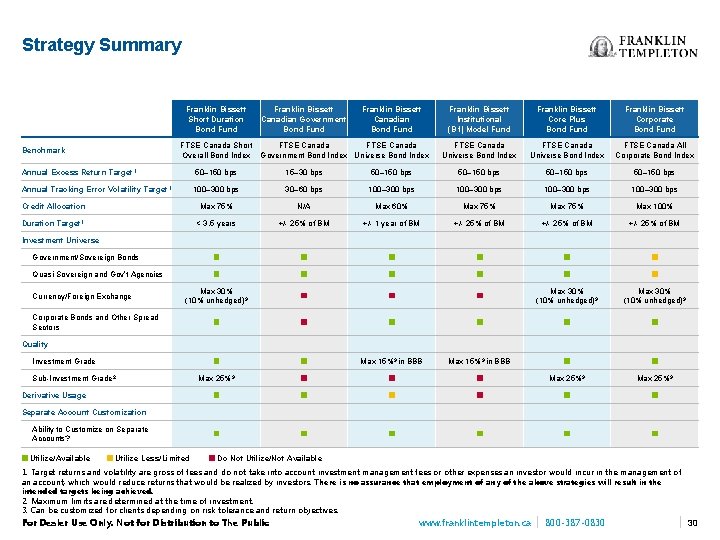
Strategy Summary Franklin Bissett Short Duration Bond Fund FTSE Canada Short Overall Bond Index Benchmark Franklin Bissett Canadian Government Bond Fund Franklin Bissett Canadian Bond Fund FTSE Canada Government Bond Index Universe Bond Index Franklin Bissett Institutional (B 1) Model Fund Franklin Bissett Core Plus Bond Fund Franklin Bissett Corporate Bond Fund FTSE Canada Universe Bond Index FTSE Canada All Corporate Bond Index Annual Excess Return Target 1 50– 150 bps 15– 30 bps 50– 150 bps Annual Tracking Error Volatility Target 1 100– 300 bps 30– 60 bps 100– 300 bps Max 75% N/A Max 60% Max 75% Max 100% < 3. 5 years +/- 25% of BM +/- 1 year of BM +/- 25% of BM Government/Sovereign Bonds Quasi-Sovereign and Gov’t Agencies Max 30% (10% unhedged) 3 Max 15%3 in BBB Credit Allocation Duration Target 1 Investment Universe Currency/Foreign Exchange Corporate Bonds and Other Spread Sectors Quality Investment Grade Sub-Investment Grade 2 Derivative Usage Max 25%3 Separate Account Customization Ability to Customize on Separate Accounts? Utilize/Available Utilize Less/Limited Do Not Utilize/Not Available 1. Target returns and volatility are gross of fees and do not take into account investment management fees or other expenses an investor would incur in the management of an account, which would reduce returns that would be realized by investors. There is no assurance that employment of any of the above strategies will result in the intended targets being achieved. 2. Maximum limits are determined at the time of investment. 3. Can be customized for clients depending on risk tolerance and return objectives. Only /Not Notfor for. Distributionto to. The. Public For Dealer Use Only. www. franklintempleton. ca 800 -387 -0830 30
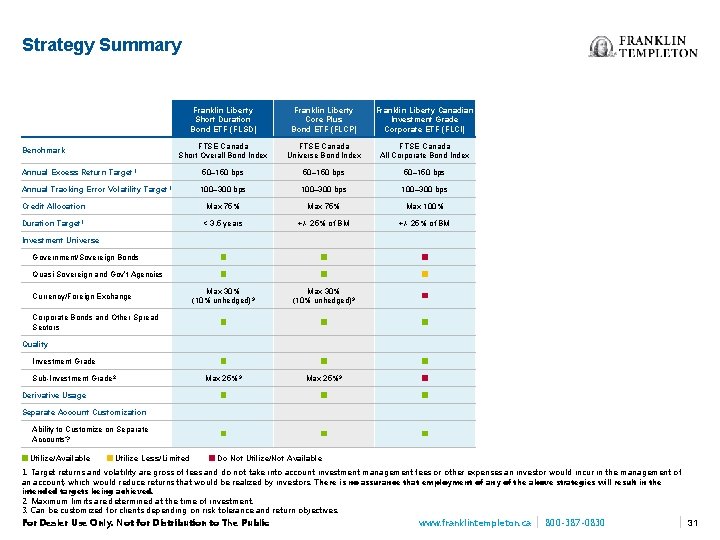
Strategy Summary Franklin Liberty Short Duration Bond ETF (FLSD) Franklin Liberty Core Plus Bond ETF (FLCP) Franklin Liberty Canadian Investment Grade Corporate ETF (FLCI) FTSE Canada Short Overall Bond Index FTSE Canada Universe Bond Index FTSE Canada All Corporate Bond Index Annual Excess Return Target 1 50– 150 bps Annual Tracking Error Volatility Target 1 100– 300 bps Max 75% Max 100% < 3. 5 years +/- 25% of BM Government/Sovereign Bonds Quasi-Sovereign and Gov’t Agencies Max 30% (10% unhedged) 3 Max 25%3 Benchmark Credit Allocation Duration Target 1 Investment Universe Currency/Foreign Exchange Corporate Bonds and Other Spread Sectors Quality Investment Grade Sub-Investment Grade 2 Derivative Usage Separate Account Customization Ability to Customize on Separate Accounts? Utilize/Available Utilize Less/Limited Do Not Utilize/Not Available 1. Target returns and volatility are gross of fees and do not take into account investment management fees or other expenses an investor would incur in the management of an account, which would reduce returns that would be realized by investors. There is no assurance that employment of any of the above strategies will result in the intended targets being achieved. 2. Maximum limits are determined at the time of investment. 3. Can be customized for clients depending on risk tolerance and return objectives. Only /Not Notfor for. Distributionto to. The. Public For Dealer Use Only. www. franklintempleton. ca 800 -387 -0830 31
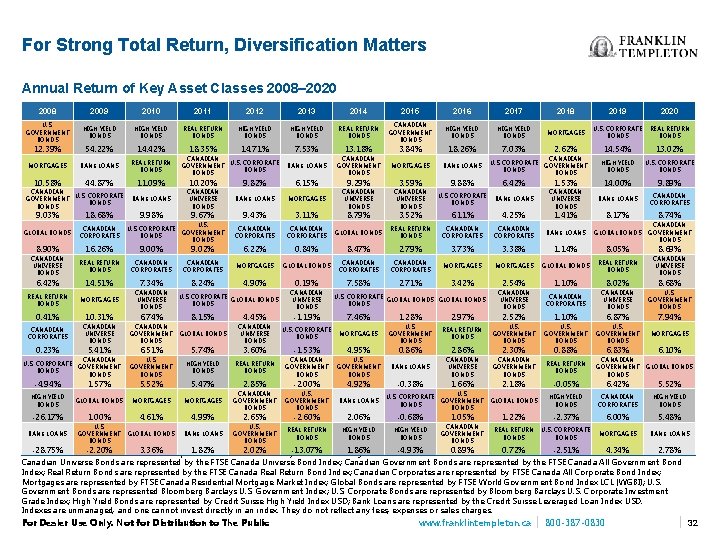
For Strong Total Return, Diversification Matters Annual Return of Key Asset Classes 2008– 2020 2008 2009 2010 2011 2012 2013 2014 2015 2016 2017 2018 2019 2020 REAL RETURN BONDS CANADIAN GOVERNMENT BONDS HIGH YIELD BONDS MORTGAGES U. S. CORPORATE BONDS REAL RETURN BONDS 3. 84% 18. 26% 7. 03% 2. 62% 14. 54% 13. 02% BANK LOANS U. S. CORPORATE BONDS CANADIAN GOVERNMENT BONDS HIGH YIELD BONDS U. S. CORPORATE BONDS 6. 42% 1. 53% 14. 00% 9. 89% BANK LOANS CANADIAN UNIVERSE BONDS BANK LOANS CANADIAN CORPORATES U. S. GOVERNMENT BONDS HIGH YIELD BONDS 12. 39% 54. 22% 14. 42% MORTGAGES BANK LOANS REAL RETURN BONDS 10. 58% 44. 87% 11. 09% 10. 20% BANK LOANS CANADIAN UNIVERSE BONDS BANK LOANS 9. 67% 9. 43% 3. 11% U. S. GOVERNMENT BONDS CANADIAN CORPORATES 6. 22% 0. 84% GLOBAL BONDS 7. 58% CANADIAN U. S. CORPORATE GOVERNMENT BONDS HIGH YIELD BONDS 9. 03% 18. 68% 9. 98% GLOBAL BONDS CANADIAN CORPORATES U. S. CORPORATE BONDS REAL RETURN BONDS HIGH YIELD BONDS 18. 35% 14. 71% 7. 53% 13. 18% BANK LOANS CANADIAN GOVERNMENT BONDS CANADIAN U. S. CORPORATE GOVERNMENT BONDS 9. 82% 8. 90% 16. 26% 9. 00% 9. 02% CANADIAN UNIVERSE BONDS REAL RETURN BONDS CANADIAN CORPORATES MORTGAGES 6. 42% 14. 51% 7. 34% 8. 24% 4. 90% MORTGAGES CANADIAN UNIVERSE BONDS REAL RETURN BONDS 0. 41% 10. 31% 6. 74% CANADIAN CORPORATES CANADIAN UNIVERSE BONDS CANADIAN GOVERNMENT BONDS U. S. CORPORATE GLOBAL BONDS 8. 15% 4. 45% GLOBAL BONDS CANADIAN UNIVERSE BONDS MORTGAGES 6. 15% 9. 29% 3. 59% 9. 88% MORTGAGES CANADIAN UNIVERSE BONDS U. S. CORPORATE BONDS 3. 52% 6. 11% 4. 25% GLOBAL BONDS REAL RETURN BONDS CANADIAN CORPORATES BANK LOANS 8. 47% 2. 79% 3. 73% 3. 38% 1. 14% 8. 05% 8. 69% CANADIAN CORPORATES MORTGAGES GLOBAL BONDS REAL RETURN BONDS CANADIAN UNIVERSE BONDS 2. 71% 3. 42% 0. 19% CANADIAN UNIVERSE BONDS -1. 19% 8. 79% MORTGAGES 1. 41% 8. 17% 8. 74% GLOBAL BONDS CANADIAN GOVERNMENT BONDS 2. 54% 1. 10% 8. 02% 8. 68% CANADIAN UNIVERSE BONDS CANADIAN CORPORATES CANADIAN UNIVERSE BONDS U. S. GOVERNMENT BONDS 2. 97% 2. 52% 1. 10% 6. 87% 7. 94% REAL RETURN BONDS U. S. GOVERNMENT BONDS MORTGAGES U. S. CORPORATE GLOBAL BONDS 7. 46% 1. 28% U. S. CORPORATE BONDS MORTGAGES U. S. GOVERNMENT BONDS 0. 86% 2. 30% 0. 88% 6. 83% 6. 10% BANK LOANS CANADIAN UNIVERSE BONDS CANADIAN GOVERNMENT BONDS REAL RETURN BONDS CANADIAN GOVERNMENT BONDS GLOBAL BONDS 2. 18% -0. 05% 6. 42% 5. 52% GLOBAL BONDS HIGH YIELD BONDS CANADIAN CORPORATES HIGH YIELD BONDS 0. 23% 5. 41% 6. 51% 5. 74% 3. 60% -1. 53% 4. 95% U. S. CORPORATE BONDS CANADIAN GOVERNMENT BONDS U. S. GOVERNMENT BONDS HIGH YIELD BONDS REAL RETURN BONDS CANADIAN GOVERNMENT BONDS U. S. GOVERNMENT BONDS -4. 94% 1. 57% 5. 52% 5. 47% 2. 85% -2. 00% 4. 92% -0. 38% 1. 66% U. S. GOVERNMENT BONDS BANK LOANS U. S. CORPORATE BONDS U. S. GOVERNMENT BONDS HIGH YIELD BONDS GLOBAL BONDS MORTGAGES CANADIAN GOVERNMENT BONDS -26. 17% 1. 00% 4. 61% 4. 99% 2. 65% -2. 60% 2. 06% -0. 68% 1. 05% 1. 22% -2. 37% 6. 00% 5. 48% BANK LOANS U. S. GOVERNMENT BONDS REAL RETURN BONDS HIGH YIELD BONDS CANADIAN GOVERNMENT BONDS REAL RETURN BONDS U. S. CORPORATE BONDS MORTGAGES BANK LOANS GLOBAL BONDS 3. 36% 1. 82%in their base 2. 02% -13. 07% 1. 86% Direct -4. 93% 0. 89% 0. 72% -2. 51% 4. 34% 2. 78% All -28. 75% non-Canadian-2. 20% sectors’ returns are expressed currency. Source: Morningstar and API. Canadian Universe Bonds are represented by the FTSE Canada Universe Bond Index; Canadian Government Bonds are represented by the FTSE Canada All Government Bond Index; Real Return Bonds are represented by the FTSE Canada Real Return Bond Index; Canadian Corporates are represented by FTSE Canada All Corporate Bond Index; Mortgages are represented by FTSE Canada Residential Mortgage Market Index; Global Bonds are represented by FTSE World Government Bond Index LCL (WGBI); U. S. Government Bonds are represented Bloomberg Barclays U. S. Government Index; U. S. Corporate Bonds are represented by Bloomberg Barclays U. S. Corporate Investment Grade Index; High Yield Bonds are represented by Credit Suisse High Yield Index USD; Bank Loans are represented by the Credit Suisse Leveraged Loan Index USD. Indexes are unmanaged, and one cannot invest directly in an index. They do not reflect any fees, expenses or sales charges. Only /Not Notfor for. Distributionto to. The. Public For Dealer Use Only. www. franklintempleton. ca 800 -387 -0830 32
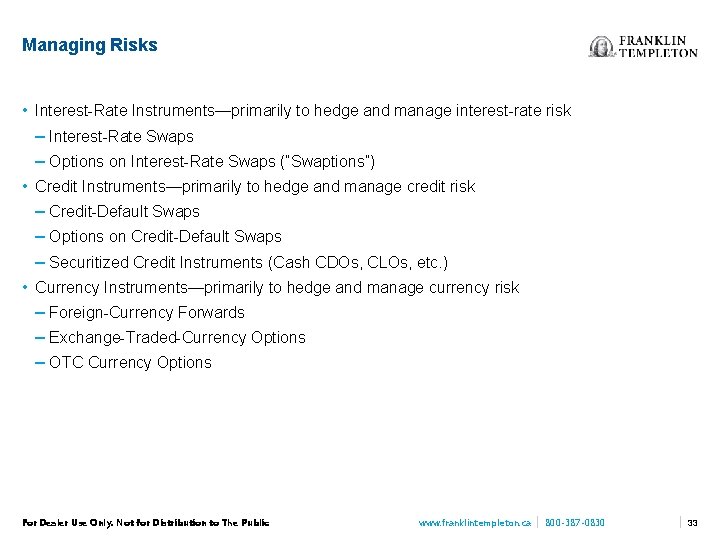
Managing Risks • Interest-Rate Instruments—primarily to hedge and manage interest-rate risk – Interest-Rate Swaps – Options on Interest-Rate Swaps (“Swaptions”) • Credit Instruments—primarily to hedge and manage credit risk – Credit-Default Swaps – Options on Credit-Default Swaps – Securitized Credit Instruments (Cash CDOs, CLOs, etc. ) • Currency Instruments—primarily to hedge and manage currency risk – Foreign-Currency Forwards – Exchange-Traded-Currency Options – OTC Currency Options Only /Not Notfor for. Distributionto to. The. Public For Dealer Use Only. www. franklintempleton. ca 800 -387 -0830 33
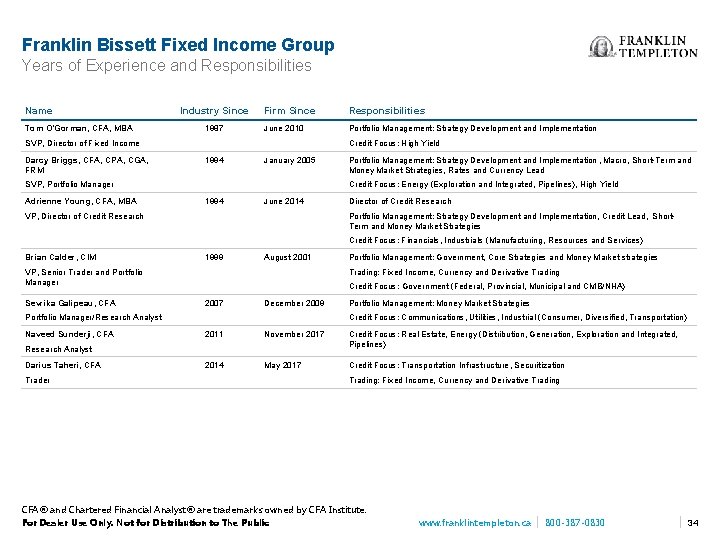
Franklin Bissett Fixed Income Group Years of Experience and Responsibilities Name Tom O’Gorman, CFA, MBA Industry Since 1987 Firm Since Responsibilities June 2010 Portfolio Management: Strategy Development and Implementation SVP, Director of Fixed Income Darcy Briggs, CFA, CPA, CGA, FRM Credit Focus: High Yield 1994 January 2005 SVP, Portfolio Manager Adrienne Young, CFA, MBA Portfolio Management: Strategy Development and Implementation , Macro, Short-Term and Money Market Strategies, Rates and Currency Lead Credit Focus: Energy (Exploration and Integrated, Pipelines), High Yield 1994 June 2014 VP, Director of Credit Research Portfolio Management: Strategy Development and Implementation, Credit Lead, Short. Term and Money Market Strategies Credit Focus: Financials, Industrials (Manufacturing, Resources and Services) Brian Calder, CIM 1999 August 2001 VP, Senior Trader and Portfolio Manager Sevrika Galipeau, CFA Trading: Fixed Income, Currency and Derivative Trading Credit Focus: Government (Federal, Provincial, Municipal and CMB/NHA) 2007 December 2009 Portfolio Manager/Research Analyst Naveed Sunderji, CFA Trader Portfolio Management: Money Market Strategies Credit Focus: Communications, Utilities, Industrial (Consumer, Diversified, Transportation) 2011 November 2017 Credit Focus: Real Estate, Energy (Distribution, Generation, Exploration and Integrated, Pipelines) 2014 May 2017 Credit Focus: Transportation Infrastructure, Securitization Research Analyst Darius Taheri, CFA Portfolio Management: Government, Core Strategies and Money Market strategies Trading: Fixed Income, Currency and Derivative Trading CFA® and Chartered Financial Analyst® are trademarks owned by CFA Institute. Only /Not Notfor for. Distributionto to. The. Public For Dealer Use Only. www. franklintempleton. ca 800 -387 -0830 34
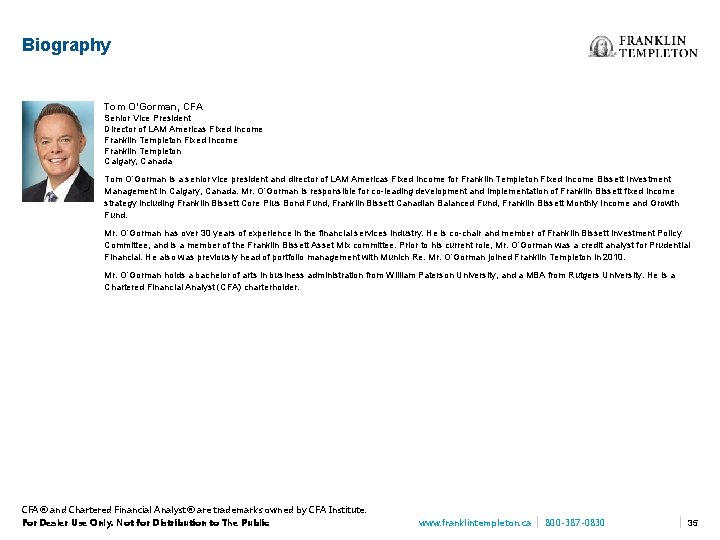
Biography Tom O’Gorman, CFA Senior Vice President Director of LAM Americas Fixed Income Franklin Templeton Calgary, Canada Tom O’Gorman is a senior vice president and director of LAM Americas Fixed Income for Franklin Templeton Fixed Income Bissett Investment Management in Calgary, Canada. Mr. O’Gorman is responsible for co-leading development and implementation of Franklin Bissett fixed income strategy including Franklin Bissett Core Plus Bond Fund, Franklin Bissett Canadian Balanced Fund, Franklin Bissett Monthly Income and Growth Fund. Mr. O’Gorman has over 30 years of experience in the financial services industry. He is co-chair and member of Franklin Bissett Investment Policy Committee, and is a member of the Franklin Bissett Asset Mix committee. Prior to his current role, Mr. O’Gorman was a credit analyst for Prudential Financial. He also was previously head of portfolio management with Munich Re. Mr. O’Gorman joined Franklin Templeton in 2010. Mr. O’Gorman holds a bachelor of arts in business administration from William Paterson University, and a MBA from Rutgers University. He is a Chartered Financial Analyst (CFA) charterholder. CFA® and Chartered Financial Analyst® are trademarks owned by CFA Institute. Only /Not Notfor for. Distributionto to. The. Public For Dealer Use Only. www. franklintempleton. ca 800 -387 -0830 35
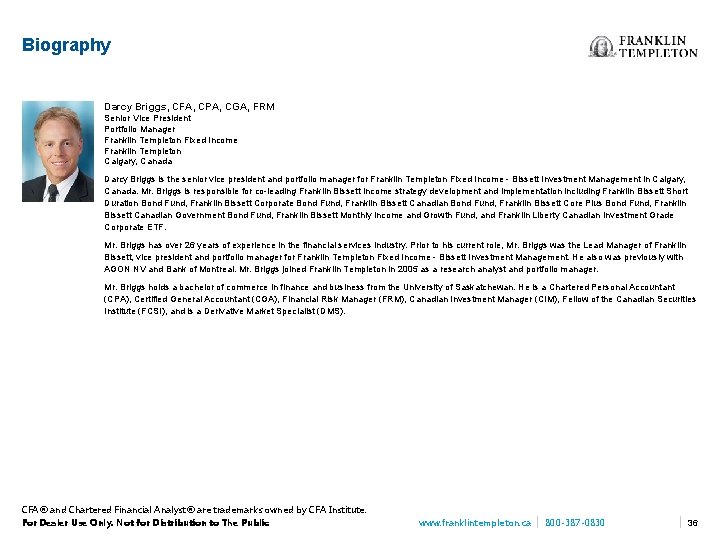
Biography Darcy Briggs, CFA, CPA, CGA, FRM Senior Vice President Portfolio Manager Franklin Templeton Fixed Income Franklin Templeton Calgary, Canada Darcy Briggs is the senior vice president and portfolio manager for Franklin Templeton Fixed Income - Bissett Investment Management in Calgary, Canada. Mr. Briggs is responsible for co-leading Franklin Bissett Income strategy development and implementation including Franklin Bissett Short Duration Bond Fund, Franklin Bissett Corporate Bond Fund, Franklin Bissett Canadian Bond Fund, Franklin Bissett Core Plus Bond Fund, Franklin Bissett Canadian Government Bond Fund, Franklin Bissett Monthly Income and Growth Fund, and Franklin Liberty Canadian Investment Grade Corporate ETF. Mr. Briggs has over 26 years of experience in the financial services industry. Prior to his current role, Mr. Briggs was the Lead Manager of Franklin Bissett, vice president and portfolio manager for Franklin Templeton Fixed Income - Bissett Investment Management. He also was previously with AGON NV and Bank of Montreal. Mr. Briggs joined Franklin Templeton in 2005 as a research analyst and portfolio manager. Mr. Briggs holds a bachelor of commerce in finance and business from the University of Saskatchewan. He is a Chartered Personal Accountant (CPA), Certified General Accountant (CGA), Financial Risk Manager (FRM), Canadian Investment Manager (CIM), Fellow of the Canadian Securities Institute (FCSI), and is a Derivative Market Specialist (DMS). CFA® and Chartered Financial Analyst® are trademarks owned by CFA Institute. Only /Not Notfor for. Distributionto to. The. Public For Dealer Use Only. www. franklintempleton. ca 800 -387 -0830 36
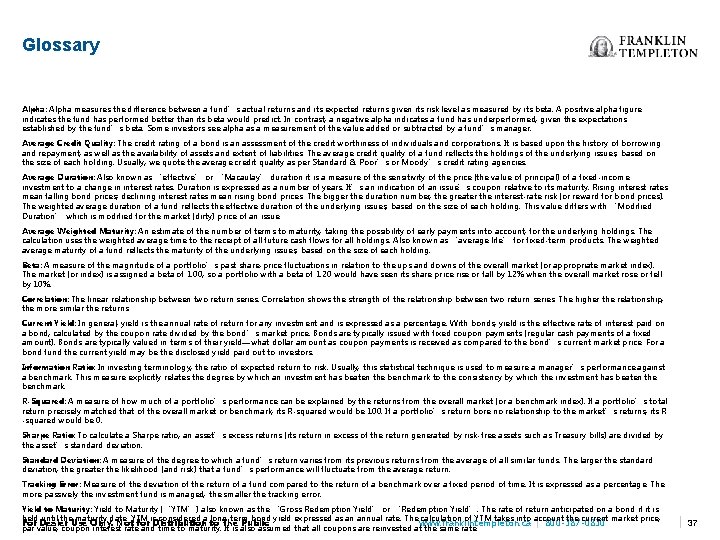
Glossary Alpha: Alpha measures the difference between a fund’s actual returns and its expected returns given its risk level as measured by its beta. A positive alpha figure indicates the fund has performed better than its beta would predict. In contrast, a negative alpha indicates a fund has underperformed, given the expectations established by the fund’s beta. Some investors see alpha as a measurement of the value added or subtracted by a fund’s manager. Average Credit Quality: The credit rating of a bond is an assessment of the credit worthiness of individuals and corporations. It is based upon the history of borrowing and repayment, as well as the availability of assets and extent of liabilities. The average credit quality of a fund reflects the holdings of the underlying issues, based on the size of each holding. Usually, we quote the average credit quality as per Standard & Poor’s or Moody’s credit rating agencies. Average Duration: Also known as ‘effective’ or ‘Macaulay’ duration it is a measure of the sensitivity of the price (the value of principal) of a fixed-income investment to a change in interest rates. Duration is expressed as a number of years. It’s an indication of an issue’s coupon relative to its maturity. Rising interest rates mean falling bond prices; declining interest rates mean rising bond prices. The bigger the duration number, the greater the interest-rate risk (or reward for bond prices). The weighted average duration of a fund reflects the effective duration of the underlying issues, based on the size of each holding. This value differs with ‘Modified Duration’ which is modified for the market (dirty) price of an issue. Average Weighted Maturity: An estimate of the number of terms to maturity, taking the possibility of early payments into account, for the underlying holdings. The calculation uses the weighted average time to the receipt of all future cash flows for all holdings. Also known as ‘average life’ for fixed-term products. The weighted average maturity of a fund reflects the maturity of the underlying issues, based on the size of each holding. Beta: A measure of the magnitude of a portfolio’s past share-price fluctuations in relation to the ups and downs of the overall market (or appropriate market index). The market (or index) is assigned a beta of 1. 00, so a portfolio with a beta of 1. 20 would have seen its share price rise or fall by 12% when the overall market rose or fell by 10%. Correlation: The linear relationship between two return series. Correlation shows the strength of the relationship between two return series. The higher the relationship, the more similar the returns. Current Yield: In general, yield is the annual rate of return for any investment and is expressed as a percentage. With bonds, yield is the effective rate of interest paid on a bond, calculated by the coupon rate divided by the bond’s market price. Bonds are typically issued with fixed coupon payments (regular cash payments of a fixed amount). Bonds are typically valued in terms of their yield—what dollar amount as coupon payments is received as compared to the bond’s current market price. For a bond fund the current yield may be the disclosed yield paid out to investors. Information Ratio: In investing terminology, the ratio of expected return to risk. Usually, this statistical technique is used to measure a manager’s performance against a benchmark. This measure explicitly relates the degree by which an investment has beaten the benchmark to the consistency by which the investment has beaten the benchmark. R-Squared: A measure of how much of a portfolio’s performance can be explained by the returns from the overall market (or a benchmark index). If a portfolio’s total return precisely matched that of the overall market or benchmark, its R-squared would be 100. If a portfolio’s return bore no relationship to the market’s returns, its R -squared would be 0. Sharpe Ratio: To calculate a Sharpe ratio, an asset’s excess returns (its return in excess of the return generated by risk-free assets such as Treasury bills) are divided by the asset’s standard deviation. Standard Deviation: A measure of the degree to which a fund’s return varies from its previous returns from the average of all similar funds. The larger the standard deviation, the greater the likelihood (and risk) that a fund’s performance will fluctuate from the average return. Tracking Error: Measure of the deviation of the return of a fund compared to the return of a benchmark over a fixed period of time. It is expressed as a percentage. The more passively the investment fund is managed, the smaller the tracking error. Yield to Maturity: Yield to Maturity (‘YTM’) also known as the ‘Gross Redemption Yield’ or ‘Redemption Yield’. The rate of return anticipated on a bond if it is held until the maturity YTM considered a long-term bond yield expressed as an annual rate. The calculation of YTM takes into account the current market price, Onlydate. /Not foris. Distribution to. The. Public For Dealer Use Only. for to www. franklintempleton. ca 800 -387 -0830 par value, coupon interest rate and time to maturity. It is also assumed that all coupons are reinvested at the same rate. 37
Important Disclosures The information presented is considered reliable at the present time; however, we do not represent that it is accurate or complete, or that it should be relied upon as such. Speculation or stated beliefs about future events, such as market or economic conditions, company or security performance, upcoming product offerings or other projections represent the beliefs of the speaker and do not necessarily represent the views of Franklin Templeton. General business, market, economic and political conditions could cause actual results to differ materially. The information presented is not a recommendation or solicitation to buy or sell securities. Commissions, trailing commissions, management fees and expenses all may be associated with mutual fund investments. Please read the prospectus or fund facts document before investing. The indicated rates of return are historical annual compounded total returns including changes in unit value and reinvestment of all distributions and do not take into account sales, redemption, distribution or optional charges or income taxes payable by any securityholder that would have reduced returns. Mutual funds are not guaranteed, their values change frequently and past performance may not be repeated. Series F is available to investors participating in programs that do not require Franklin Templeton to incur distribution costs in the form of trailing commissions to dealers. As a consequence, the management fee on Series F is lower than on Series A. The gross of fees version of Series F does not exist and as a result, investors cannot purchase Series F securities on a gross of fees basis. Performance would have been lower with fees taken into account. Indexes are unmanaged, and one cannot invest directly in an index. They do not reflect any fees, expenses or sales charges. © 2021 Franklin Templeton. All rights reserved. Franklin Templeton Canada is a business name used by Franklin Templeton Investments Corp. CFA® and Chartered Financial Analyst® are trademarks owned by CFA Institute. STANDARD & POOR’S®, S&P® and S&P 500® are registered trademarks of Standard & Poor’s Financial Services LLC. Standard & Poor’s does not sponsor, endorse, sell or promote any S&P index-based product. Only /Not Notfor for. Distributionto to. The. Public For Dealer Use Only. www. franklintempleton. ca 800 -387 -0830 38
Important Disclosures (continued) Additional Information for the Performance Statistics Slides: As of December 31, 2020. © 2021 Morningstar. All Rights Reserved. The information contained herein: (1) is proprietary to Morningstar and/or its content providers; (2) may not be copied or distributed; and (3) is not warranted to be accurate, complete or timely. Neither Morningstar nor its content providers are responsible for any damages or losses arising from any use of this information. Past performance is no guarantee of future results. The Morningstar Rating™ for funds, or “star rating”, is calculated for managed products (including mutual funds, variable annuity and variable life subaccounts, exchange-traded funds, closed-end funds, and separate accounts) with at least a three-year history. Exchange-traded funds and open-ended mutual funds are considered a single population for comparative purposes. It is calculated based on a Morningstar Risk-Adjusted Return measure that accounts for variation in a managed product's monthly excess performance, placing more emphasis on downward variations and rewarding consistent performance. The top 10% of products in each product category receive 5 stars, the next 22. 5% receive 4 stars, the next 35% receive 3 stars, the next 22. 5% receive 2 stars, and the bottom 10% receive 1 star. The Overall Morningstar Rating for a managed product is derived from a weighted average of the performance figures associated with its three-, five- and 10 -year (if applicable) Morningstar Ratings metrics. The weights are 100% three-year rating for 36 -59 months of total returns, 60% five-year rating/40% three-year rating for 60– 119 months of total returns, and 50% 10 -year rating/30% five-year rating/20% three-year rating for 120 or more months of total returns. While the 10 -year overall star rating formula seems to give the most weight to the 10 -year period, the most recent three-year period actually has the greatest impact because it is included in all three rating periods. Franklin Bissett Core Plus Bond Fund is rated within the Morningstar Canadian Fixed Income category. All performance data refers to Series F units. Please refer to www. morningstar. ca for more details on the calculation of Morningstar Risk-Adjusted Ratings and the one-year information. For each of the three-, five- and 10 -year performance periods, there were in total 446, 355 and 181 funds, respectively, in the Morningstar Canadian Fixed Income category. Additional Information for the Uncertain Rate Environment Slide: Index definitions: Sovereigns, Citi World Government Bond Index (USD); U. S. Government Bonds, Bloomberg Barclays U. S Government Bonds TR Index (USD); Canadian Government Bonds, FTSE Canada All Government Bond Index; Canadian Bond Universe, FTSE Canada Universe Bond Index; U. S. Investment-Grade Corporate Bonds, Bloomberg Barclays U. S. Credit TR Index (USD); Canadian Mortgage-Backed Securities: FTSE Canada Residential Mortgage Market Index; Canadian Corporate Bonds, FTSE Canada All Corporate Bond Index; G 7 Sovereign Bonds, Bloomberg Barclays Global G 7 TR Index (USD); Canadian Provincial & Municipal Bonds, Bo. A Merrill Lynch Canadian Provincial & Municipal Bond TR Index; Canadian Real Return Bonds, FTSE Canada Real Return Bond Index; High Yield Bonds, Credit Suisse High Yield Index (USD); Emerging Markets Sovereign Debt, Bloomberg Barclays Emerging Market Aggregate TR Index (USD); Canadian 91 -Day Treasury Bills: FTSE Canada 91 -Day T-Bill Index; Bank Loans, Credit Suisse Leveraged Loan Index (USD). Only /Not Notfor for. Distributionto to. The. Public For Dealer Use Only. www. franklintempleton. ca 800 -387 -0830 39
Franklin Templeton Gain From Our Perspective® Franklin Templeton is a global leader in investment management with clients in over 170 countries. Here in Canada and abroad, we're dedicated to one goal: delivering exceptional asset management for our clients. At the core of our success are multiple independent investment teams—each with a focused area of expertise—from traditional to active quant, alternative strategies, multi-asset solutions and Active and Strategic Beta ETFs. All of these teams share a common commitment to excellence grounded in rigorous, fundamental research and robust, disciplined risk management. We combine our expertise in Canada with extensive global resources, and a focus on excellence. As a result, we've become a trusted partner to generations of advisors and investors. Founding Member of The Canadian Coalition for Good Governance. Canadian offices: CALGARY • MONTREAL • TORONTO U. S. offices: FT. LAUDERDALE • FORT LEE • LOS ANGELES • MIAMI • NEW YORK CITY • NORWALK • RANCHO CORDOVA • SALT LAKE CITY • SAN MATEO • SHORT HILLS • ST. PETERSBURG • WASHINGTON D. C. • WILMINGTON International offices: ABU DHABI • AMSTERDAM • BEIJING • BRUSSELS • BUENOS AIRES • CAPE TOWN • CARACAS • CHENNAI • DUBLIN • EDINBURGH • FRANKFURT • GENEVA • HONG KONG • HYDERABAD ISTANBUL • JOHANNESBURG • LONDON • LUXEMBOURG • MADRID • MELBOURNE • MEXICO CITY • MILAN • MUMBAI • NASSAU • PARIS • POZNAN • RIO DE JANEIRO • SAO PAULO • SEOUL • SHANGHAI SINGAPORE • STOCKHOLM • SYDNEY • TAIPEI • TOKYO • VIENNA • WARSAW • ZURICH NYSE: BEN Franklin Templeton Canada is a business name used by Franklin Templeton Investments Corp. Franklin Templeton Canada 200 King Street West, Suite 1500 Toronto, Ontario, M 5 H 3 T 4 Client Services Toll-free: 1. 800. 387. 0830 Fax: 1. 866. 850. 8241 Sales Team Toll-free: 1. 800. 897. 7286 Fax: 416. 364. 1320 (800) 387 -0830 www. franklintempleton. ca © 2021 Franklin Templeton. All rights reserved. For Dealer Use Only / Not for Distribution to The Public 2545_CAN_CAD_SERIES F
- Slides: 40