
Methods for Gene Activity Analysis By Auni Hovanesian

Methods for Gene Activity Analysis By Auni Hovanesian Krista Templeton
What Methods Can We Use to Study Gene Expression? • Three Basic Approaches: 1) RT-PCR 2) Gene. Chip Microarray 3) Upstream Regulatory Region Analysis
What Is The Basis of RT-PCR Activity Analysis? m. RNA! • m. RNA is only present in cells for genes that have been transcribed and will usually be actively expressed once translated into proteins • RT-PCR links gene expression to m. RNA presence in different compartments of plant • But in order to trace m. RNA back to an original gene, must amplify sample, since often only small amounts present
Why RT-PCR Rather Than Regular PCR? • m. RNA will not work in our PCR reaction, so need to convert it to c. DNA – reagents being used in PCR are DNA-specific (i. e. DNA polymerase) • DNA is more stable than RNA – More practical for long-term storage purposes – RNA’s instability would give lower yield in PCR
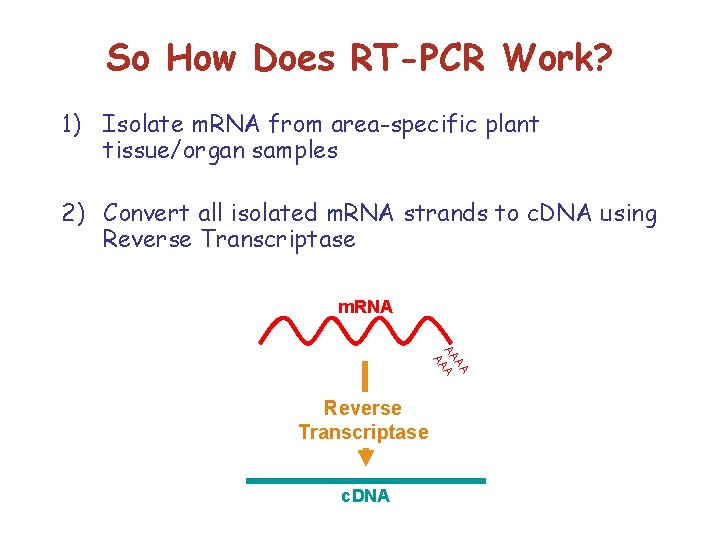
So How Does RT-PCR Work? 1) Isolate m. RNA from area-specific plant tissue/organ samples 2) Convert all isolated m. RNA strands to c. DNA using Reverse Transcriptase m. RNA AA AA Reverse Transcriptase c. DNA
3) Use first c. DNA template as now compatible basis of PCR: • Only need to synthesize a single strand of c. DNA template to start PCR – One c. DNA representing every m. RNA in each sample--like gene expression library – PCR is like selection of a particular gene from the library (if it is there!) • Gene-specific primers designed in exons (due m. RNA splicing) • If PCR product formed with gene-specific primers for RT-PCR, will have amplified the c. DNA correlate of original gene – Indicates presence of m. RNA correlating to gene of interest – Helps localize gene activity to wherever sample came from
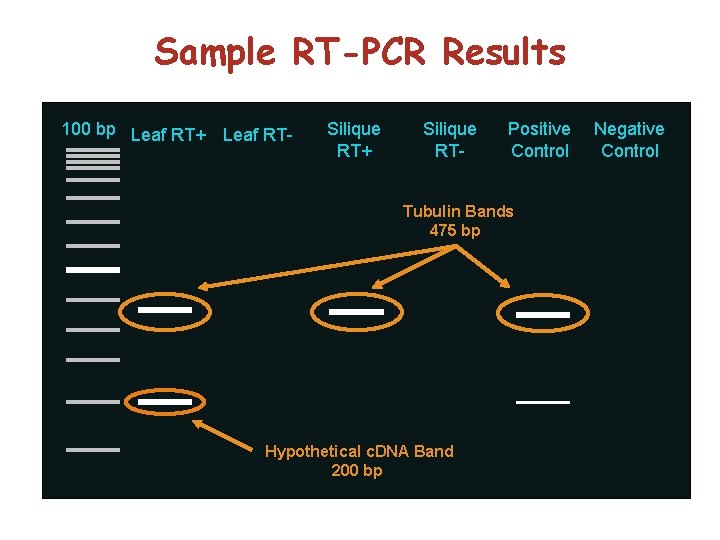
Sample RT-PCR Results 100 bp Leaf RT+ Leaf RT- Silique RT+ Silique RT- Positive Control Tubulin Bands 475 bp Hypothetical c. DNA Band 200 bp Negative Control
So How Do We Verify and Further Specify RT-PCR Results? Gene. Chip Microarray Analysis!
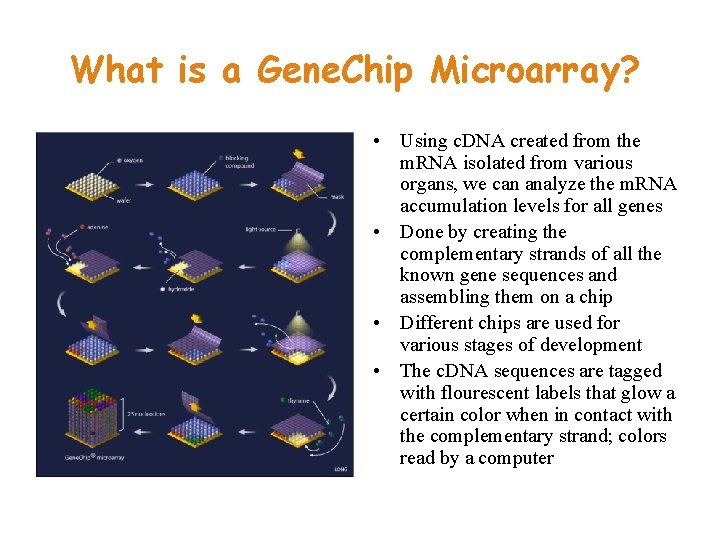
What is a Gene. Chip Microarray? • Using c. DNA created from the m. RNA isolated from various organs, we can analyze the m. RNA accumulation levels for all genes • Done by creating the complementary strands of all the known gene sequences and assembling them on a chip • Different chips are used for various stages of development • The c. DNA sequences are tagged with flourescent labels that glow a certain color when in contact with the complementary strand; colors read by a computer
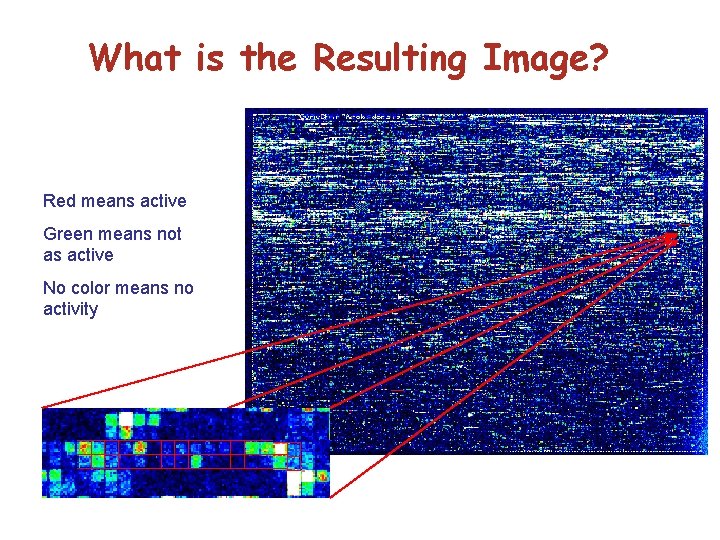
What is the Resulting Image? Red means active Green means not as active No color means no activity

What Does the Online Gene. Chip Report Look Like?
So, How Do RT-PCR and Gene. Chips Complement Each Other? • RT-PCR may be slightly more accurate, since working with smaller fragments (only portions of c. DNA) • But Gene. Chips provide more specificity more efficiently • The two combined provide convenient checkpoints for each other’s results – both working with same principle of m. RNA level analysis to determine gene expression
What Is Another Method of Gene Expression Analysis?

Upstream Region Analysis
Overview • The upstream regulatory region of a gene contains its “on” switch. • Once the upstream region is fused to GFP (green fluorescent protein) or GUS (betaglucuronidase) it can be transformed into the Arabidopsis plant • Once transformation has occurred gene expression will indicate where the gene of interest is transcribed.
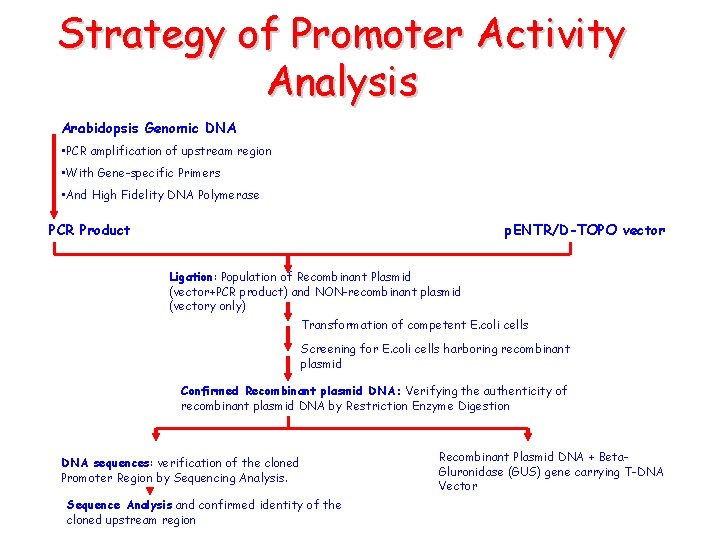
Strategy of Promoter Activity Analysis Arabidopsis Genomic DNA • PCR amplification of upstream region • With Gene-specific Primers • And High Fidelity DNA Polymerase PCR Product p. ENTR/D-TOPO vector Ligation: Population of Recombinant Plasmid (vector+PCR product) and NON-recombinant plasmid (vectory only) Transformation of competent E. coli cells Screening for E. coli cells harboring recombinant plasmid Confirmed Recombinant plasmid DNA: Verifying the authenticity of recombinant plasmid DNA by Restriction Enzyme Digestion DNA sequences: verification of the cloned Promoter Region by Sequencing Analysis. Sequence Analysis and confirmed identity of the cloned upstream region Recombinant Plasmid DNA + Beta. Gluronidase (GUS) gene carrying T-DNA Vector
What Are the Steps Required to Isolate the Promoter Region? • Conduct PCR on the Arabidopsis DNA in order to amplify the upstream region with i. Proof polymerase
Why Use a Proofreading Polymerase? • i. Proof polymerase corrects nucleotide errors during amplification • One mutation could affect the transcription of a gene
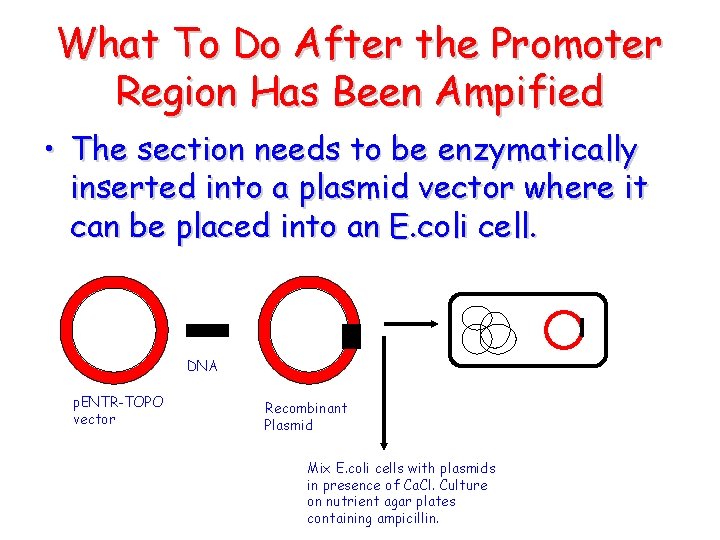
What To Do After the Promoter Region Has Been Ampified • The section needs to be enzymatically inserted into a plasmid vector where it can be placed into an E. coli cell. DNA p. ENTR-TOPO vector Recombinant Plasmid Mix E. coli cells with plasmids in presence of Ca. Cl. Culture on nutrient agar plates containing ampicillin.
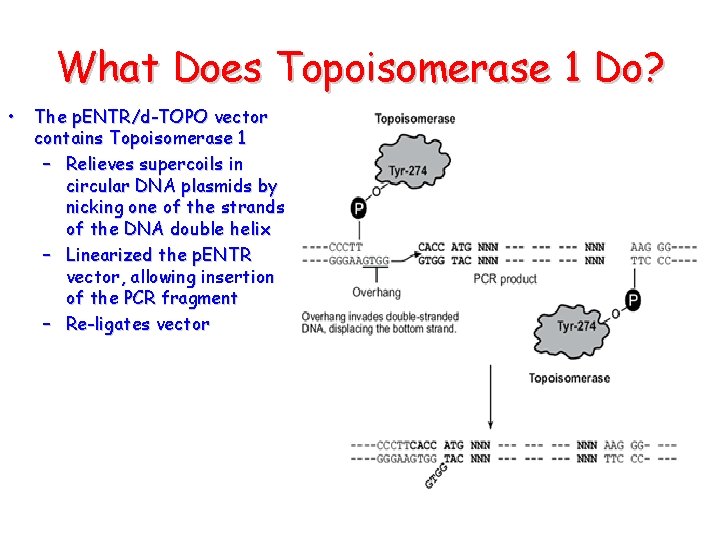
What Does Topoisomerase 1 Do? • The p. ENTR/d-TOPO vector contains Topoisomerase 1 – Relieves supercoils in circular DNA plasmids by nicking one of the strands of the DNA double helix – Linearized the p. ENTR vector, allowing insertion of the PCR fragment – Re-ligates vector

How Do GUS and GFP Work and What Are Their Differences? • A mature Arabidopsis embryo expressing Green Fluorescent Protein GUS is the more sensitive of the two Common Reporter Genes • GUS and GFP connect to the promoter region. When the genes are turned on through the promoter region GUS and GFP are turned on also

Acknowledgements • Jordan, Jennifer, and Brian from Spring 2006 for some useful slide ideas and diagrams • Kelli for her presentation on Upstream Region Analysis • Brandon for all his tech support! • Anhthu, Bekah, and Daisy for their help and many explanations
- Slides: 22