FINANCIAL STATEMENT ANALYSIS VALUATION EASTON Mc ANALLY 5




- Slides: 53
FINANCIAL STATEMENT ANALYSIS VALUATION & EASTON Mc. ANALLY 5 e SOMMERS ZHANG MODULE 6 Asset Recognition and Operating Assets © Cambridge Business Publishers, 2018
Learning Objective 1 Apply inventory costing methods. © Cambridge Business Publishers, 2018 2
Flow of Inventory Costs § When inventory is purchased or produced, it is capitalized. § When the inventory is sold, its cost is transferred from the balance sheet to the income statement as an expense (cost of goods sold). § If higher cost units are transferred from the balance sheet, then cost of goods sold is higher and gross profit (sales less cost of goods sold) is lower. § If lower cost units are transferred to cost of goods sold, gross profit is higher. © Cambridge Business Publishers, 2018 3
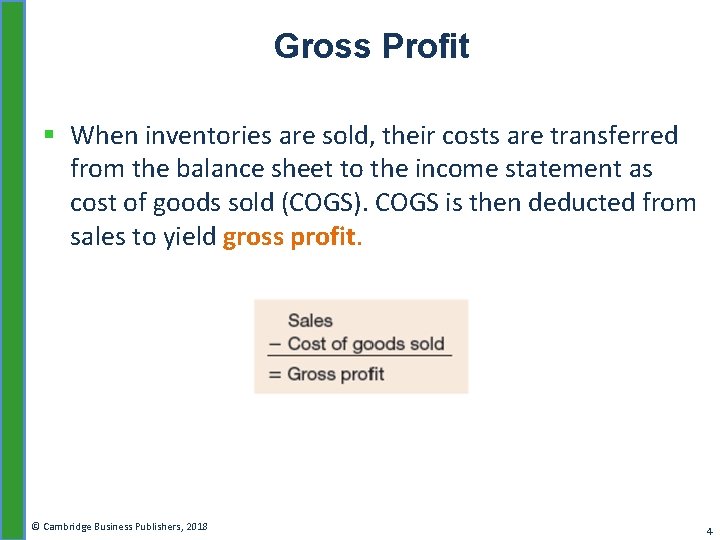
Gross Profit § When inventories are sold, their costs are transferred from the balance sheet to the income statement as cost of goods sold (COGS). COGS is then deducted from sales to yield gross profit. © Cambridge Business Publishers, 2018 4
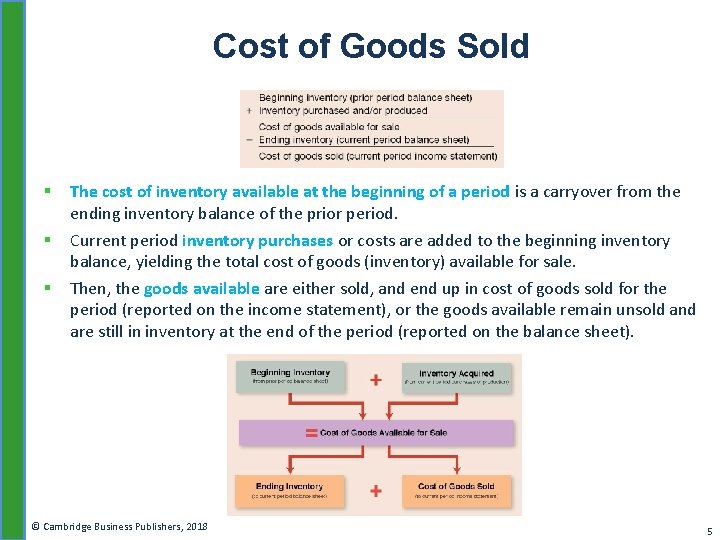
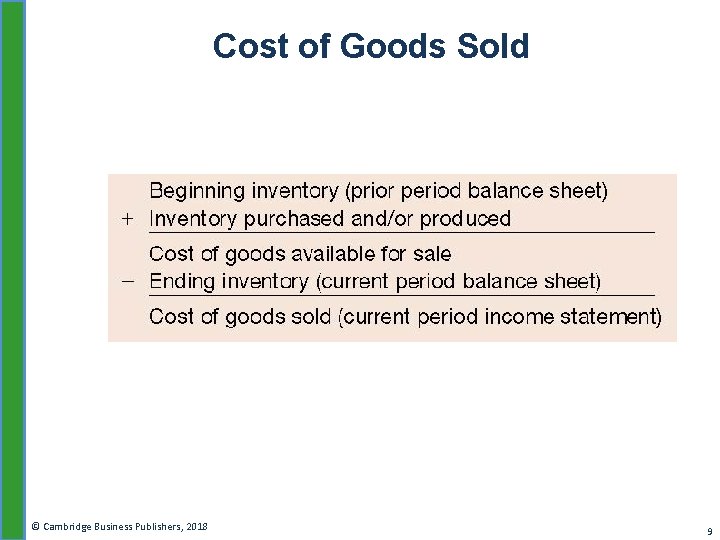
Cost of Goods Sold § § § The cost of inventory available at the beginning of a period is a carryover from the ending inventory balance of the prior period. Current period inventory purchases or costs are added to the beginning inventory balance, yielding the total cost of goods (inventory) available for sale. Then, the goods available are either sold, and end up in cost of goods sold for the period (reported on the income statement), or the goods available remain unsold and are still in inventory at the end of the period (reported on the balance sheet). © Cambridge Business Publishers, 2018 5
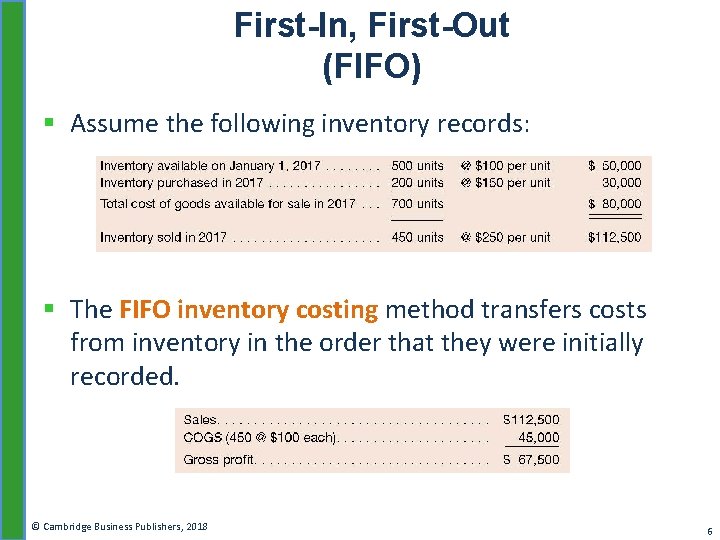
First-In, First-Out (FIFO) § Assume the following inventory records: § The FIFO inventory costing method transfers costs from inventory in the order that they were initially recorded. © Cambridge Business Publishers, 2018 6
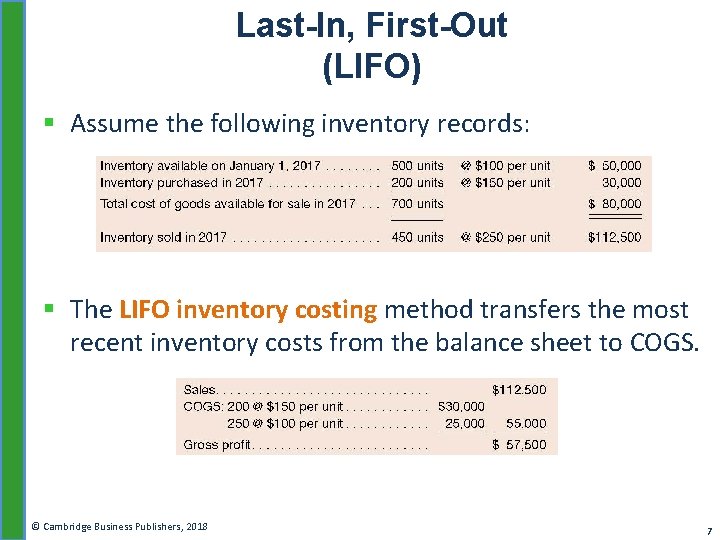
Last-In, First-Out (LIFO) § Assume the following inventory records: § The LIFO inventory costing method transfers the most recent inventory costs from the balance sheet to COGS. © Cambridge Business Publishers, 2018 7
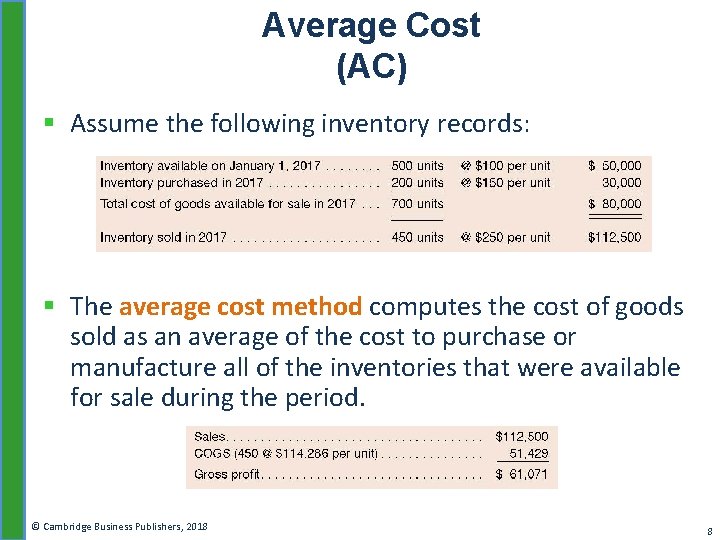
Average Cost (AC) § Assume the following inventory records: § The average cost method computes the cost of goods sold as an average of the cost to purchase or manufacture all of the inventories that were available for sale during the period. © Cambridge Business Publishers, 2018 8
Cost of Goods Sold © Cambridge Business Publishers, 2018 9
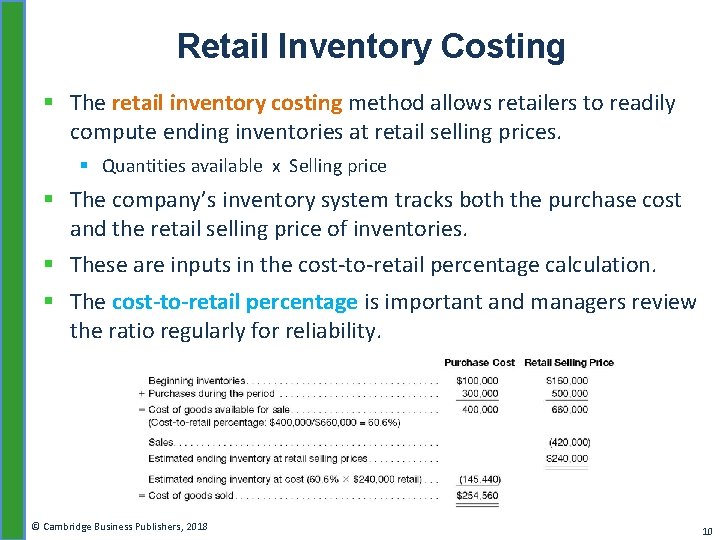
Retail Inventory Costing § The retail inventory costing method allows retailers to readily compute ending inventories at retail selling prices. § Quantities available x Selling price § The company’s inventory system tracks both the purchase cost and the retail selling price of inventories. § These are inputs in the cost-to-retail percentage calculation. § The cost-to-retail percentage is important and managers review the ratio regularly for reliability. © Cambridge Business Publishers, 2018 10
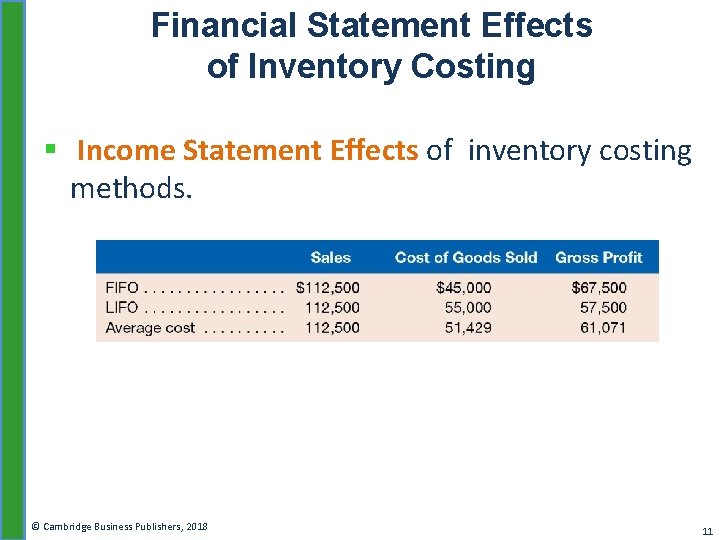
Financial Statement Effects of Inventory Costing § Income Statement Effects of inventory costing methods. © Cambridge Business Publishers, 2018 11
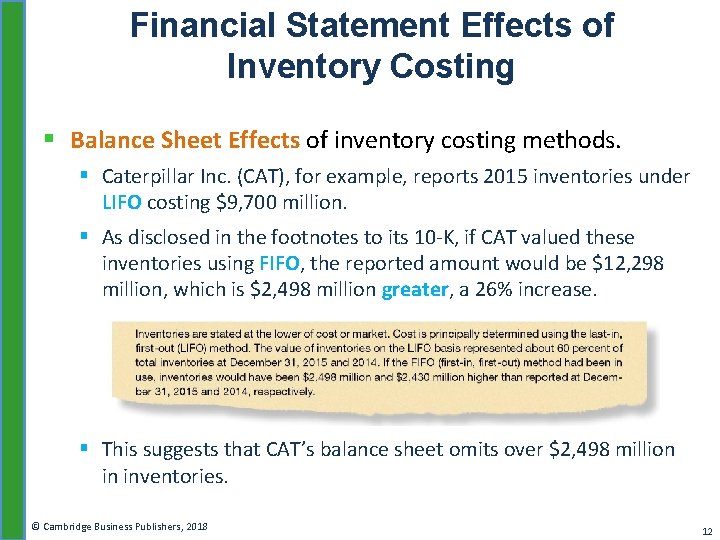
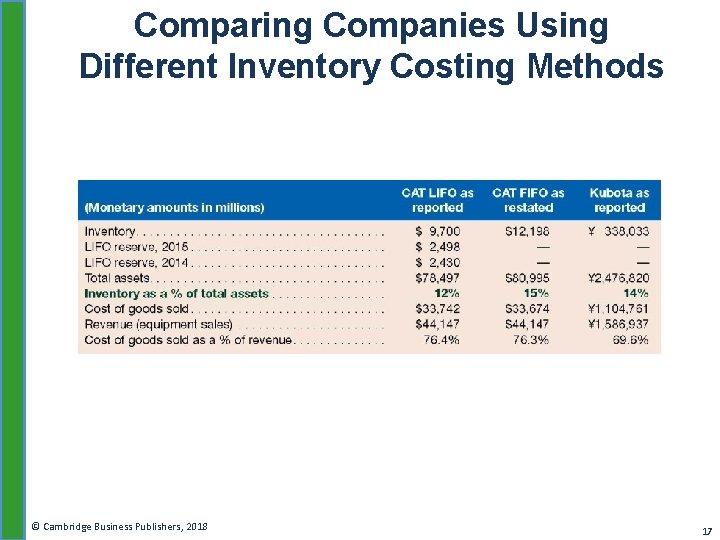
Financial Statement Effects of Inventory Costing § Balance Sheet Effects of inventory costing methods. § Caterpillar Inc. (CAT), for example, reports 2015 inventories under LIFO costing $9, 700 million. § As disclosed in the footnotes to its 10 -K, if CAT valued these inventories using FIFO, the reported amount would be $12, 298 million, which is $2, 498 million greater, a 26% increase. § This suggests that CAT’s balance sheet omits over $2, 498 million in inventories. © Cambridge Business Publishers, 2018 12
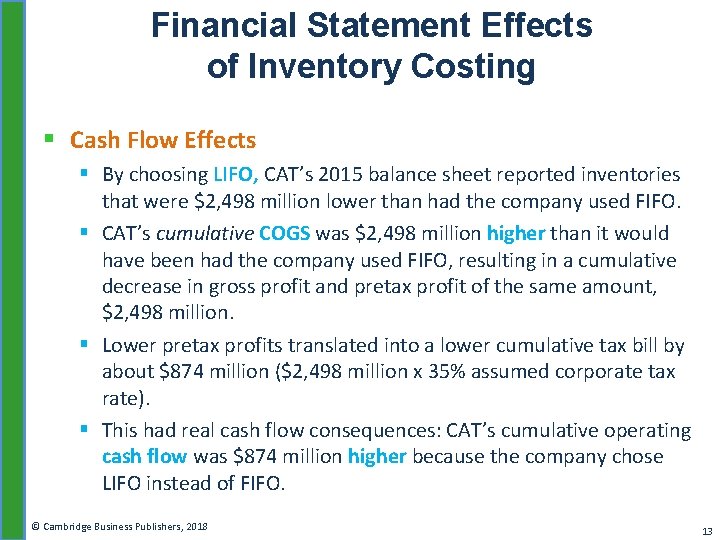
Financial Statement Effects of Inventory Costing § Cash Flow Effects § By choosing LIFO, CAT’s 2015 balance sheet reported inventories that were $2, 498 million lower than had the company used FIFO. § CAT’s cumulative COGS was $2, 498 million higher than it would have been had the company used FIFO, resulting in a cumulative decrease in gross profit and pretax profit of the same amount, $2, 498 million. § Lower pretax profits translated into a lower cumulative tax bill by about $874 million ($2, 498 million x 35% assumed corporate tax rate). § This had real cash flow consequences: CAT’s cumulative operating cash flow was $874 million higher because the company chose LIFO instead of FIFO. © Cambridge Business Publishers, 2018 13
Learning Objective 2 Examine inventory disclosures financial statements. © Cambridge Business Publishers, 2018 in 14
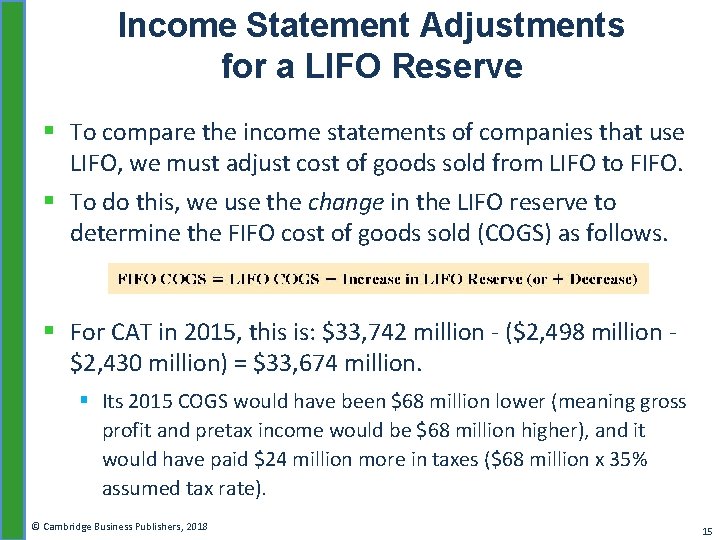
Income Statement Adjustments for a LIFO Reserve § To compare the income statements of companies that use LIFO, we must adjust cost of goods sold from LIFO to FIFO. § To do this, we use the change in the LIFO reserve to determine the FIFO cost of goods sold (COGS) as follows. § For CAT in 2015, this is: $33, 742 million - ($2, 498 million $2, 430 million) = $33, 674 million. § Its 2015 COGS would have been $68 million lower (meaning gross profit and pretax income would be $68 million higher), and it would have paid $24 million more in taxes ($68 million x 35% assumed tax rate). © Cambridge Business Publishers, 2018 15
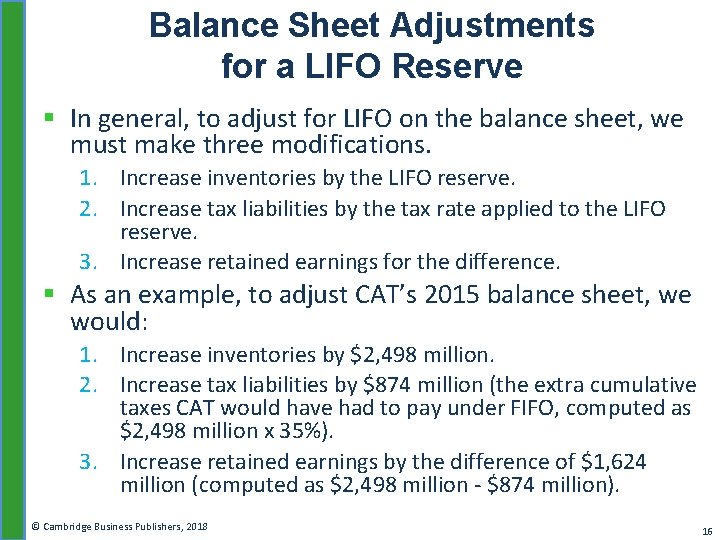
Balance Sheet Adjustments for a LIFO Reserve § In general, to adjust for LIFO on the balance sheet, we must make three modifications. 1. Increase inventories by the LIFO reserve. 2. Increase tax liabilities by the tax rate applied to the LIFO reserve. 3. Increase retained earnings for the difference. § As an example, to adjust CAT’s 2015 balance sheet, we would: 1. Increase inventories by $2, 498 million. 2. Increase tax liabilities by $874 million (the extra cumulative taxes CAT would have had to pay under FIFO, computed as $2, 498 million x 35%). 3. Increase retained earnings by the difference of $1, 624 million (computed as $2, 498 million - $874 million). © Cambridge Business Publishers, 2018 16
Comparing Companies Using Different Inventory Costing Methods © Cambridge Business Publishers, 2018 17
Lower of Cost or Market (LCM) § Home Depot uses FIFO to cost its inventory. § At the end of each accounting period, Home Depot compares the ending FIFO inventory balance with the market value of the inventory (its replacement cost). § If the market value is less than the FIFO amount, Home Depot “writes down” the inventory to its market value. § The result is that the inventory is carried on the balance sheet at whichever amount is lower: the cost of the inventory or its market value. § This process is called reporting inventories at the lower of cost or market. © Cambridge Business Publishers, 2018 18
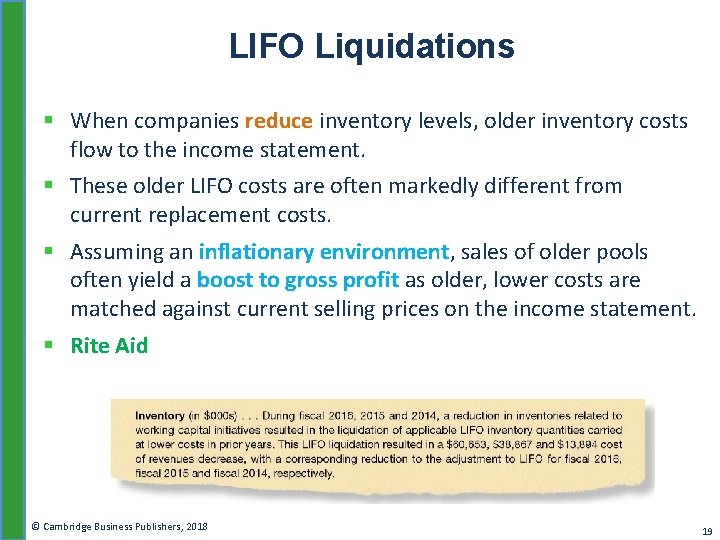
LIFO Liquidations § When companies reduce inventory levels, older inventory costs flow to the income statement. § These older LIFO costs are often markedly different from current replacement costs. § Assuming an inflationary environment, sales of older pools often yield a boost to gross profit as older, lower costs are matched against current selling prices on the income statement. § Rite Aid © Cambridge Business Publishers, 2018 19
Learning Objective 3 Analyze inventories and the related accounts payable. © Cambridge Business Publishers, 2018 20
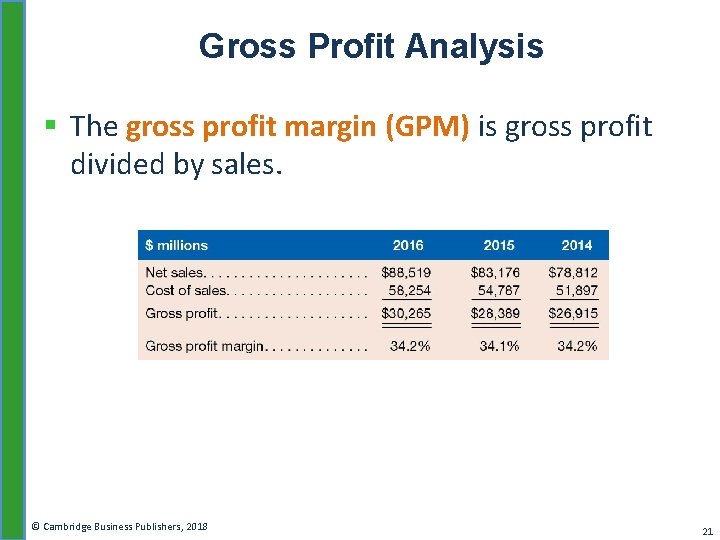
Gross Profit Analysis § The gross profit margin (GPM) is gross profit divided by sales. © Cambridge Business Publishers, 2018 21
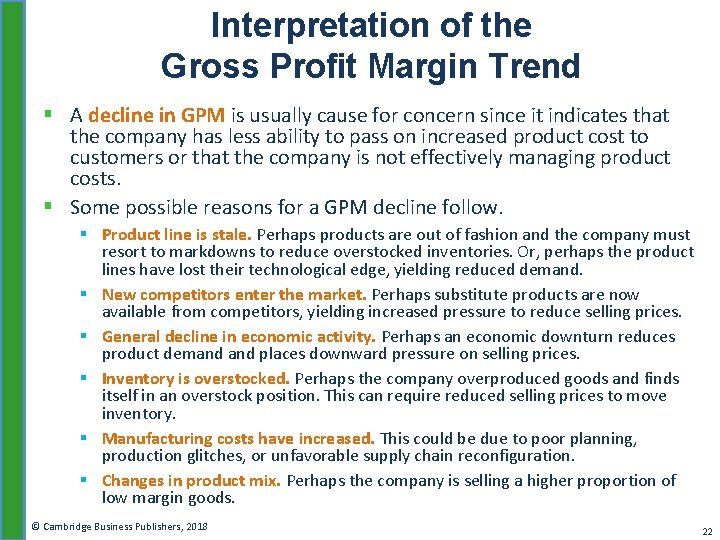
Interpretation of the Gross Profit Margin Trend § A decline in GPM is usually cause for concern since it indicates that the company has less ability to pass on increased product cost to customers or that the company is not effectively managing product costs. § Some possible reasons for a GPM decline follow. § Product line is stale. Perhaps products are out of fashion and the company must resort to markdowns to reduce overstocked inventories. Or, perhaps the product lines have lost their technological edge, yielding reduced demand. § New competitors enter the market. Perhaps substitute products are now available from competitors, yielding increased pressure to reduce selling prices. § General decline in economic activity. Perhaps an economic downturn reduces product demand places downward pressure on selling prices. § Inventory is overstocked. Perhaps the company overproduced goods and finds itself in an overstock position. This can require reduced selling prices to move inventory. § Manufacturing costs have increased. This could be due to poor planning, production glitches, or unfavorable supply chain reconfiguration. § Changes in product mix. Perhaps the company is selling a higher proportion of low margin goods. © Cambridge Business Publishers, 2018 22
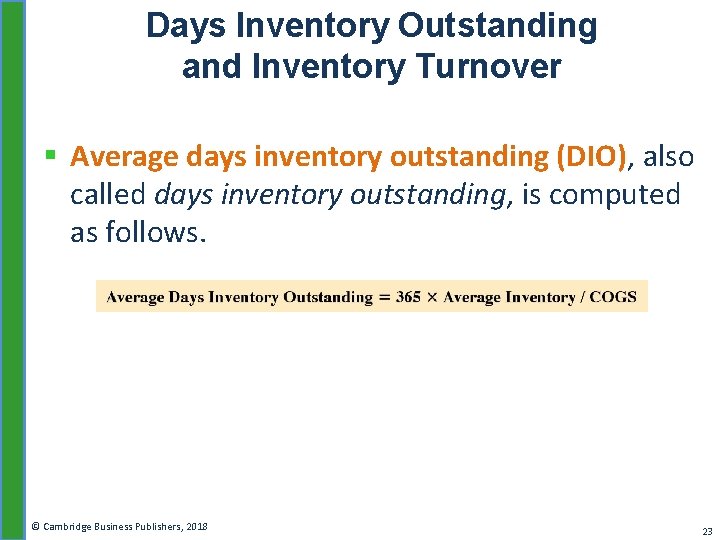
Days Inventory Outstanding and Inventory Turnover § Average days inventory outstanding (DIO), also called days inventory outstanding, is computed as follows. © Cambridge Business Publishers, 2018 23
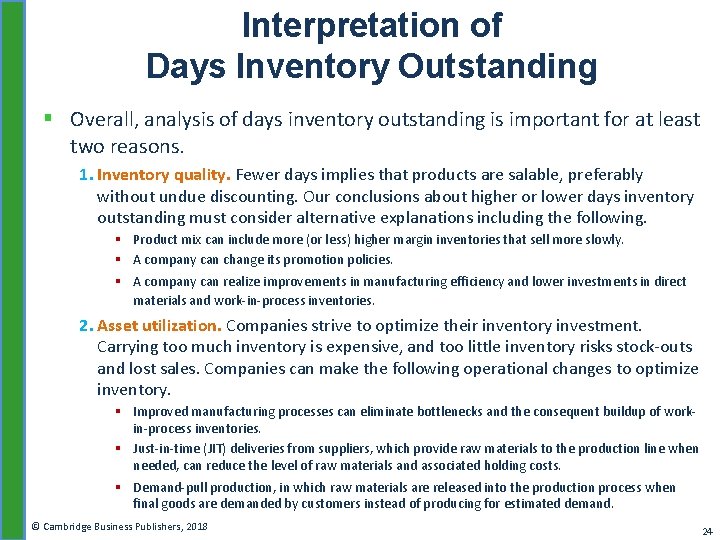
Interpretation of Days Inventory Outstanding § Overall, analysis of days inventory outstanding is important for at least two reasons. 1. Inventory quality. Fewer days implies that products are salable, preferably without undue discounting. Our conclusions about higher or lower days inventory outstanding must consider alternative explanations including the following. § Product mix can include more (or less) higher margin inventories that sell more slowly. § A company can change its promotion policies. § A company can realize improvements in manufacturing efficiency and lower investments in direct materials and work-in-process inventories. 2. Asset utilization. Companies strive to optimize their inventory investment. Carrying too much inventory is expensive, and too little inventory risks stock-outs and lost sales. Companies can make the following operational changes to optimize inventory. § Improved manufacturing processes can eliminate bottlenecks and the consequent buildup of workin-process inventories. § Just-in-time (JIT) deliveries from suppliers, which provide raw materials to the production line when needed, can reduce the level of raw materials and associated holding costs. § Demand-pull production, in which raw materials are released into the production process when final goods are demanded by customers instead of producing for estimated demand. © Cambridge Business Publishers, 2018 24
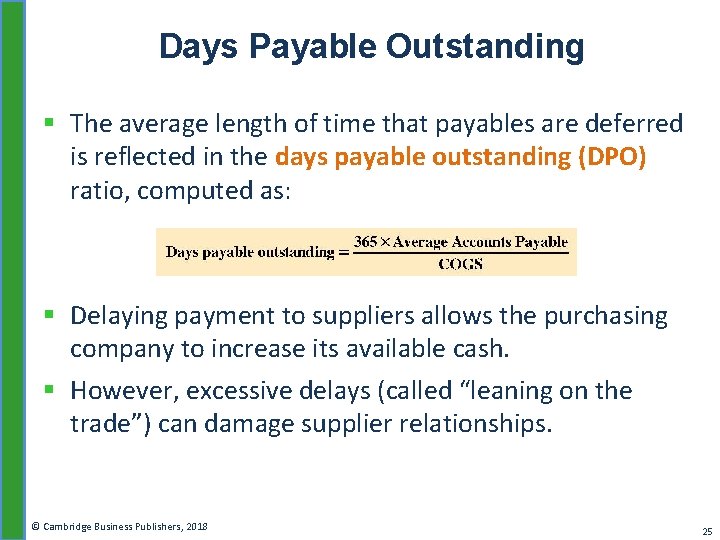
Days Payable Outstanding § The average length of time that payables are deferred is reflected in the days payable outstanding (DPO) ratio, computed as: § Delaying payment to suppliers allows the purchasing company to increase its available cash. § However, excessive delays (called “leaning on the trade”) can damage supplier relationships. © Cambridge Business Publishers, 2018 25
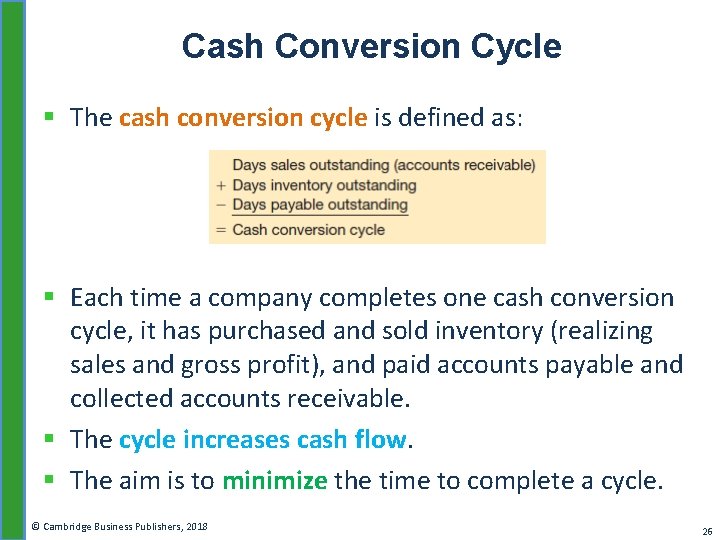
Cash Conversion Cycle § The cash conversion cycle is defined as: § Each time a company completes one cash conversion cycle, it has purchased and sold inventory (realizing sales and gross profit), and paid accounts payable and collected accounts receivable. § The cycle increases cash flow. § The aim is to minimize the time to complete a cycle. © Cambridge Business Publishers, 2018 26
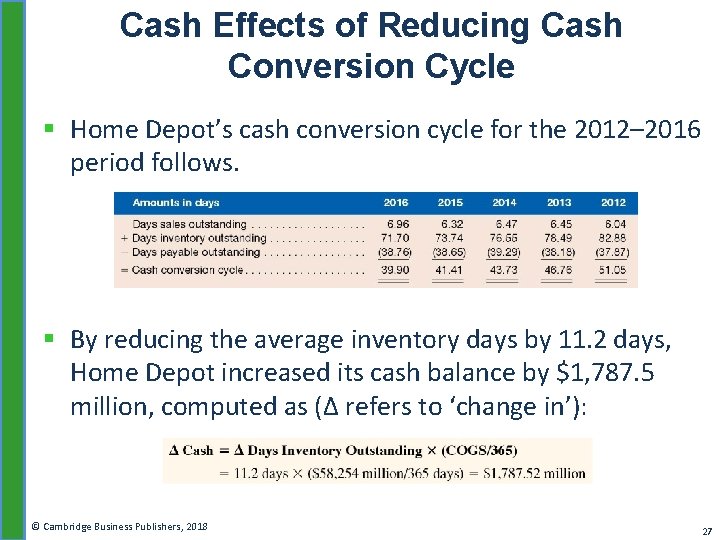
Cash Effects of Reducing Cash Conversion Cycle § Home Depot’s cash conversion cycle for the 2012– 2016 period follows. § By reducing the average inventory days by 11. 2 days, Home Depot increased its cash balance by $1, 787. 5 million, computed as (Δ refers to ‘change in’): © Cambridge Business Publishers, 2018 27
Learning Objective 4 Apply capitalization and depreciation of tangible assets. © Cambridge Business Publishers, 2018 28
Capitalization and Depreciation of PPE Assets § When PPE is acquired, it is recorded at cost on the balance sheet. This is called capitalization, which explains why expenditures for PPE are called CAPEX. § Once capitalized, the cost of plant and equipment is recognized as expense over the period of time that the assets produce revenues (directly or indirectly) in a process called depreciation. § Depreciation recognizes using up of the asset over its useful life. © Cambridge Business Publishers, 2018 29
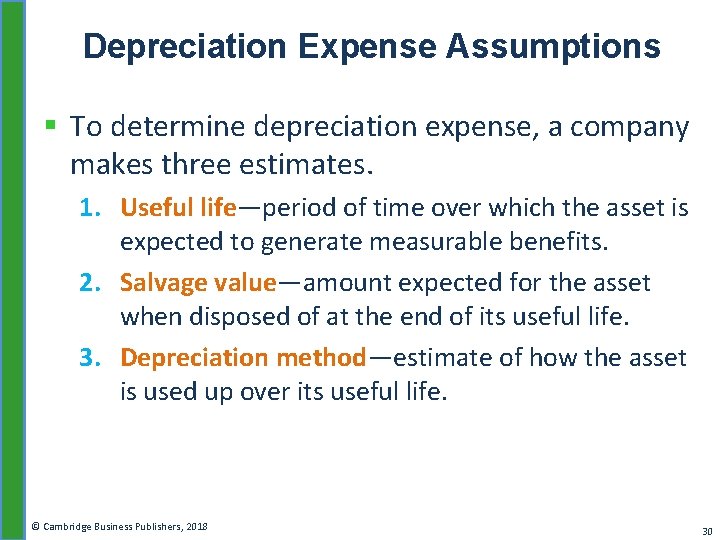
Depreciation Expense Assumptions § To determine depreciation expense, a company makes three estimates. 1. Useful life—period of time over which the asset is expected to generate measurable benefits. 2. Salvage value—amount expected for the asset when disposed of at the end of its useful life. 3. Depreciation method—estimate of how the asset is used up over its useful life. © Cambridge Business Publishers, 2018 30
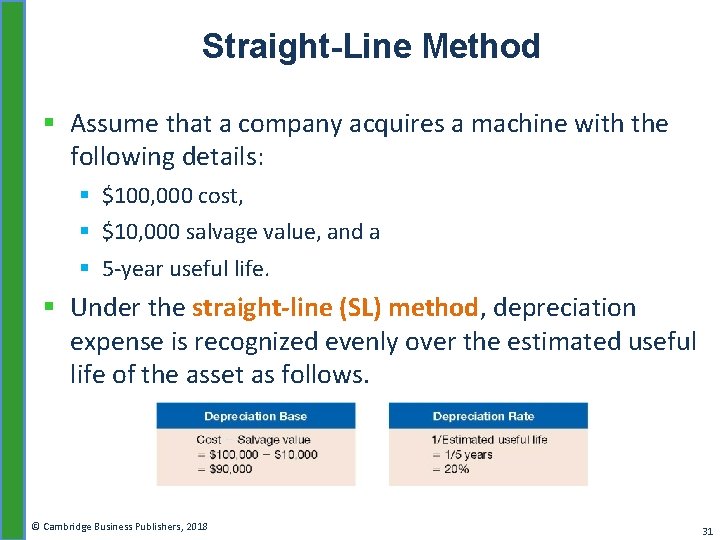
Straight-Line Method § Assume that a company acquires a machine with the following details: § $100, 000 cost, § $10, 000 salvage value, and a § 5 -year useful life. § Under the straight-line (SL) method, depreciation expense is recognized evenly over the estimated useful life of the asset as follows. © Cambridge Business Publishers, 2018 31
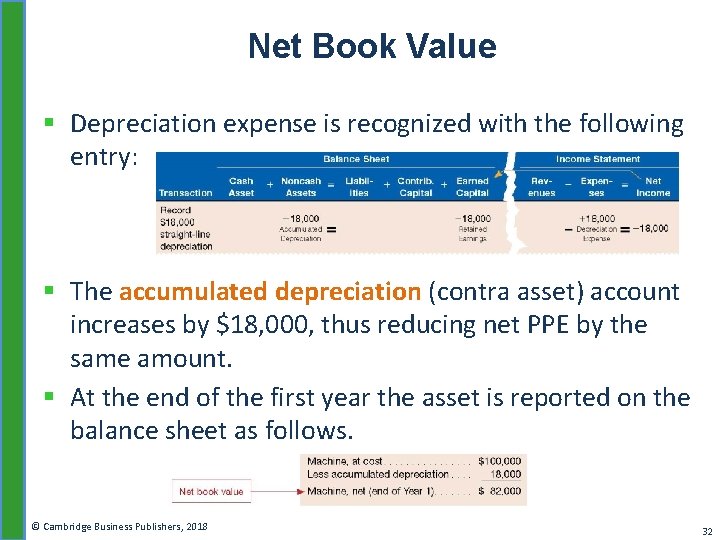
Net Book Value § Depreciation expense is recognized with the following entry: § The accumulated depreciation (contra asset) account increases by $18, 000, thus reducing net PPE by the same amount. § At the end of the first year the asset is reported on the balance sheet as follows. © Cambridge Business Publishers, 2018 32
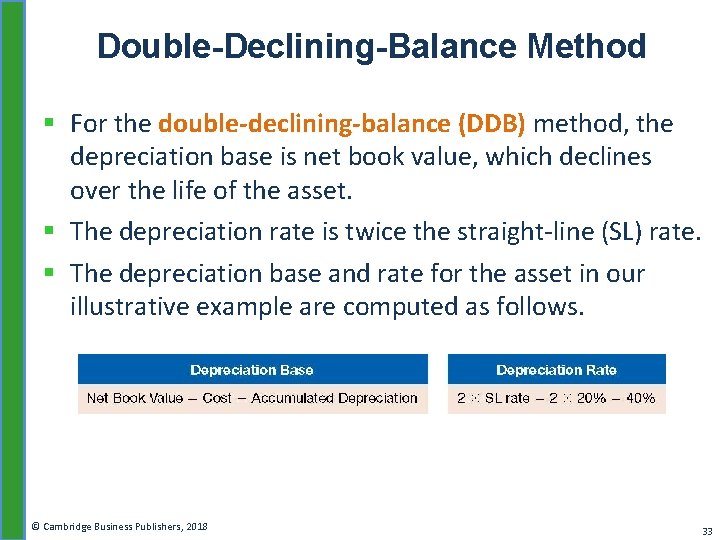
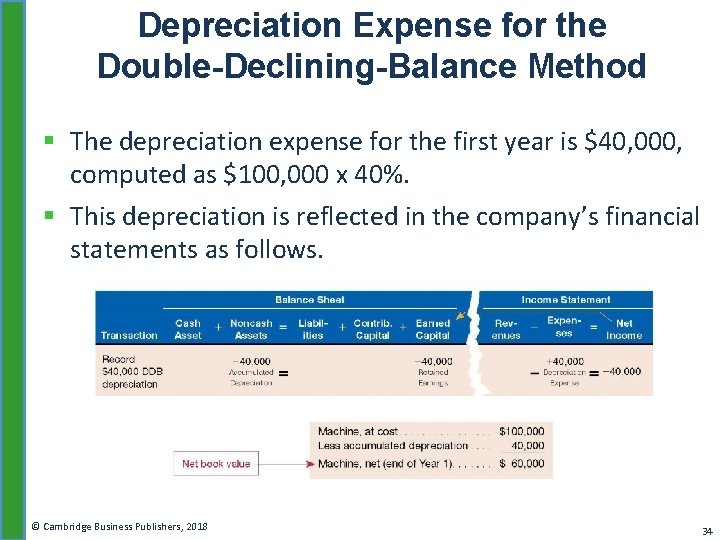
Double-Declining-Balance Method § For the double-declining-balance (DDB) method, the depreciation base is net book value, which declines over the life of the asset. § The depreciation rate is twice the straight-line (SL) rate. § The depreciation base and rate for the asset in our illustrative example are computed as follows. © Cambridge Business Publishers, 2018 33
Depreciation Expense for the Double-Declining-Balance Method § The depreciation expense for the first year is $40, 000, computed as $100, 000 x 40%. § This depreciation is reflected in the company’s financial statements as follows. © Cambridge Business Publishers, 2018 34
Tax and Cash Effects of Depreciation § Companies typically use the SL method for financial reporting purposes and an accelerated depreciation method for tax returns. § The reason is that in early years the SL depreciation yields higher income on financial statements, whereas accelerated depreciation yields lower taxable income. § Even though this relation reverses in later years, companies prefer to have the tax savings sooner rather than later so that the cash savings can be invested to produce earnings. § Further, the reversal may never occur—if depreciable assets are growing at a fast enough rate, the additional first year’s depreciation on newly acquired assets more than offsets the lower depreciation expense on older assets, yielding a “permanent” reduction in taxable income and taxes paid. © Cambridge Business Publishers, 2018 35
Depreciation of R&D PPE § R&D facilities and equipment are not immediately expensed. § If they are general-use in nature, the costs are capitalized on the balance sheet and depreciated over its useful life like other depreciable assets. § Only those R&D facilities and equipment that are purchased specifically for a single R&D project, and have no alternative use, are expensed immediately in the income statement (an unusual situation). © Cambridge Business Publishers, 2018 36
Learning Objective 5 Evaluate asset sales, impairments, and restructuring activities. © Cambridge Business Publishers, 2018 37
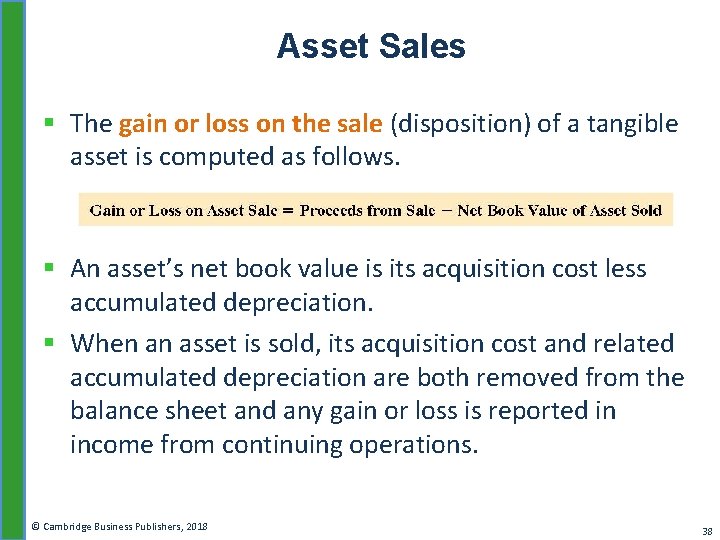
Asset Sales § The gain or loss on the sale (disposition) of a tangible asset is computed as follows. § An asset’s net book value is its acquisition cost less accumulated depreciation. § When an asset is sold, its acquisition cost and related accumulated depreciation are both removed from the balance sheet and any gain or loss is reported in income from continuing operations. © Cambridge Business Publishers, 2018 38
Hilton Worldwide Holdings Asset Sale § Hilton Worldwide Holdings provides the following footnote disclosure relating to the sale of the Waldorf Astoria hotel in New York. § Hilton sold the Waldorf Astoria hotel in New York for $1. 95 billion in 2015. § If we assume zero tax for simplicity, the hotel was carried on Hilton’s balance sheet at a book value of $1. 807 billion. § Hilton recognized a gain on sale, net of $143 million ($1. 95 billion – $1. 807 billion). © Cambridge Business Publishers, 2018 39
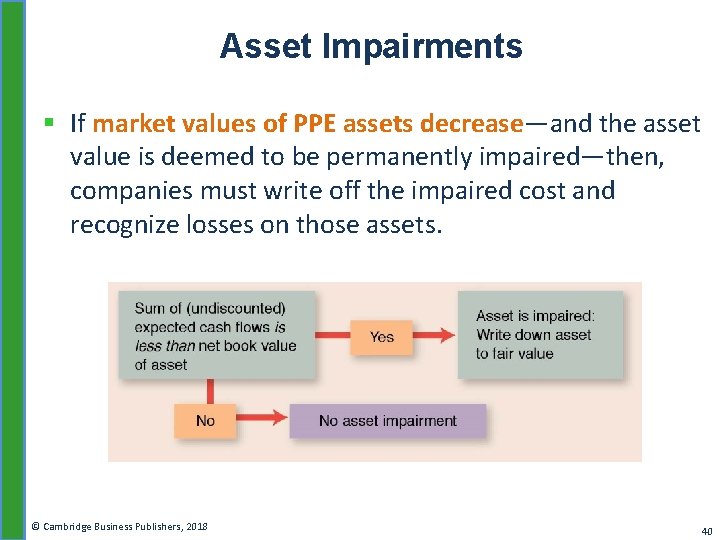
Asset Impairments § If market values of PPE assets decrease—and the asset value is deemed to be permanently impaired—then, companies must write off the impaired cost and recognize losses on those assets. © Cambridge Business Publishers, 2018 40
Asset Impairment Charge — Chesapeake Energy — § As oil prices declined in 2015, Chesapeake Energy was forced to write down its oil and gas properties. § This led to an impairment charge of $18, 238 million. § To determine the impairment charge, Chesapeake compared the fair value of certain properties using the 2015 market prices for oil and gas to the properties’ carrying value (the net book value on the balance sheet). § Because historical prices had dropped drastically during 2015 (from $94. 98 to $50. 28, for example), the properties’ fair value also dropped drastically. © Cambridge Business Publishers, 2018 41
Restructuring Costs § Corporate restructurings are designed to turn a company around are frequently initiated in response to poor performance, mounting debt, and shareholder pressure. § A restructuring can involve eliminating business segments, selling major assets, downsizing the workforce, and reconfiguring debt. § Ultimately, the goal of a restructuring is to positively impact a company’s long-term financial performance. © Cambridge Business Publishers, 2018 42
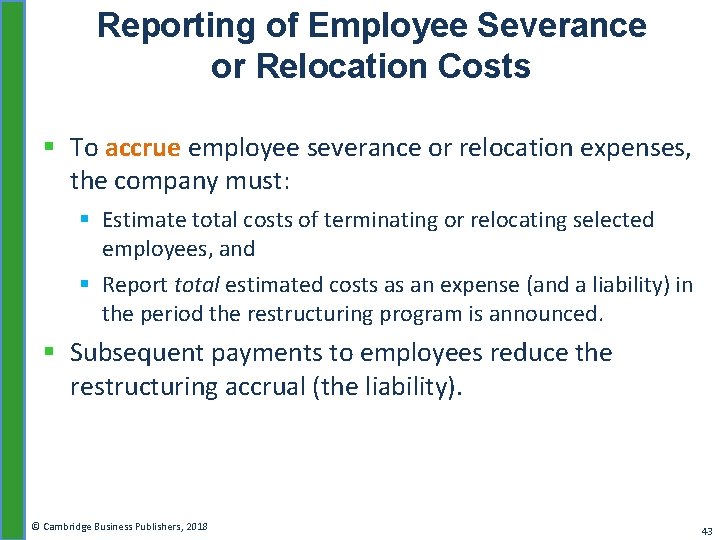
Reporting of Employee Severance or Relocation Costs § To accrue employee severance or relocation expenses, the company must: § Estimate total costs of terminating or relocating selected employees, and § Report total estimated costs as an expense (and a liability) in the period the restructuring program is announced. § Subsequent payments to employees reduce the restructuring accrual (the liability). © Cambridge Business Publishers, 2018 43
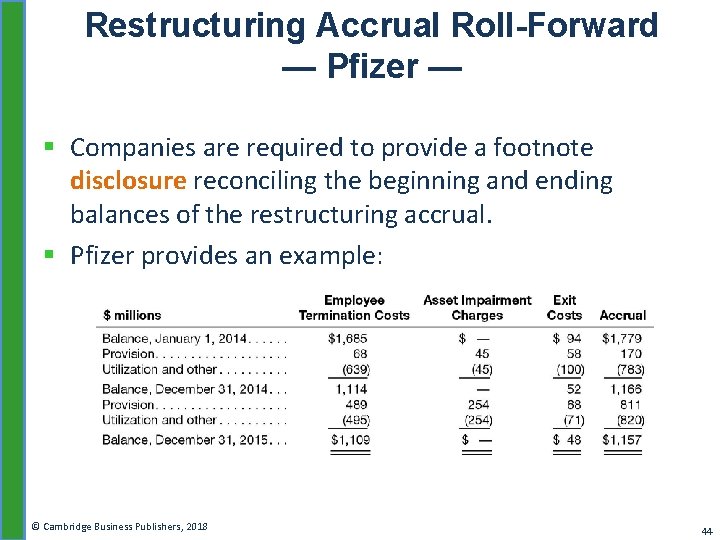
Restructuring Accrual Roll-Forward — Pfizer — § Companies are required to provide a footnote disclosure reconciling the beginning and ending balances of the restructuring accrual. § Pfizer provides an example: © Cambridge Business Publishers, 2018 44
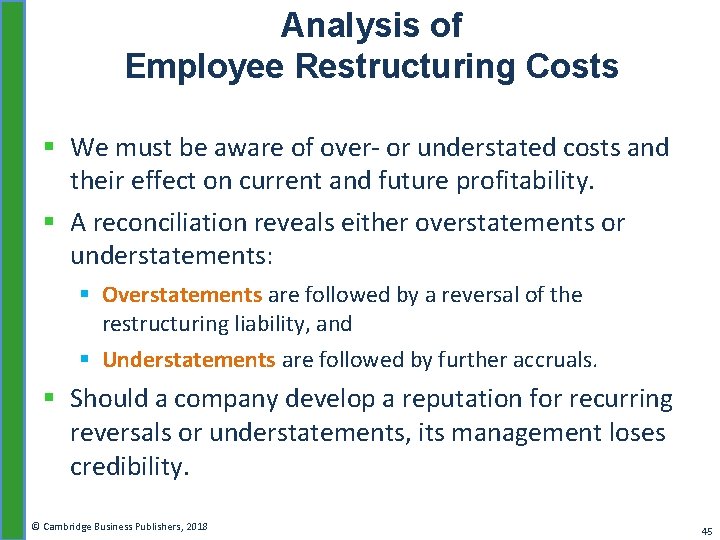
Analysis of Employee Restructuring Costs § We must be aware of over- or understated costs and their effect on current and future profitability. § A reconciliation reveals either overstatements or understatements: § Overstatements are followed by a reversal of the restructuring liability, and § Understatements are followed by further accruals. § Should a company develop a reputation for recurring reversals or understatements, its management loses credibility. © Cambridge Business Publishers, 2018 45
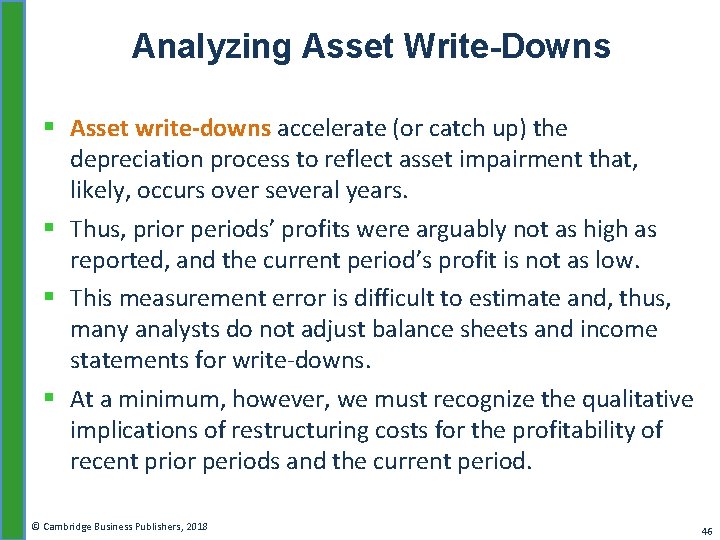
Analyzing Asset Write-Downs § Asset write-downs accelerate (or catch up) the depreciation process to reflect asset impairment that, likely, occurs over several years. § Thus, prior periods’ profits were arguably not as high as reported, and the current period’s profit is not as low. § This measurement error is difficult to estimate and, thus, many analysts do not adjust balance sheets and income statements for write-downs. § At a minimum, however, we must recognize the qualitative implications of restructuring costs for the profitability of recent prior periods and the current period. © Cambridge Business Publishers, 2018 46
Learning Objective 6 Analyze tangible assets and related activities. © Cambridge Business Publishers, 2018 47
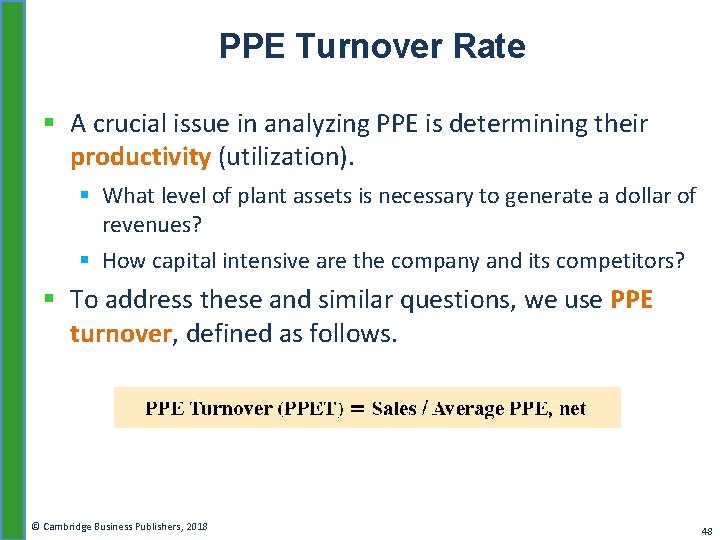
PPE Turnover Rate § A crucial issue in analyzing PPE is determining their productivity (utilization). § What level of plant assets is necessary to generate a dollar of revenues? § How capital intensive are the company and its competitors? § To address these and similar questions, we use PPE turnover, defined as follows. © Cambridge Business Publishers, 2018 48
Analysis of PPE Turnover Rate § Higher PPE turnover is preferable to lower. § A higher PPE turnover implies a lower capital investment for a given level of sales. § Higher turnover, therefore, increases profitability because the company avoids asset carrying costs and because the freed-up assets can generate operating cash flow. § PPE turnover is lower for capital-intensive manufacturing companies than it is for companies in service or knowledge-based industries. © Cambridge Business Publishers, 2018 49
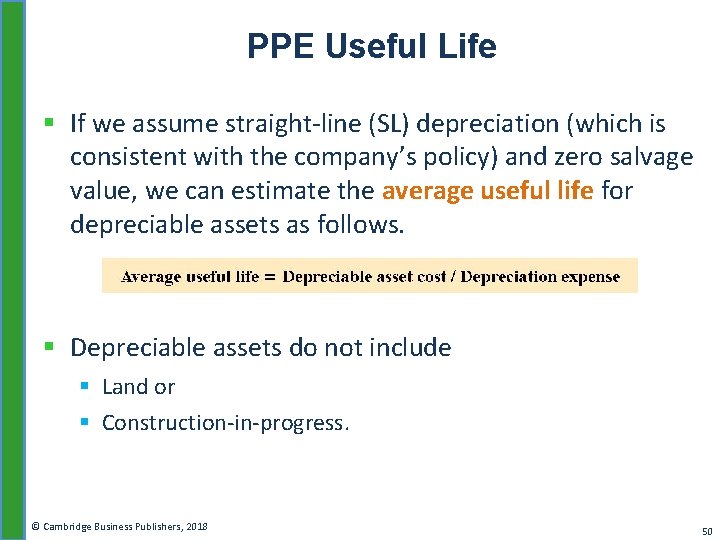
PPE Useful Life § If we assume straight-line (SL) depreciation (which is consistent with the company’s policy) and zero salvage value, we can estimate the average useful life for depreciable assets as follows. § Depreciable assets do not include § Land or § Construction-in-progress. © Cambridge Business Publishers, 2018 50
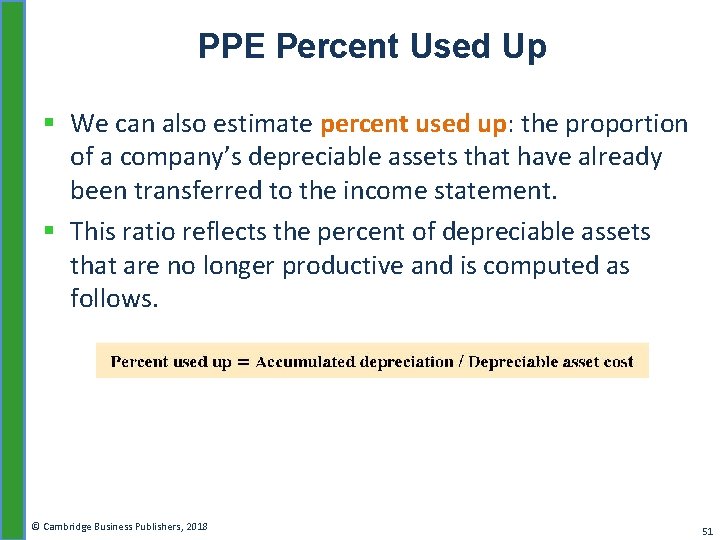
PPE Percent Used Up § We can also estimate percent used up: the proportion of a company’s depreciable assets that have already been transferred to the income statement. § This ratio reflects the percent of depreciable assets that are no longer productive and is computed as follows. © Cambridge Business Publishers, 2018 51
Analysis of Percent Used Up § Knowing the degree to which a company’s assets are used up is of interest in forecasting future cash flows. § If, for example, depreciable assets are 80% used up, we might anticipate a higher level of capital expenditures to replace aging assets in the near future. § We also expect that older assets are less efficient and will incur higher maintenance costs. © Cambridge Business Publishers, 2018 52
The End