Fetal Alcohol Syndrome Two Hundred and FiftyEight Cases


 600 Children ¨ 335 (55.")


 to children with Fetal")

 and Fetal Alcohol Effect (FAE)")
 Children to White Children With the")


 Wholesale tax $ 5, 500, 000 Sales tax $14,")


 TOLERANCE How many drinks can you")


- Slides: 50
Fetal Alcohol Syndrome
Two Hundred and Fifty-Eight Cases of Suffocation of Infants By Charles Templeman, M. D. , B. Sc. (Pub. Health), Surgeon of Police; Surgeon to the Royal Infirmary, Dundee. (Read before the Medico-Chirurgical Society of Edinburgh, 1 st June 1892. )
If drinking over 2 years prior to pregnancy, mortality rate 62. 7% ¨ 46% deaths occur on Saturday night and Sunday morning
A Note on the Influence of Maternal Inebriety on the Offspring By W. C. Sullivan, M. D. , and Stewart Scholar in Mental Disease, R. U. I. , Deputy Medical Officer, H. M. Convict Prison, Parkhurst (July, 1899)
Mortality ¨Women n = 100 (plus 20 female relatives) 600 Children ¨ 335 (55. 8%) died ¨ 80 women had 3 or more dead infants
Second Cause of Death: Maternal Drunkenness
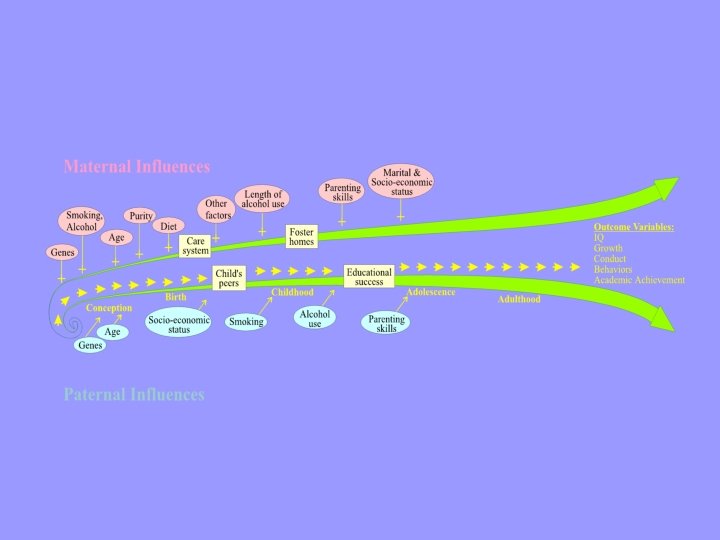
Alcohol Related Birth Defects and Developmental Disabilities Fetal Alcohol Syndrome © Larry Burd, Fetal Alcohol Syndrome Center, University of North Dakota
PFAS PFAE PARND PARBD Due to Prenatal Exposure
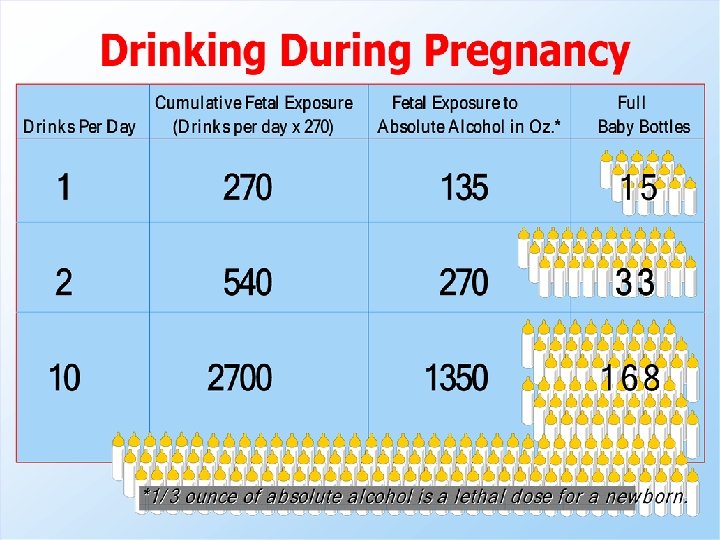
Assessment of Exposure During Pregnancy n. On average how many days per week did you drink during pregnancy? _____(a) n. What is the most you had to drink on any one day during pregnancy? _____ n. On an average drinking day during pregnancy how many drinks did you have? _____(b) Exposure Parameters (Cumulative exposure during pregnancy) §Pregnancy Drinking Days = ( a x 40 ) = §Estimate of number of drinking days during pregnancy. §Percent of Days Exposed During Pregnancy = ( c ÷ 280 ) = §Estimate of days exposed during pregnancy. §Number of Drinks During Pregnancy = ( a x b x 40 ) = §Estimate of number of drinks during pregnancy. §Ounces of absolute alcohol = ( d ÷ 2 ) = §Estimate of exposure to absolute alcohol during pregnancy. _____(c) _____ _____(d) _______
Comparison of North Dakota Children with Fetal Alcohol Syndrome (FAS) to children with Fetal Alcohol Effect (FAE). Variable. N Mean SD ______________________________ __ Birth Weight (grams) FAS 44 2766. 6 512. 1 * FAE 24 3087. 7 676. 8 ______________________________ ___ Mother's Age (years) FAS 44 27. 3 5. 4 FAE 24 27. 3 4. 8 ______________________________ Father's Age (years) FAS 23 32. 3 10. 2 FAE 17 30. 6 6. 5 ______________________________ Weight Gain (kilograms) FAS 7 7. 3 6. 8 FAE 4 11. 6 4. 5 ______________________________ Gestation (weeks) FAS 8 38. 6 1. 8 FAE 5 37. 8 1. 1 _______________________________ Apgar (1 Minute) FAS 35 7. 3 1. 6 FAE 18 7. 7 1. 0 ______________________________
Comparison of North Dakota Children with FAS or FAE to the control group. Four controls were selected for each case. _____________________________ Variable N Mean SD _____________________________ ___ Birth Weight (grams) ** FAS/FAE 68 2880. 0 591. 2 Control 272 3467. 1 656. 1 _____________________________ Mother's Age (years) ** FAS/FAE 68 27. 3 5. 2 Control 272 24. 8 5. 3 _____________________________ Father's Age (years) ** FAS/FAE 40 31. 6 8. 8 Control 211 27. 6 6. 4 _____________________________ Weight Gain (kilograms) ** FAS/FAE 11 8. 8 6. 3 Control 52 13. 9 5. 6 _____________________________ Gestation (weeks) FAS/FAE 13 38. 3 1. 5 Control 52 39. 1 1. 9 _____________________________ Apgar (1 Minute) FAS/FAE 53 7. 5 1. 4
Comparison of Categorical Variables for Fetal Alcohol Syndrome (FAS) and Fetal Alcohol Effect (FAE) Groups Combined to the Control Group (four controls per case). _____________________________________________ 95% Confidence Group FAS/FAE Controls OR Intervals Variables n (%) n (%) (Yates’) p-value _____________________________________________ Marital Status Not Married 38 27 (58) (42) 113 147 (43) (57) 1. 83 4. 12 (1. 02, 3. 30). 042* Smoking During Pregnancy Yes No 8 5 (62) (38) 19 33 (37) (63) 2. 78 1. 75 (0. 79, 9. 71). 186 Alcohol Use During Pregnancy Yes No 9 4 (69) (31) 4 48 (8) (92) 27. 00 20. 92# (5. 68, 128. 24). 000** Number of Prenatal Visits 0 -5 >5 37 29 (56) (44) 73 197 (27) (73) 3. 44 18. 99 (1. 91, 6. 23). 000** Live Births Now Dead 1 or More None 12 56 (18) (82) 16 254 (6) (94) 3. 40 8. 34 (1. 42, 8. 12). 004** Trimester Prenatal Care Began 2 nd or 3 rd 20 (35) 112 (42) 0. 73 (0. 39, 1. 38) 1 st 37 (65) 152 (58) 0. 76. 383 _____________________________________________ # = Fisher exact used for p-value • * = Significant at. 05 level • ** = Significant at. 01 level
Comparison of Categorical Variables for Native American (NA) Children to White Children With the Fetal Alcohol Syndrome (FAS) and Fetal Alcohol Effects Groups (FAE) Combined ___________________________________ _ FAS/FAE Combined Variables N Mean SD ____________________________________ Birth Weight (grams) White 18 2925. 8 609. 8 NA 50 2863. 5 589. 7 ____________________________________ _ Mother's Age (years) White 18 25. 1 4. 7 NA 50 28. 1 5. 1 ____________________________________ __ Father's Age (years) White 11 31. 6 7. 2 NA 29 31. 6 9. 5 ____________________________________ __ Weight Gain (kilograms) White 2 12. 5 4. 8 NA 9 8. 1 6. 4 ____________________________________ __ Gestation (weeks) White 3 39. 0 1. 0 NA 10 38. 1 1. 7 ____________________________________ Apgar (1 Minute) White 15 7. 7 1. 0 NA 38 7. 3 1. 5 ____________________________________
Maternal and Paternal Risk Factor for FAS from 132 Cases of FAS/FAE from North Dakota (adapted from Bagheri and Burd)21 ________________________________________ Variable Case/Control Mean (Difference) p-value Case/Control ________________________________________ Mother's Age (years) 132/660 27. 4/25. 4 (2. 0) <0. 001 Father's Age (years) 43/215 32. 0/27. 8 (4. 2) <0. 001 Weight gain in pregnancy (lbs. ) 33/165 22. 1/30. 4 (8. 3) <0. 001 Gestation (weeks) 101/505 38. 7/40. 0 (1. 3) <0. 001 Month prenatal care began 123/615 3. 4/2. 7 (0. 7) <0. 001 Number prenatal visits 123/615 5. 5/9. 7 (4. 2) <0. 001 Mother's education 125/625 10. 6/13. 0 (2. 4) <0. 001 Father's education 32/160 10. 8/13. 2 (2. 6) <0. 001 ________________________________________
Increased Probability of a Previous Child with Fetal Alcohol Syndrome Total number of live births prior to birth of FAS child 135 Number of Estimated Incidence of children with incidence of FAS in previous Risk FAS in prior FAS per 1, 000 births per 1, 000 increased by births live births 23 . 97 Source: E. L> Abel, Fetal Alcohol Syndrome in Families, Neurotoxicity and Teratology (1988), 10, pp. 1 -2. Copyright 1988 by Elsevier Science, Adapted with permission of the publisher. 170. 4 172 x
Increased Risk of Having a Second Child with Fetal Alcohol Syndrome Total number Number of of live births children with after birth of FAS in FAS child subsequent births 35 27 Estimated Incidence of incidence of FAS in Risk FAS per subsequent increased by 1, 000 live births per 1, 000 births live births. 97 Source: E. L> Abel, Fetal Alcohol Syndrome in Families, Neurotoxicity and Teratology (1988), 10, pp. 1 -2. Copyright 1988 by Elsevier Science, Adapted with permission of the publisher. 771 795 x
MATERNAL RISK SCORE ____Age Over 25 years SCORE ____Unmarried, Divorced, Widow, Living with Partner ____On AFDC, WIC, Social Security or Income < $16, 000 Per Year ____Did not Graduate From High School ____Poor Diet ____Smokes More Than ½ Pack per Day Check any one, Add 5 ____Drinks less than 2 days/week & less than 2 drinks /drinking day Check here, Add 20 ____Age First Drunk Less Than 15 years ____In Treatment Over Three Times ____In Treatment in Last 12 Months ____Previous Child With FAS, FAE, Birth Defect, or Developmental Disability ____Previous Child Died Check any one, Add 35 ____Children Out of Home (Foster Care or Adopted) ____Heavy Drinker (3 or more days per week or over 3 drinks per drinking day) ____Uses Inhalants, Sniffs or Illegal Drugs Score Risk Category Recommendations 0 None Standard Prenatal Care 5 Low Standard Prenatal Care 20 -40 Moderate Standard Prenatal Care and Patient Education on FAS 45 -50 High Risk pregnancy, Alcohol-Drug Abuse Treatment 55 -85 Very High Risk Pregnancy, Inpatient Treatment Check any one, Add 45 Total Score Prenatal Copyright 2000
THE MOMS Age 27. 4 Education 10. 6 Unmarried 63% Smoker 82% Alcoholic 10+ years Heavy Drinker > 10 day + Treatment > 3 45% Minority 73% Poor + Poor Diet + Parity 3 Prenatal (1 st) 1 Prenatal visits <3 Maternal Deaths FAE FAS 4. 1% 4. 5% Number of prenatal complications Number of prenatal visits Monthly prenatal care starts Birth weight Number of malformations
THE DADS Age 30. 8 Education 10. 9 Unmarried 63% Alcoholic 12 + years Heavy Drinker + Treatment >3 Minority 60% Poor + Other terminations Number of prenatal visits Number of prenatal complications
THE CHILDREN Age Diagnosis 7. 1 years Older Sibs 2 Younger 2 Birth Defects 50% Cerebral Palsy 6% Mental Retardation 40% ADHD 60% Out of Home 85% Head Injury 25% Dead Sibling FAE 1 = 2% FAS 1 = 1% 2=0 2 = 2% 3=0 3 = 5%
THE MOMS Age 27. 4 Education 10. 6 Unmarried 63% Smoker 82% Alcoholic 10+ years Heavy Drinker > 10 day Treatment >3 times (45%) Poor + Poor Diet + Parity 3 st Prenatal (1 ) 1 Prenatal visits <3 Maternal deaths FAE 4. 1% FAS 4. 5% THE DADS Age 30. 8 Education 10. 9 Unmarried 63% Alcoholic 12+ years Heavy Drinker + Poor + THE CHILDREN Age diagnosis Older sibs Younger Birth defects Cerebral Palsy Mental retardation ADHD Out of Home Head Injury Dead Sibling FAS/FAE Controls 7. 1 years 2 2 50% 6% 40% 60% 85% 25% 11. 4% 2. 0%
Ten-Year Follow-Up of FAS Children 18% Had Died 27% of the Mothers Had Died (Streissguth, 1985)
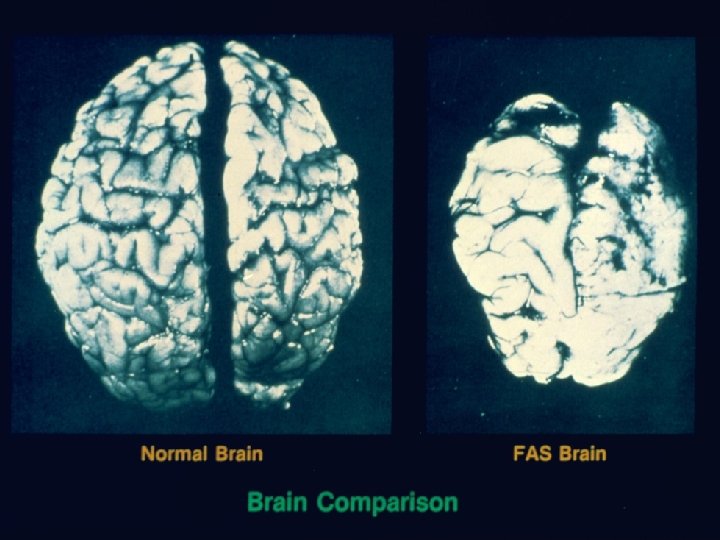
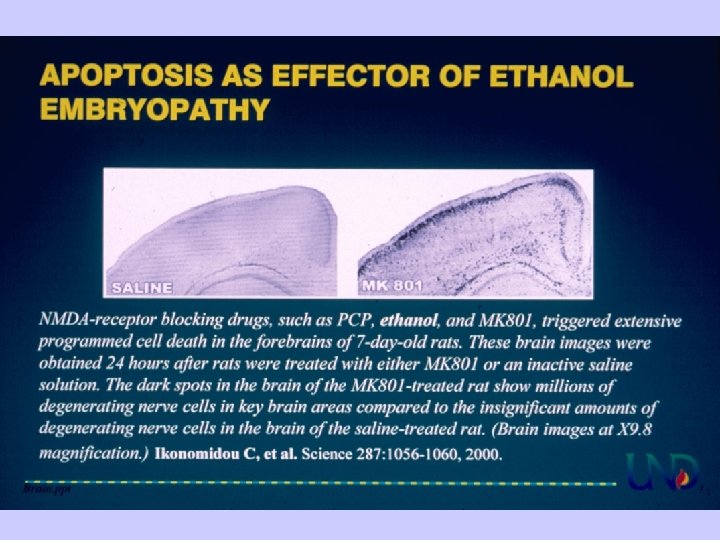
Examination of the developing mouse brain following alcohol exposure shows cells that have been killed. Apoptotic cells Nile blue stained in two of the pictures and dark brown at bottom right. Kindly provided by Dr. K Sulik and Dr. W Dunty, Univ of North Carolina
Ikonomidou C, et al. Science 287: 1056 -1060, 2000.
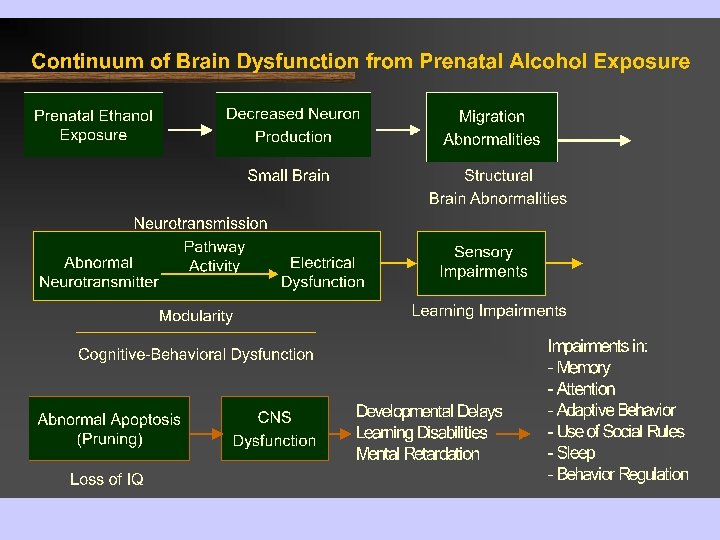
Impairments in: • Memory • Attention • Adaptive behavior • Use of social rules • Sleep • Behavior regulation
_____________________________________________ Secondary Disabilities in 400 Adolescents and Adults with Fetal Alcohol Syndrome and Fetal Alcohol Effect _____________________________________________ 1. Mental Health problems: 90% 2. Disrupted School Experience (suspended or expelled from school of dropping out of school): 60% 3. Trouble With the Law: 60% 4. Confinement: Includes inpatient treatment for mental health problems, alcohol/drug problems, or incarcerated for a crime. 50% 5. Inappropriate Sexual Behavior: 50% 6. Alcohol/Drug Problems: 30% Protective Factors 1. Living in a stable and nurturing home for over 72% of life. 2. Being diagnosed before the age of 6 years. 3. Never having experienced violence against oneself. 4. Staying in each living situation for an average of more than 2. 8 years. 5. Experiencing a good quality home from age 8 to 12 years. 6. Having applied for an been found eligible for Division of Developmental Disabilities services. 7. Having a diagnosis of FAS. 8. Having basic needs met for at least 13% of life. _____________________________________________
FAS in North Dakota § Annual Births § 0 -18 180 -324 § Adult 360 -800
North Dakota Alcohol Income (2000) Wholesale tax $ 5, 500, 000 Sales tax $14, 500, 000 Total $20, 000
3. 9 Million Births 1, 560, 000 Exposed 137, 000 Frequent heavy drinking 39, 000 FAS-RD The National Center on Addiction and Substance Abuse, 1999
Tom Welty MD AAIHS 1998 Prevalence Rate FAS AAIHS: 8 per 1, 000 live births. 2 to 8 times above other population estimates.
Tom Welty MD AAIHS 1998 Estimated Lifetime Cost person to care for their needs: $1 -$4 million Total Lifetime estimated cost for FAS cases that occurred in Aberdeen Area in 1990: $21 -$84 million Total costs for all alcohol-related developmental disabilities are much higher since projections are based only on confirmed FAS cases.
§ Lost productivity due to FAS: Adults - $1, 000, 000/annually $2, 739, 000/day § Health care costs due to FAS: Children and adults - $2, 000, 000/annually $5, 479, 000/day The National Center on Addiction and Substance Abuse, 1999
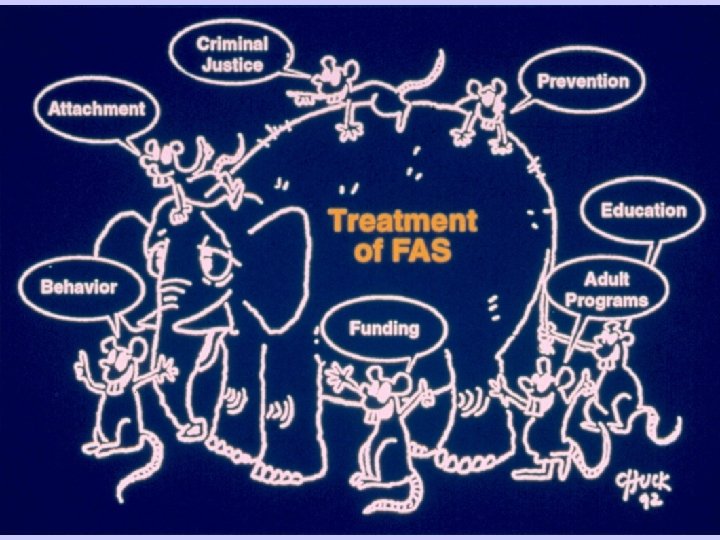
Treatment of FAS Start early-Avoid Abuse Avoid multiple foster homes Treat in community Make a place in the community Avoid problem peers Use legal system Long term treatment-more than 10 years
A Developmental Management Model for Children and Adults With FAS and Related Disorders _______________________________________ Newborn Management: 1. Diagnostic assessment of both physical and neurologic anomalies 2. Early involvement of child protective services. 3. Referral to the Department of Human Services for initiation of infant stimulation. 4. Prevention of secondary disabilities, specific to age group; abuse, vision/hearing deficits. 5. Referral of mother to substance abuse treatment program. 6. Sensory evaluation (vision and hearing). Childhood Management: 1. Head Start Program with special learning environment, addressing specific learning disabilities. 2. Annual developmental assessment. 3. Referral for services to address neurologic deficits and psychosocial delays. 4. Prevention of secondary disabilities.
Monitoring social skill development Adolescent Management: 1. Prevention of secondary disabilities, specifically drug and alcohol use. Prevention of school failure, social problems and institutionalization. 2. Vocational training, preparation for future employment. 3. Continuation of developmental assessments. 4. Develop long term plan (10 years). 5. Social skill development and monitor peer group. Adult Management: 1. Employment services (vocational rehabilitation). 2. Social services and long-term support. 3. Monitor for substance abuse. 4. Enhance awareness in adult service systems: mental health, substance abuse, corrections. ____________________________________
SCREENING FOR ALCOHOL ABUSE TWEAK Test (Russell 1984) TOLERANCE How many drinks can you hold? If more than 5 drinks = 2 points WORRY Have close friends or relatives worried or complained about Your drinking in the past year? Yes = 2 points EYE-OPENER Do you sometimes take a drink in the morning when you first get up? Yes = 1 point AMNESIA Has a friend or family member ever told you about things you said or did while you were drinking that you could not remember? Yes = 1 point K/CUT DOWN Do you sometimes feel the need to cut down on your drinking? Yes = 1 point A score of 2 or above places the woman in a risk category and requires further assessment.
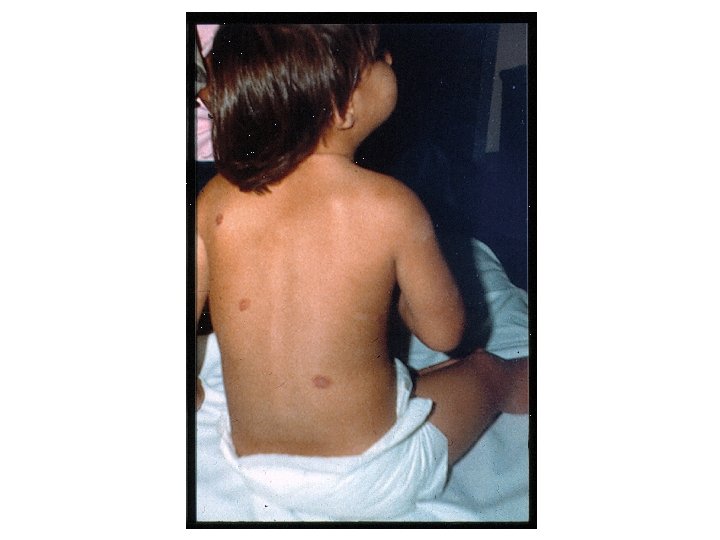
DIAGNOSTIC CRITERIA FAS AND ALCOHOL RELATED EFFECTS (3, 4, and 5 require the presumption that the finding is due to prenatal alcohol exposure) 1. FAS confirmed alcohol exposure A. confirmed maternal alcohol exposure B. characteristic facial anomalies C. growth retardation D. neurodevelopmental abnormalities 2. FAS without confirmed maternal alcohol exposure B, C, and D above 3. Partial FAS with confirmed maternal alcohol exposure A. confirmed maternal alcohol exposure B. some or partial characteristic facial features C. growth retardation D. neurodevelopmental abnormalities E. behavioral or cognitive abnormalities presumed due to prenatal alcohol exposure 4. Alcohol-Related Birth Defects (ARBD) Cardiac Ocular-Auditory Skeletal Renal 5. Other Alcohol-Related Neurodevelopmental Disorder (ARND) A. CNS neurodevelopmental abnormalities B. Complex pattern of behavior or cognitive abnormalities
Prevention of FAS 10 -18 cases of FAS born each year in ND. Treatment 50% Effective Alcohol Use & Other Risk Factors Risk of FAS Women Treated Women Quit * Cases Prevented Cost per Case Prevented 0. 01% 20, 000 1 $100, 000 . 29% 690 344 1 3, 450, 000 Heavy drinkers, low income, smokers, poor diet 4. 3% 47 23 1 235, 000 Women who have had a previous child with FAS 75% 3 1 1 15, 000 Daily Alcohol Use Heavy drinkers, middle class, non-smokers * Quit after one year.
Cases Community Assessment Prevention Plan High Risk Communities Service Systems Risk Factor Prevalence Case Demographic Data Birth Certificates Birth Certificate Data Risk Factor Prevalence Community Characteristics Prevention Plan Community Birth Certificates FAS/FAE Risk Factor Prevalence REGISTRY Parental Demographics Services Community Assessment Program Assessments EPSDT WIC Social Services Criminal Justice Special Education Mortality Previous Deaths Service Systems High Risk Community Prevention Plan Maternal-Paternal Characteristics 1. Education 2. Marital Status 3. Race 4. Prenatal Care 5. Age 1. First visit 2. Total visits 3. Number of visits in first trimester 4. Previous child deaths 5. Other risk factors Age-Cause Social Services Criminal Justice Treatment Programs Community Assessment Parents Program Reviews
40% of those who start drinking at 14 years or younger develop alcohol dependence compared with 10% of those who begin drinking at 20 years or older Rivara FP, Whitaker R, Sherman PM, Cuttler L, Influencing the Childhood Behaviors That Lead to Obesity: Role of the Pediatrician and Health Care Professional. 2003. Arch Pediatr Adolesc Med.