Electrocardiogram Dr Thouraya Said Contents 1 ECG paper


 that take place in")


 Events in the Heart During Interval Average Range PR interval")


 LV")


 Deep inspiration : Rwaves closer : fast rate")


- Slides: 37
Electrocardiogram Dr. Thouraya Said
Contents 1. ECG paper. 2. ECG leads: Limb leads. Chest leads. 3. Interpretation of the ECG. 4. Cardiac axis 5. Heart rhythm. 6. Heart rate.
• ECG records the electrical changes (depolarization and repolarization) that take place in the heart/per cycle. • These changes can be detected by electrodes attached to the surface of the body. • Subject supine, relaxed. • Temperature of the room : neutral.
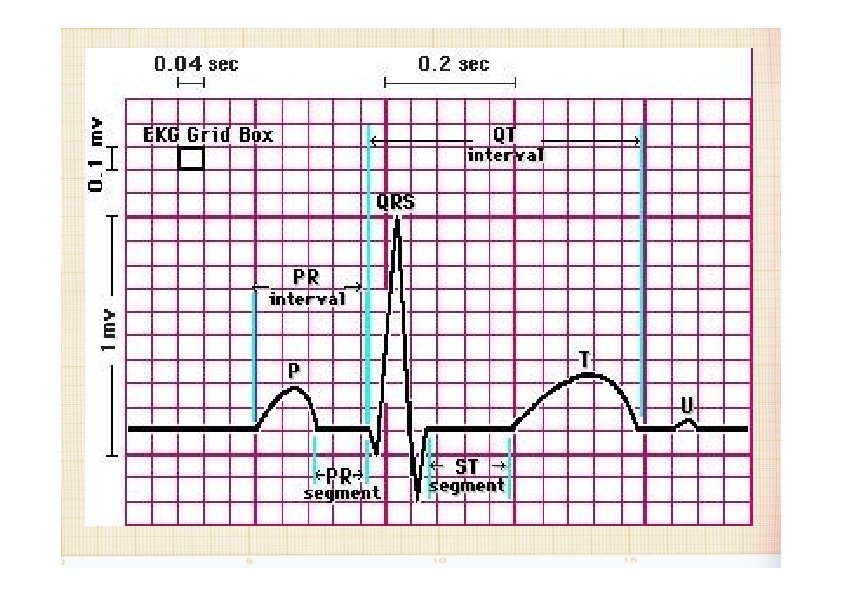
ECG Paper • The ECG is recorded on a graphic paper with standardsized squares. • The horizontal axis: time measured in seconds. 1 small square (1 mm): 0. 04 seconds 1 large square: 0. 20 seconds. 5 large squares: 1 second. • The vertical axis: changes of voltage. 10 mm = 1 cm = 1 millivolt. A signal of 1(m. V) should move the stylus vertically 1 cm (2 large squares). • The standard paper speed is 25 mm/sec.
ECG Paper
The 12 standard ECG leads • A lead is formed by a pair of electrodes. • Frontal Plane ( 6 limb leads) Bipolar Leads: I , II , and III Unipolar leads: a. VR, a. VL, a. VF • Transverse Plane: Unipolar chest leads: V 1 to V 6
3 bipolar limb leads: I, III • Record the difference in potential between 2 limbs. • ECG was first recorded by placing electrodes on 3 places: Right and Left arms and Left leg • (Recording +ve Ede) (-ve reference Ede) • Depolarization moving towards a +ve Ede produces a +ve deflection. • Depolarization moving in the opposite direction produces a –ve deflection.
• Lead I: Left arm Ede is +ve, the other is –ve. • Lead II: Edes on the right arm and the left leg with the leg +ve. • Lead III: Ede of the left arm is –ve, Ede of the left leg is +ve. • The 3 leads arranged as a triangle are known as Einthoven’s triangle.
I II III
Formation of the triaxial system & assignment of degrees to leads I, III • By bringing the sides of the triangle to the common center. • The axes are 60° apart. • Axis of a lead: direction from the negative to the positive electrode • Lead I (+) is at 0° • Lead II (+) is at +60° • Lead III (+) is at +120°
Augmented unipolar limb leads a. VR, a. VL, and a. VF Are recordings between 1 limb and the other 2 limbs. • a. VR (augmented, Voltage, Right arm +ve) • a. VL: uses left arm as +ve. • a. VF: uses left leg as +ve.
• Leads a. VR, a. VL, a. VF cross at # angles and produce an intersection of 3 other lines. • Angles of 60° like for lead I, III. a. VR-150° a. VL-30° a. VF+90
Formation of hexaxial system • Leads a. VR, a. VF, a. VL divide the angles formed by lead I, III. • The leads cross precisely at 30°.
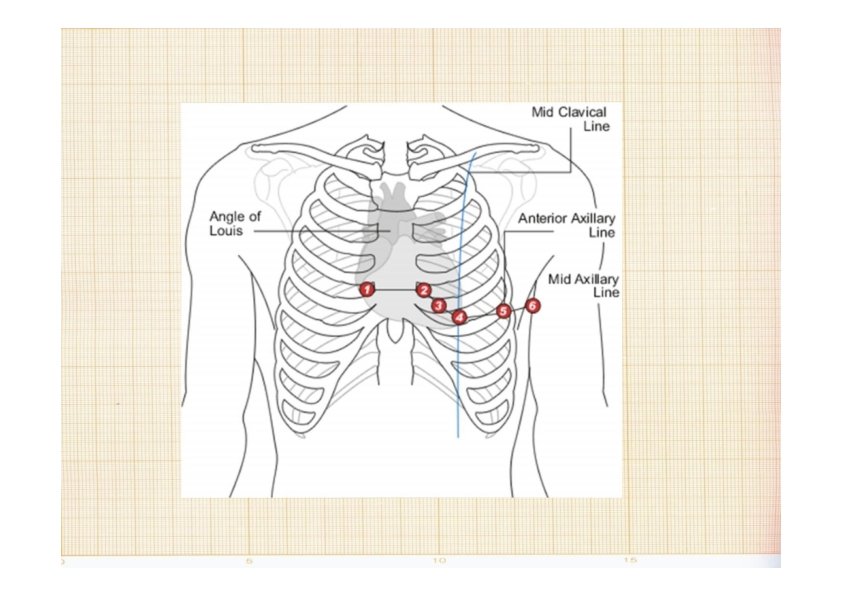
B: 6 standard “chest leads” depict electrical events in the horizontal plan e. • One +ve Ede is placed on 6 different positions around the chest. • The reference –ve Ede is a combined limb lead.
Chest leads: • V 1 – Right sternal border, 4 th ICS. • V 2 – Left sternal border, 4 th ICS. • V 3 – Halfway between leads V 2 & V 4. • V 4 – Left mid- clavicular line, 5 th ICS. • V 5 – Anterior axillary line, 5 th ICS. • V 6 – Mid axillary line, 5 th ICS.
The standard 12 -lead ECG �How many electrodes? 10 electrodes �How many leads? 12 leads
The 12 -lead ECG
Interpretation of the normal ECG • • Atrial activation: The impulse originates at SA node, spreads through the atria. This causes positive upward deflection. The P wave represents the depolarization of both atria. Pw: <0. 12 sec < 2. 5 mm
Septal Activation: • The impulse spreads to the AV node, common bundle of His and R and L bundle branches then enters the IV septum. • This occurs during PR segment.
• PR interval: P wave + PR segment. • Time of transmission of electrical impulse from the beginning of atrial depolarization to the beginning of ventricular depolarization. • PR: 0. 12 - 0. 20 seconds (less than 1 large square). • PR prolonged > 0. 20 seconds. First degree heart block. • PR shortens as heart rate increases.
Ventricular depolarization • The wave of depolarization spreads in the Purkinje fibers to all parts of the ventricles. • The initial negative deflection is Q wave. • The first positive deflection is R wave. • The negative deflection after R wave is : S wave. • QRS duration: < 0. 10 sec.
Ventricular repolarization: T wave • Ventricular repolarization represented by ST segment and T wave. • ST segment: period between the end of QRS and the start of T wave. • QT interval: from beginning of Q wave to end of T wave (ventricular dep and rep) < 0. 43 sec. • ST interval: QT-QRS = 0. 32 sec.
ECG intervals Normal Duration(s) Events in the Heart During Interval Average Range PR interval Pw + PR segment. 0. 18 0. 12 -0. 20 < 1 large square Atrial depolarization and conduction through AV node QRS duration 0. 08 To 0. 10 Ventricular depolarization and atrial repolarization QT interval 0. 40 To 0. 43 Ventricular depolarization plus ventricular repolarization ST interval (QT minus QRS) 0. 32 … Intervals Ventricular repolarization
Examples of ECG abnormalities • Prominent U wave: hypokalaemia. • Tall T wave: hyperkalaemia. • Short QT interval: hypercalcaemia. • Prolonged QT interval: hypocalcaemia. • ST elevation, T inversion, large Q wave: myocardial infarction.
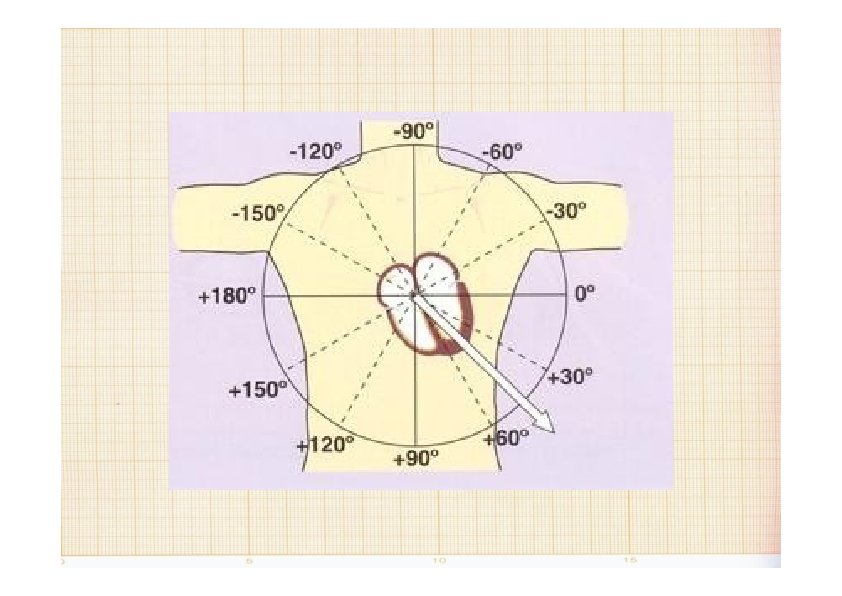
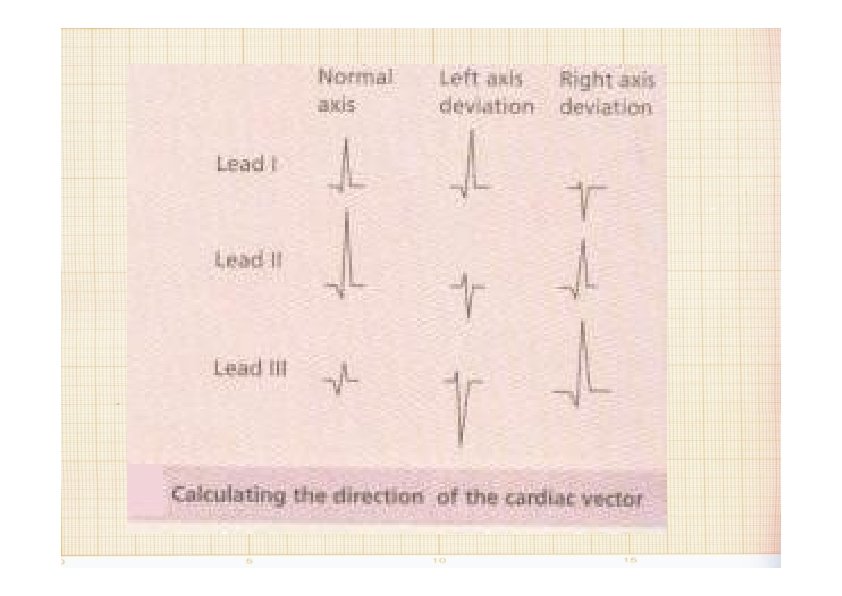
Cardiac axis • The mean QRS vector is the preponderant direction of the potential during depolarization. • The mean electrical axis of the ventricles is 59°.
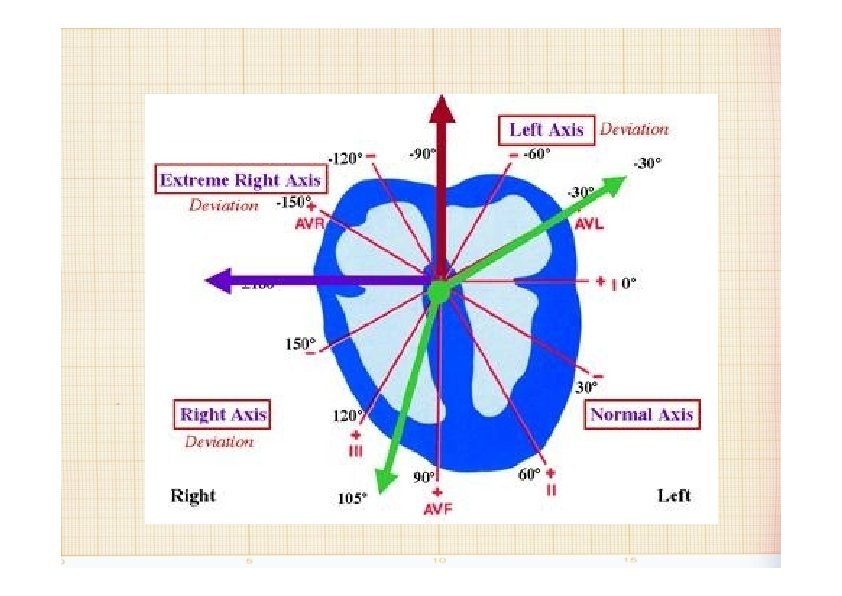
Normal Axis: from -30 ° to +90 ° Left Axis Deviation: Obese (normal) LV hypertrophy LBBB from -30 ° to -90 ° Right Axis Deviation: Thin tall (normal) R V hypertrophy RBBB Extreme Right Axis Deviation: from + 90° to ± 180 ° from -90 ° to ± 180°
Inspection method RIGHT AXIS DEVIATION
Rythm Sinus rhythm: P wave before every QRS: Impulse from SA node Sinus Regular : distance between R-R: constant R R Irregular : Unequal R-R intervals
Rythm Sinus arrythmia (normal physiological phenomenon) Deep inspiration : Rwaves closer : fast rate Deep expiration: bradycardia
Heart rate Examine the distance between QRS complexes. If the distances are regular, use one of these two formulas: 300 Big squares between R-R Or: 1500 Small squares between R-R To obtain the heart rate in beats per minute.
1 complex every 1 major division = 300/min 1 complex every 2 major divisions = 150/min 1 complex every 3 major divisions = 100/min 1 complex every 4 major divisions = 75/min 1 complex every 5 major divisions = 60/min 1 complex every 6 major divisions = 50/min