Electrocardiogram ECG Basics interpretation Manal Alramly MSN RN
 Basics interpretation Manal Alramly, MSN, RN Sondos Eqylan, MSN, RN Adult (1)")
Electrocardiogram (ECG) Basics interpretation Manal Alramly, MSN, RN Sondos Eqylan, MSN, RN Adult (1) Clinical 2019 -2020

Objectives By the end of this session the students will be able to: Review Structures and Functions of Cardiovascular System, and conduction system Recognize ECG different waves and segments. Review ECG lead placement Recall the 12 ECG leads, location and view of the heart wall Analyze an ECG strip reporting: heart rate, rhythm, intervals, segments, and waves. Define the characteristics of: normal sinus rhythm Recognize sinus bradycardia, and sinus tachycardia. Recognize significant ischemic myocardial changes as reflected on the ECG. 2

Structures and Functions of Cardiovascular System Heart Four is located in the mediastinum area chambers Composed of three layers 1 - Endocardium (endothelial tissue lines inside the heart and valves) 2 - Myocardium (muscle fiber responsible of pumping action) 3 - Epicardium (serous outer layer of the heart) Pericardium Left (visceral and parietal) ventricular wall 2 -3 times thicker than right

Cardiac Chambers and Valves

Conduction System

Cardiac Conduction System

Primary Cardiac Cell Characteristics Automaticity – ability of the cardiac cells to initiate an electrical impulse (spontaneous electrical conduction) Excitability - ability to respond to electrical impulse Conductivity – ability to transmit message or electrical impulse from one cell to another

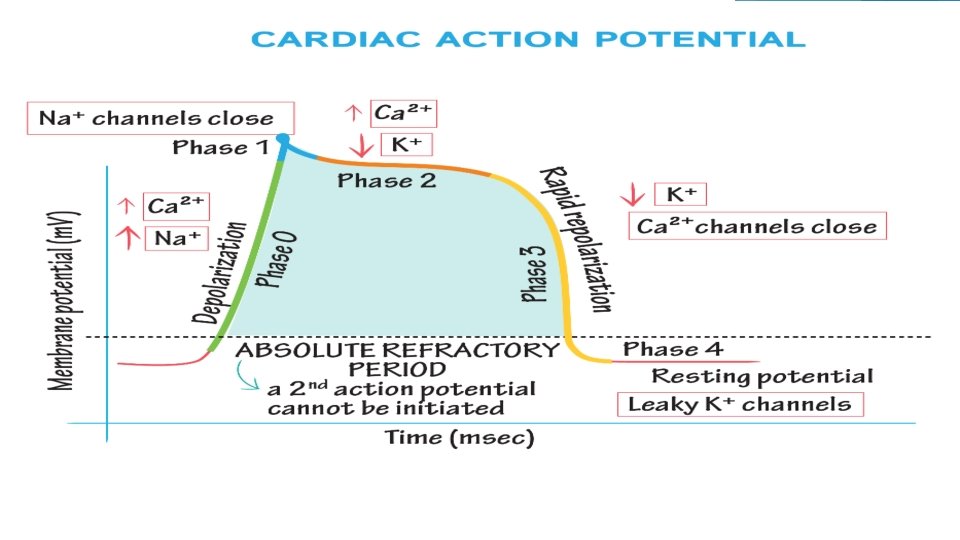
Electrical and Mechanical activities Depolarization: electrical activation of cell caused by influx of sodium into cell while potassium exits cell Repolarization: return of cell to resting state by efflux of potassium outward cell. Electrical contraction = Depolarization Electrical relaxation= Repolarization Mechanical contraction = systole Mechanical relaxation = diastole

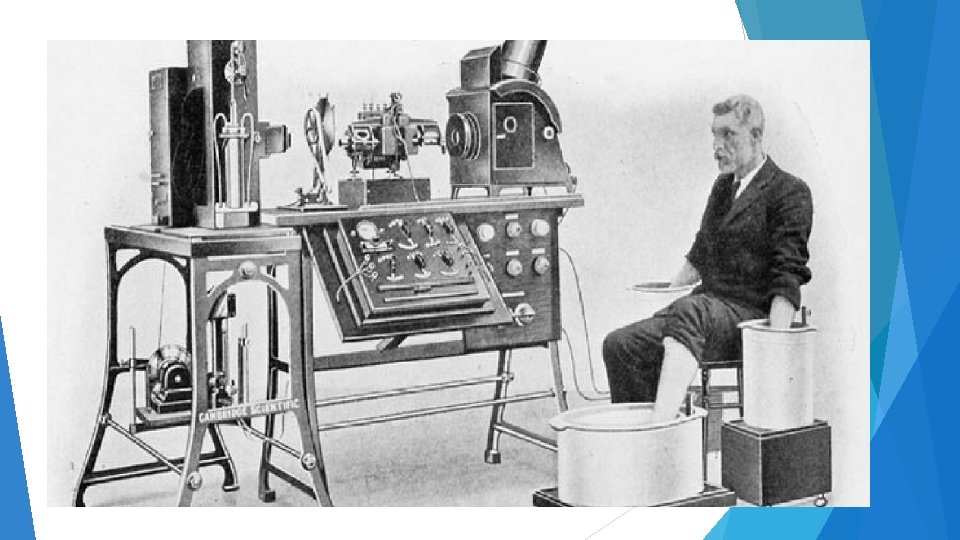
Willem Einthoven

ECG Paper measurement
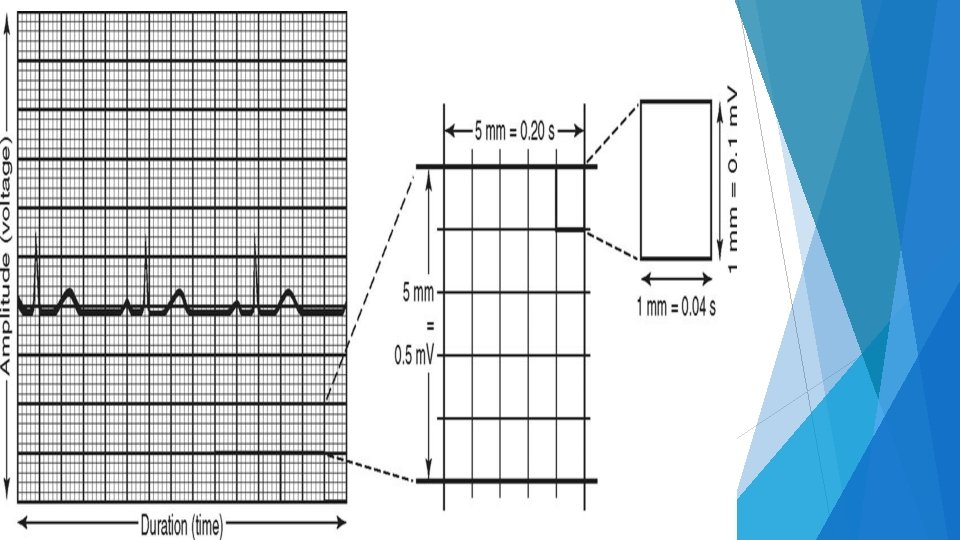
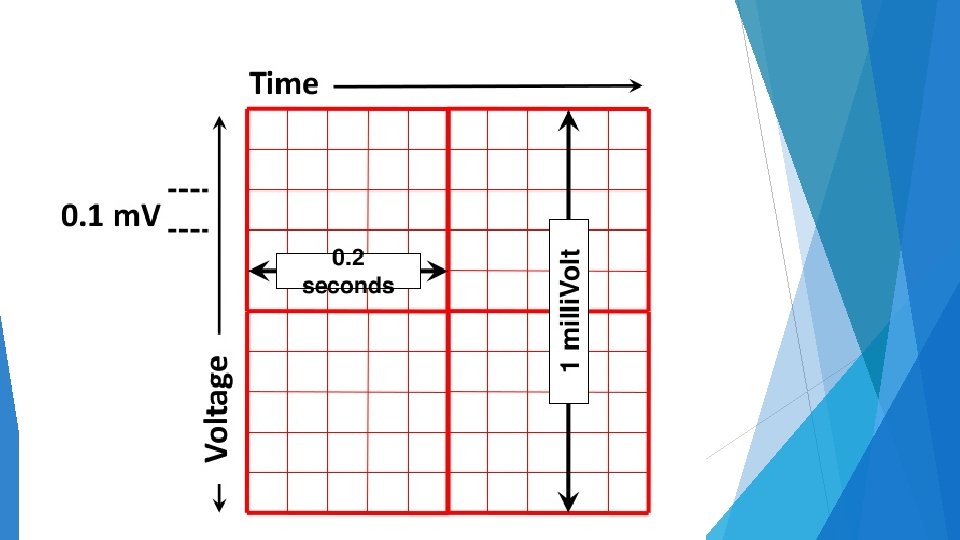

ECG Paper measurement ECG Paper ECG paper is traditionally divided into 1 mm squares Vertically, ten blocks (small Box) usually correspond to 1 m. V. The horizontal axis of the paper speed is usually 25 mm/s. Each large square( Box) consists of five small squares. Each large square ( Box) equals 0. 2 second. Each small square ( Box) equals 0. 04 second. 16

Always check the calibration voltage on the ECG, speed 25 mm per second The following image shows the normal 1 m. V calibration spike 17

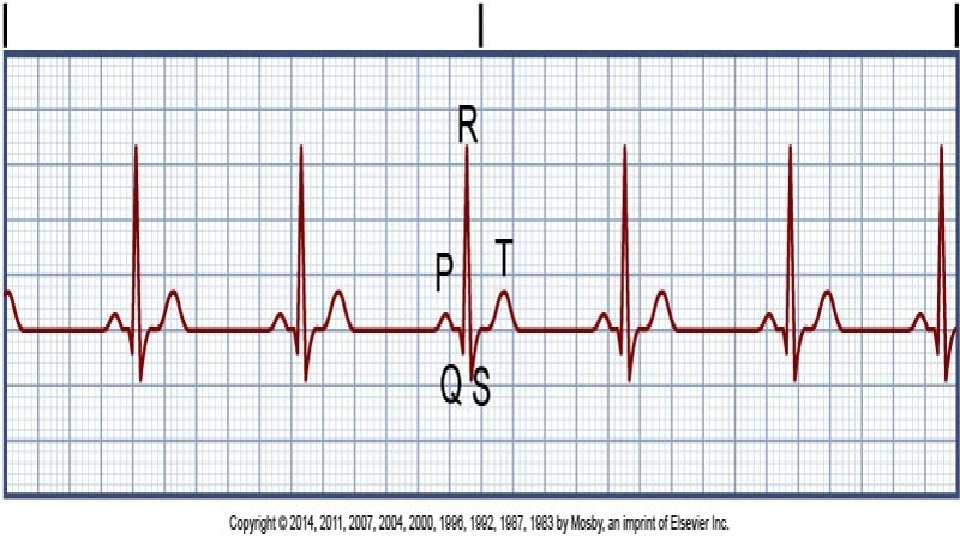
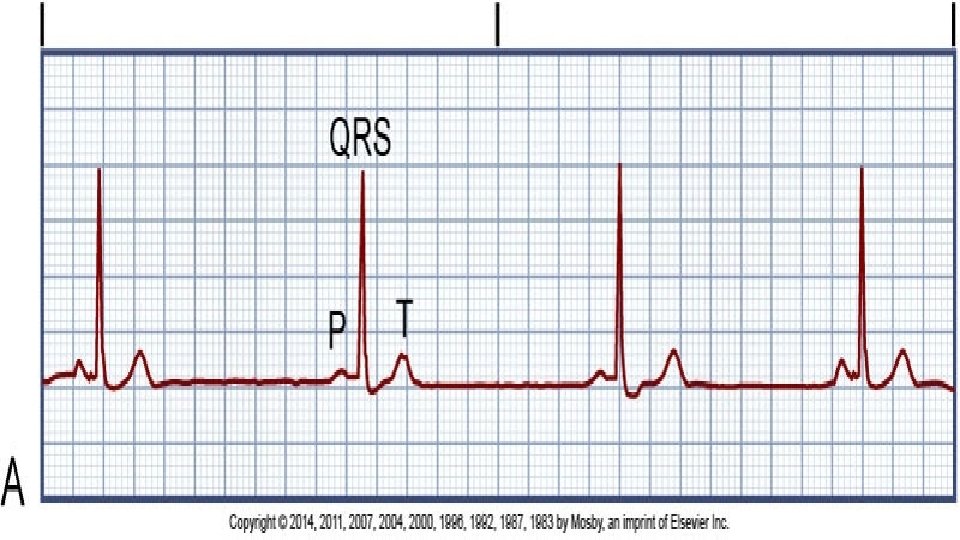
Waves, Intervals, Segments 18
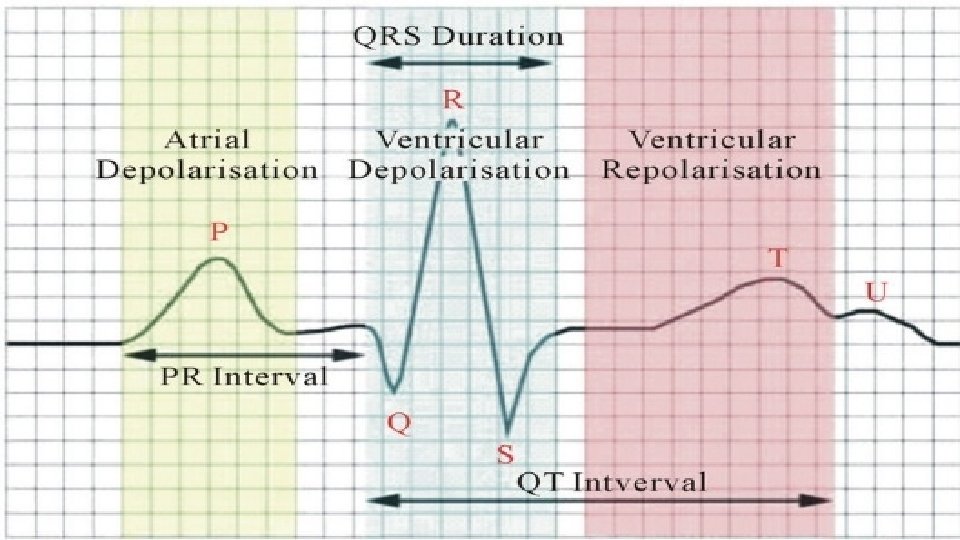
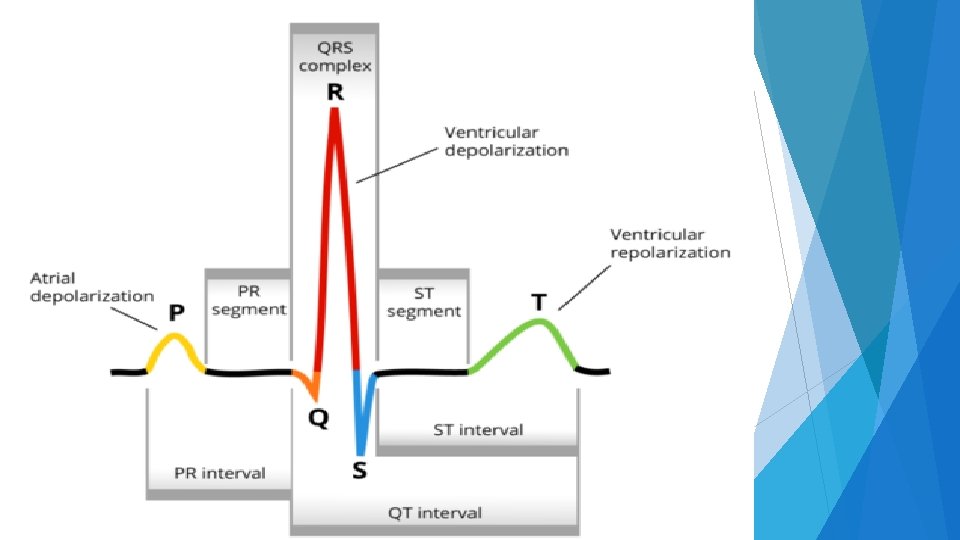

Waves, Intervals, Segments P wave: Represents atrial depolarization Round, upward deflection Duration =or< 0. 11 seconds. Amplitude =or< 2. 5 mm high. 22

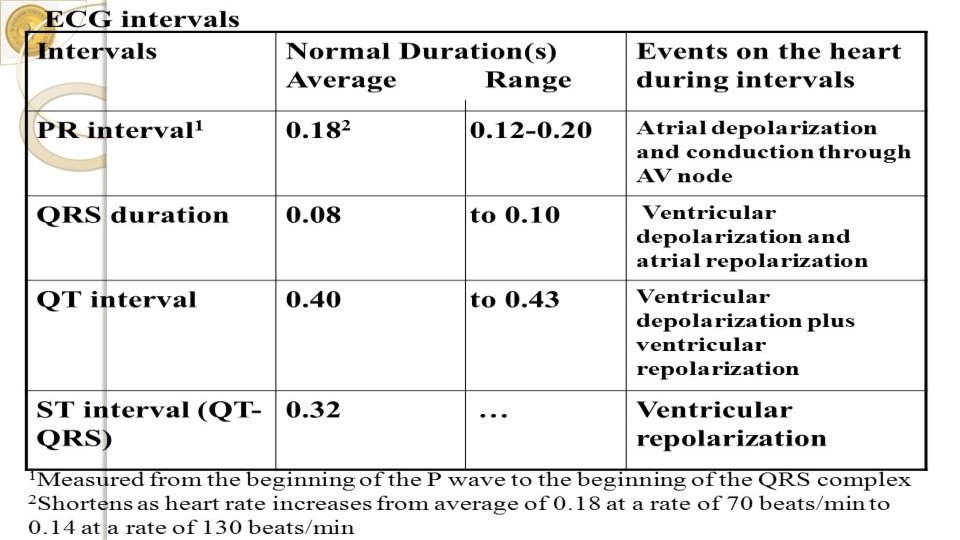
Waves, Intervals, Segments PR interval: Start at p wave to begin of QRS complex Represents time for atrial depolarization( the duration of time required for an electrical impulse to spread from the SA node, through the atrial muscle and the delay of impulse in the AV node before ventricular depolarization. Duration: 0. 12 - 0. 2 second (3 -5 small squares). 23

Waves, Intervals, Segments Q wave: Duration <0. 03 sec. Amplitude less than 25% of the R wave. QRS complex: Represents Duration Narrow ventricular depolarization. : 0. 06 – 0. 10 second, less than 3 small squares complex Widening occurs when the ventricles become hypertrophied or when there is disease involving the bundle branches or their fascicles. 24

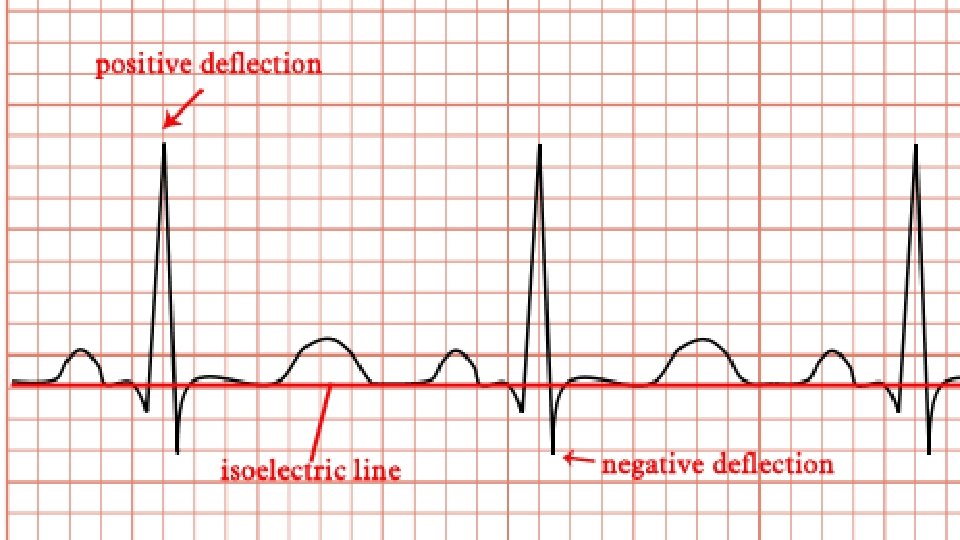
Waves, Intervals, Segments T wave: Represents ventricular Repolarization. Deflection T as the QRS complex direction. wave inversion indicate Myocardium Ischemia. ST segment: Early End ventricular Repolarization of S to begin of T wave. Normally on the isoelectric line Isoelectric line: is a reference line extending horizontally between the bases of the P and T waves. 25

Waves, Intervals, Segments QT Interval: Total time for ventricular depolarization and repolarization. From the beginning of the Q wave to the end of the T wave. Vary with heart rate, faster heart rate leads to shorter QT. QT interval: 0. 32 -0. 40 seconds. 26
 and")
Twelve Leads ECG Electrodes placement: six limb leads (three standard and three augmented) and six precordial leads. Twelve Leads. - Six leads are chest leads from V 1 to V 6 extending across the pericordium. - Three standard bipolar limb leads which are : I, III. - Three augmented voltage unipolar limb leads which are: AVR, AVL, AVF. 27
 V 1: 4 th Intercostal space at right sternal border V")
Lead placement( pericardium) V 1: 4 th Intercostal space at right sternal border V 2: 4 th Intercostal space at left sternal border V 3: Midway between V 2 and V 4: 5 th Intercostal space at left Midclavicular line V 5: 5 th Intercostal space at left anterior axillary line Anterior -axillary line V 6: 5 th Intercostal space at left mid axillary line Mid-axillary line 28

29

Copyright © 2014 by Mosby, an imprint of Elsevier Inc.
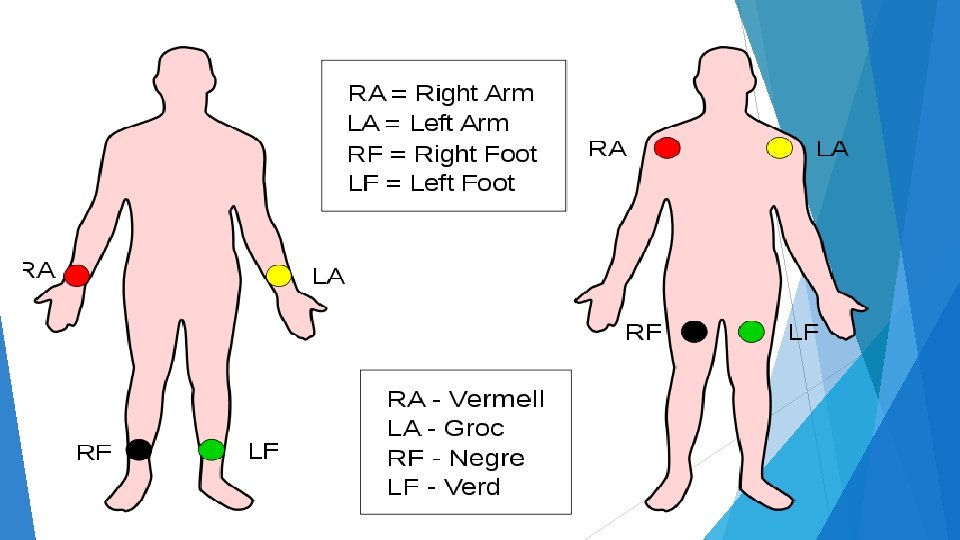
 Use the color for lead placement; Read= (red) right arm")
Lead placement( limb lead) Use the color for lead placement; Read= (red) right arm (AVR) Your= (yellow ) left arm (AVL) Green= (green) left foot (AVF) Book= (black) right foot (for grounding/earthing) 31
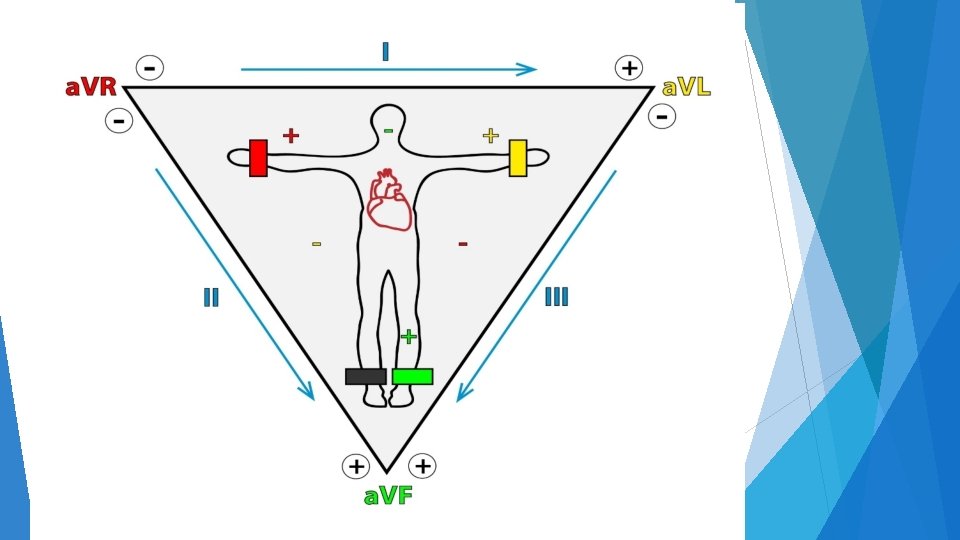
 Lead I: will measure the electrical potential differences between AVR")
Lead placement( limb lead) Lead I: will measure the electrical potential differences between AVR and AVL Lead II: will measure the electrical potential differences between AVR and AVF Lead III: will measure the electrical potential differences between AVL and AVF. 34

Copyright © 2014 by Mosby, an imprint of Elsevier Inc.

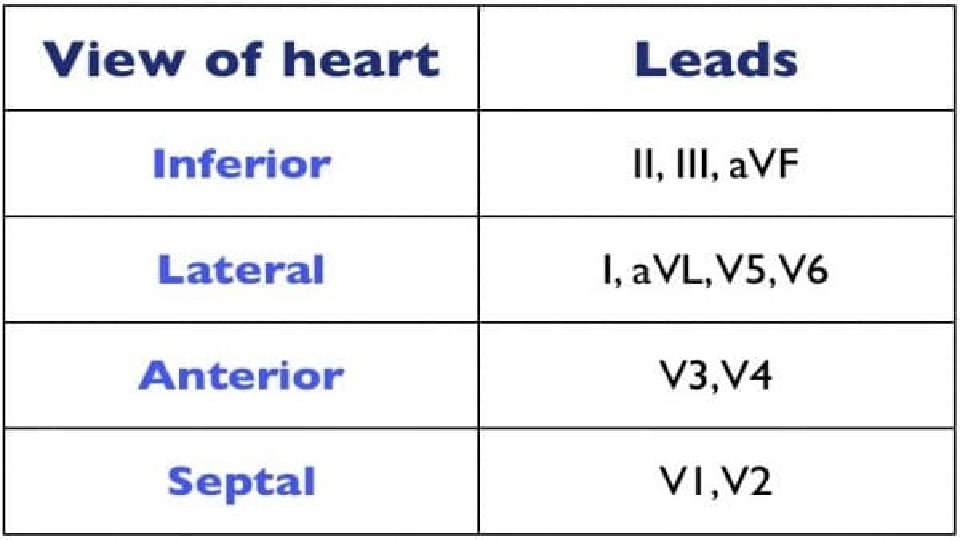
ECG leads and Anatomic Groups 36

37

38

Break
 2. Rate 3. P wave")
Assessment of Cardiac Rhythm 1. Regularity (Regular or Irregular) 2. Rate 3. P wave 4. QRS complex 5. P wave : QRS complex 6. T wave 7. P-R interval (0. 12 -0. 2 sec) 8. QRS complex width (0. 06 -0. 10 sec) 9. ST segment 10. Q-T interval (0. 32 -0. 40 sec)
 1. Rhythm = Regular 2. Rate = 60")
Criteria for Normal Sinus Rhythm (NSR) 1. Rhythm = Regular 2. Rate = 60 -100 beat / minute. 3. Presence of P, QRS, T in each cycle. 4. P : QRS ratio = 1 : 1 5. Normal shape, time of waves, segments and intervals 6. absence of Acute ST-T changes 42
 300/10 =60/10")
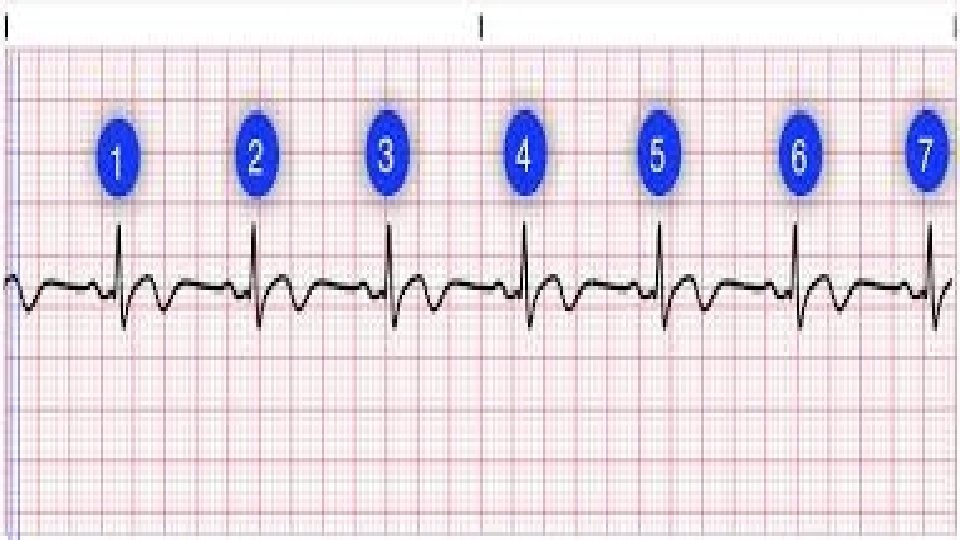
Heart Rate Calculation 300 Large boxes = 60 seconds (1 min. ) 300/10 =60/10 30 Large boxes = 6 seconds 15 Large boxes =3 sec. 1 - Regular ECG HR = 300/ number of large squares between R-R interval or HR = 1500/ number of small squares between R-R ( more precise ) HR = 1500/30 = 50 b/m ; HR = 300/6 = 50 b/m ( note R-R intervals are equal) 44

Heart Rate Calculation 45

Heart Rate Calculation Irregular ECG - Take a rhythm strip for 6 seconds which corresponds to 30 large squares. - Count the number of R-R interval in the 6 second strip and multiply the number by 10 - Example HR = 8*10 = 80 beat/minute. 46

Sinus Bradycardia Normal sinus rhythm except rate < 60 bm causes = athletes, myocardial infraction. 48

50

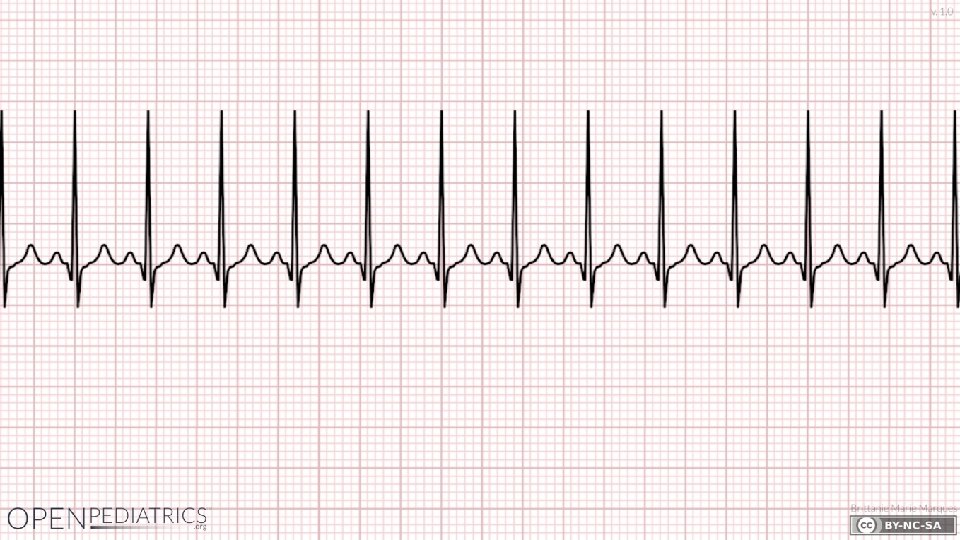
Sinus Tachycardia Normal sinus rhythm except rate > 100 bm causes: exercise, stress, CHF, lung disease and hyperthyroidism. 51

52

Arrhythmias Definition of arrhythmias : Any disturbance in the rate, regularity, site or origin, or conduction of cardiac electrical impulse. It can be single beat or sustained rhythm. Clinical Manifestations: v Palpitation. v Light headedness and syncope R/T low cardiac output. v Angina R/T increased O 2 demand. v Sudden death. 54
![Arrhythmias Causes: [ HISDEBS ] H = Hypoxia. I = Ischemia. S = Sympathetic](http://slidetodoc.com/presentation_image_h2/5e1578b6439c1c72fff70ec63b49b737/image-55.jpg "Arrhythmias Causes: [ HISDEBS ] H = Hypoxia. I = Ischemia. S = Sympathetic")
Arrhythmias Causes: [ HISDEBS ] H = Hypoxia. I = Ischemia. S = Sympathetic stimulation. D = Drugs. E = Electrolyte disturbances. B = Bradycardia. S = Stretch = cardiac enlargement 55

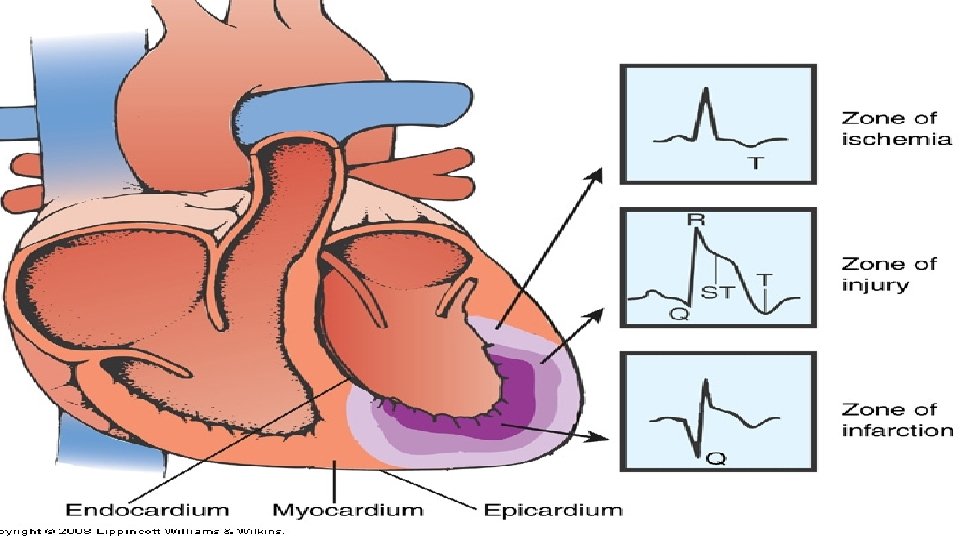
ECG ischemic Changes ECG * * * - ischemic Changes ST segment depression T inversion ST elevation Cardiac Ischemia: decreased coronary blood flow to the myocardium which could lead to tissue injury and necrosis ( tissue death ). 56
 or T inversion: Myocardium")
ST Depression (MORE THAN 1 mm FROM Iso-Electric Line) or T inversion: Myocardium Ischemia ST Elevation (MORE THAN 1 mm FROM Iso-Electric Line): Myocardium injury ST Elevation (MORE THAN 1 mm FROM Iso-Electric Line) and pathological Q wave : Myocardium Infarction

Changes Associated With Myocardial Ischemia Copyright © 2014 by Mosby, an imprint of Elsevier Inc.

Changes Associated With Infarction Copyright © 2014 by Mosby, an imprint of Elsevier Inc.
 Injury ST-segment elevation occurs Significant if")
ECG Changes Associated With Acute Coronary Syndrome (ACS) Injury ST-segment elevation occurs Significant if >1 mm above the isoelectric line If treatment is prompt and effective, may avoid or limit infarction Absence of serum cardiac markers confirms no infarction Infarction Physiologic Q wave is the first negative deflection following the P wave Small and narrow (<0. 04 second in duration) Pathologic Q wave is deep and >0. 03 second in duration

ECG Finding With Anterolateral Wall MI Copyright © 2014 by Mosby, an imprint of Elsevier Inc.

Copyright © 2014 by Mosby, an imprint of Elsevier Inc.

Thank you
- Slides: 66