ECE 454 Computer Systems Programming Measuring and Profiling

- Slides: 26

ECE 454 Computer Systems Programming Measuring and Profiling Ashvin Goel ECE Dept, University of Toronto http: //www. eecg. toronto. edu/~ashvin

“It is a capital mistake to theorize before one has data. Insensibly one begins to twist facts to suit theories instead of theories to suit facts. ” Sherlock Holmes 2

Measuring Programs and Computers 3

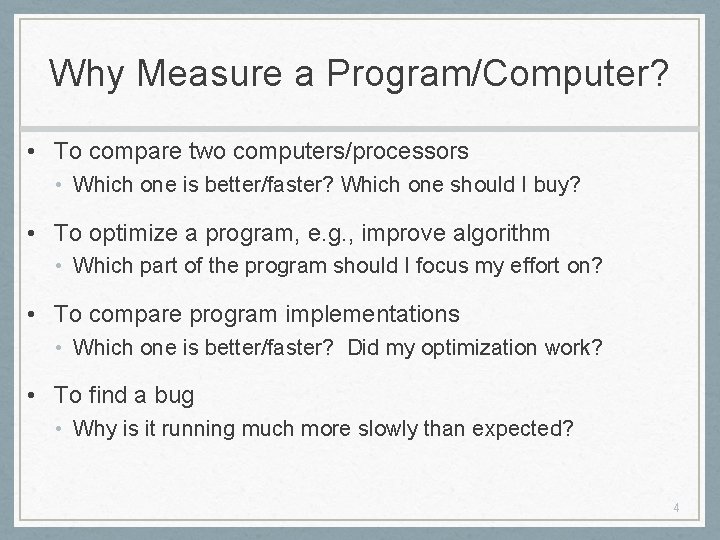
Why Measure a Program/Computer? • To compare two computers/processors • Which one is better/faster? Which one should I buy? • To optimize a program, e. g. , improve algorithm • Which part of the program should I focus my effort on? • To compare program implementations • Which one is better/faster? Did my optimization work? • To find a bug • Why is it running much more slowly than expected? 4

Basic Measurements • IPS: instructions per second • MIPS: millions of IPS, BIPS: billions of IPS • FLOPS: floating point operations per second • mega. FLOPS: 106 FLOPS • giga. FLOPS: 109 FLOPS, Playstation 3 capable of 20 GFLOPS • IPC: instructions per processor-cycle • Measure of throughput • CPI: cycles per instruction, CPI = 1 / IPC • Measure of reciprocal of throughput • Makes it easier to compare with latency of instructions 5

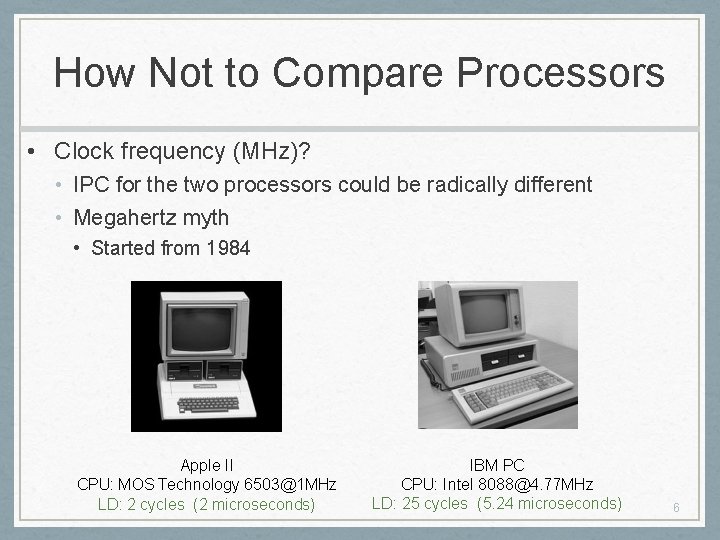
How Not to Compare Processors • Clock frequency (MHz)? • IPC for the two processors could be radically different • Megahertz myth • Started from 1984 Apple II CPU: MOS Technology 6503@1 MHz LD: 2 cycles (2 microseconds) IBM PC CPU: Intel 8088@4. 77 MHz LD: 25 cycles (5. 24 microseconds) 6

How Not to Compare Processors • Clock frequency (MHz)? • IPC for the two processors could be radically different • CPI/IPC? • Dependent on instruction sets used • Dependent on efficiency of code generated by compiler • FLOPS? • Only if FLOPS are important for the expected applications • Also dependent on instruction set used 7

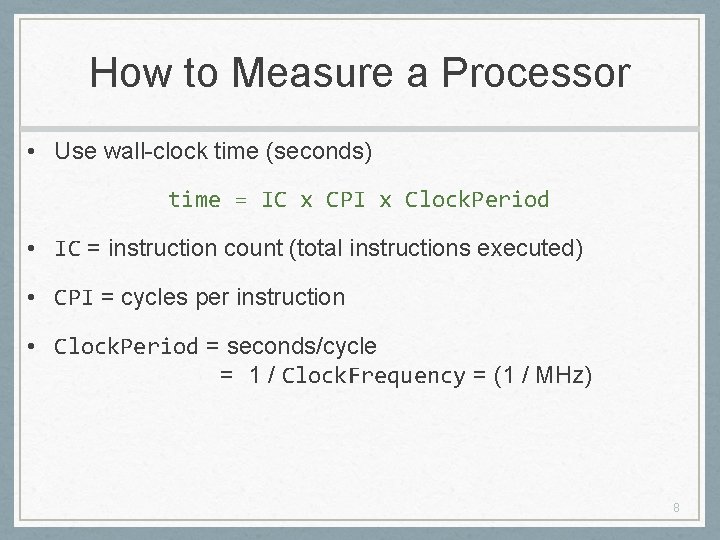
How to Measure a Processor • Use wall-clock time (seconds) time = IC x CPI x Clock. Period • IC = instruction count (total instructions executed) • CPI = cycles per instruction • Clock. Period = seconds/cycle = 1 / Clock. Frequency = (1 / MHz) 8

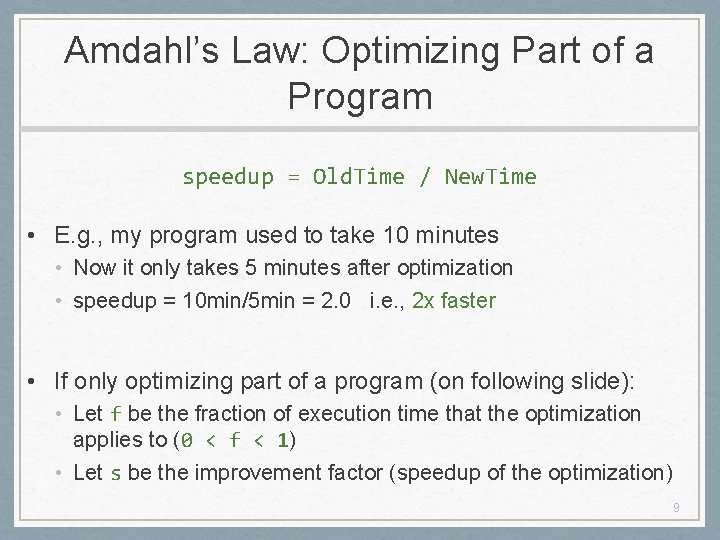
Amdahl’s Law: Optimizing Part of a Program speedup = Old. Time / New. Time • E. g. , my program used to take 10 minutes • Now it only takes 5 minutes after optimization • speedup = 10 min/5 min = 2. 0 i. e. , 2 x faster • If only optimizing part of a program (on following slide): • Let f be the fraction of execution time that the optimization applies to (0 < f < 1) • Let s be the improvement factor (speedup of the optimization) 9

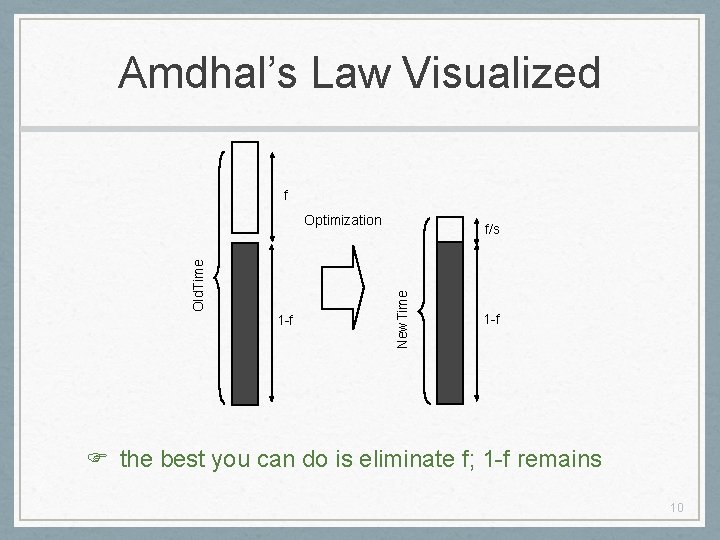
Amdhal’s Law Visualized f 1 -f f/s New. Time Old. Time Optimization 1 -f the best you can do is eliminate f; 1 -f remains 10

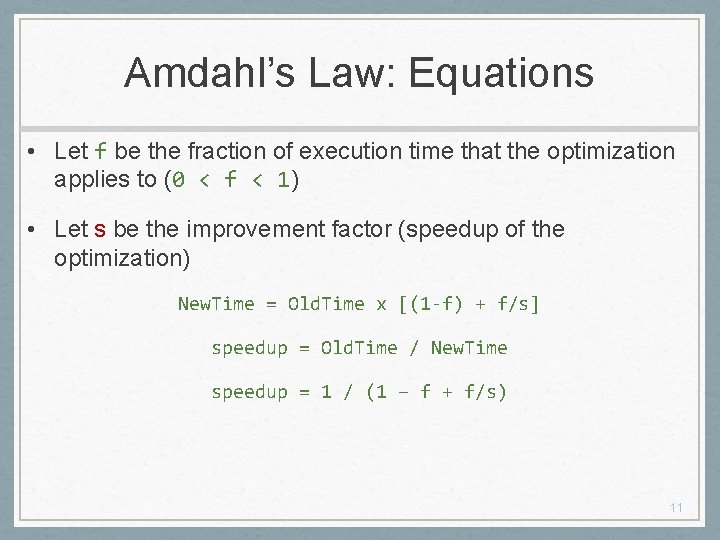
Amdahl’s Law: Equations • Let f be the fraction of execution time that the optimization applies to (0 < f < 1) • Let s be the improvement factor (speedup of the optimization) New. Time = Old. Time x [(1‐f) + f/s] speedup = Old. Time / New. Time speedup = 1 / (1 – f + f/s) 11

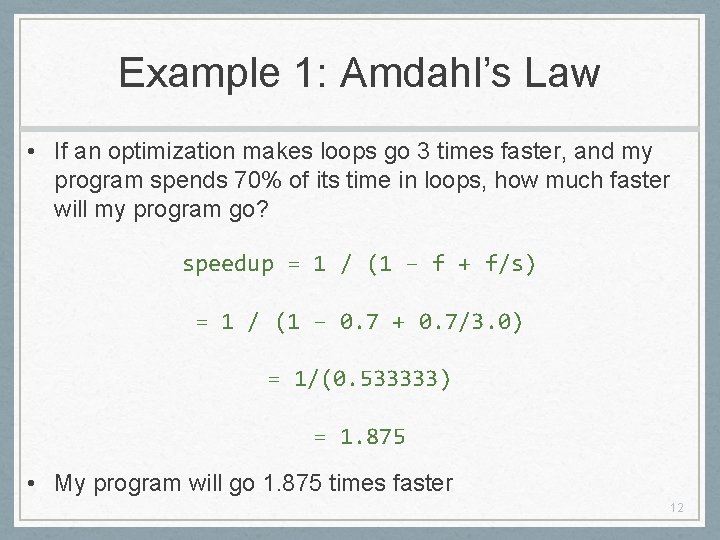
Example 1: Amdahl’s Law • If an optimization makes loops go 3 times faster, and my program spends 70% of its time in loops, how much faster will my program go? speedup = 1 / (1 – f + f/s) = 1 / (1 – 0. 7 + 0. 7/3. 0) = 1/(0. 533333) = 1. 875 • My program will go 1. 875 times faster 12

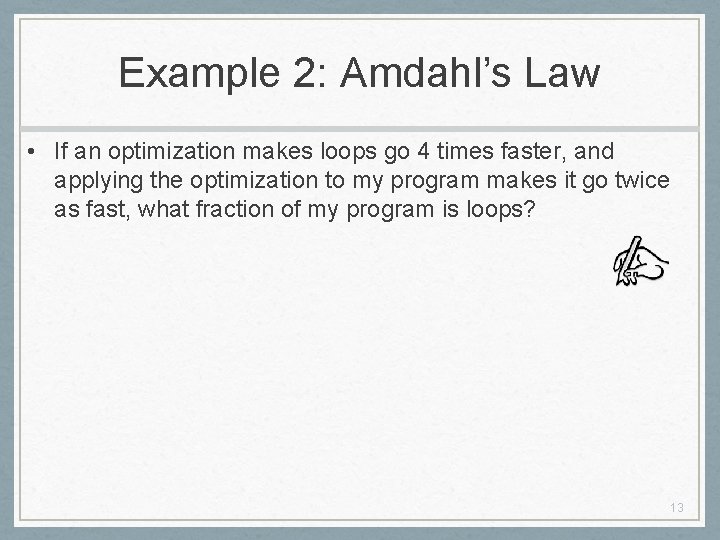
Example 2: Amdahl’s Law • If an optimization makes loops go 4 times faster, and applying the optimization to my program makes it go twice as fast, what fraction of my program is loops? 13

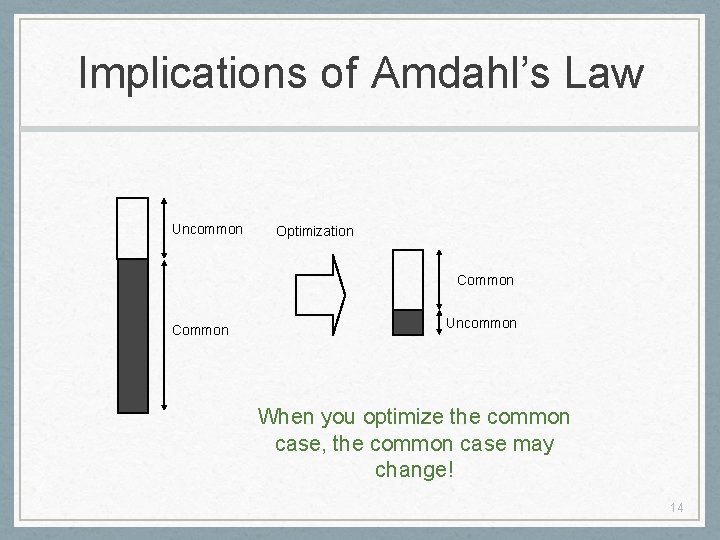
Implications of Amdahl’s Law Uncommon Optimization Common Uncommon When you optimize the common case, the common case may change! 14

Tools for Measuring and Understanding Software 15

Tools for Measuring/Understanding • Software timers • C library and OS-level timers • Hardware timers and performance counters • Built into the processor chip • Instrumentation • Decorates your program with code that counts & measures • gprof – profiling tool, outputs where time is spent in program • gcov – coverage tool, outputs how many times each line executed • Used together to find commonly executed code where time should be spent on optimization 16

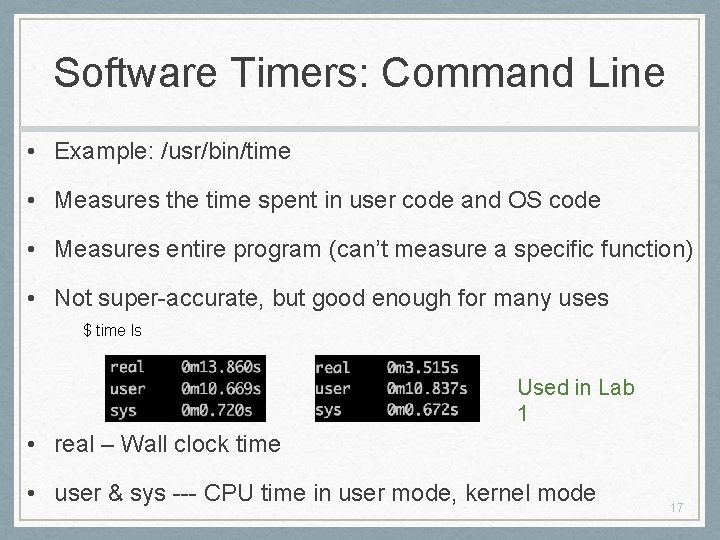
Software Timers: Command Line • Example: /usr/bin/time • Measures the time spent in user code and OS code • Measures entire program (can’t measure a specific function) • Not super-accurate, but good enough for many uses $ time ls Used in Lab 1 • real – Wall clock time • user & sys --- CPU time in user mode, kernel mode 17

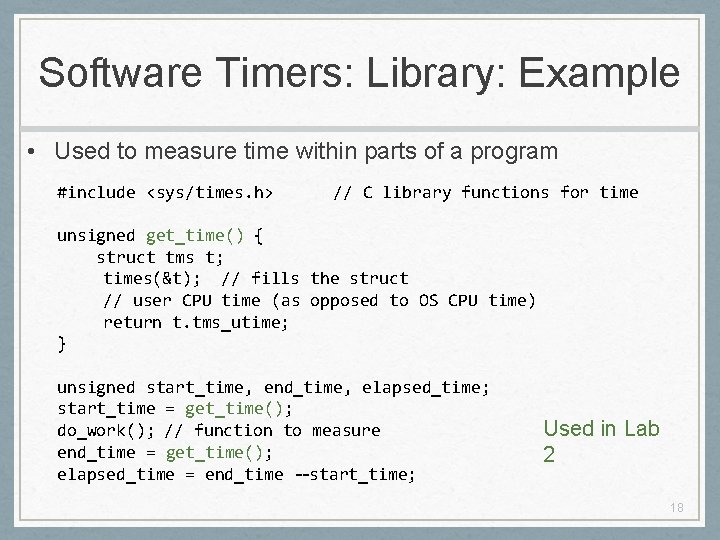
Software Timers: Library: Example • Used to measure time within parts of a program #include <sys/times. h> // C library functions for time unsigned get_time() { struct tms t; times(&t); // fills the struct // user CPU time (as opposed to OS CPU time) return t. tms_utime; } unsigned start_time, end_time, elapsed_time; start_time = get_time(); do_work(); // function to measure end_time = get_time(); elapsed_time = end_time ‐‐start_time; Used in Lab 2 18

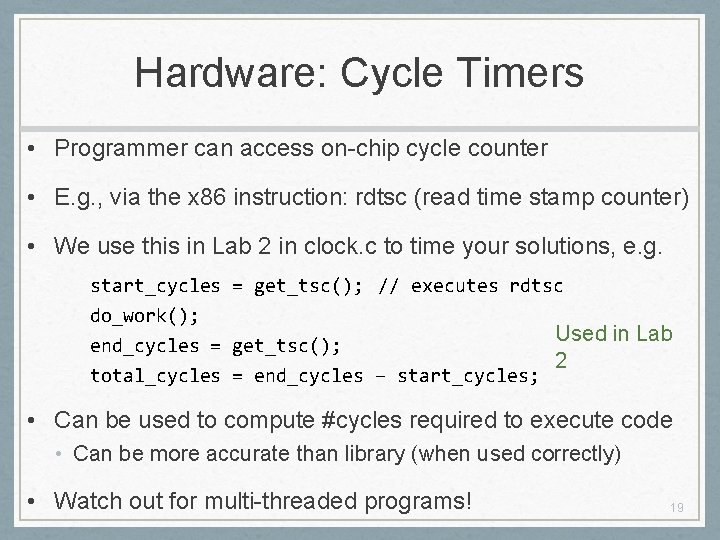
Hardware: Cycle Timers • Programmer can access on-chip cycle counter • E. g. , via the x 86 instruction: rdtsc (read time stamp counter) • We use this in Lab 2 in clock. c to time your solutions, e. g. start_cycles = get_tsc(); // executes rdtsc do_work(); Used in Lab end_cycles = get_tsc(); 2 total_cycles = end_cycles – start_cycles; • Can be used to compute #cycles required to execute code • Can be more accurate than library (when used correctly) • Watch out for multi-threaded programs! 19

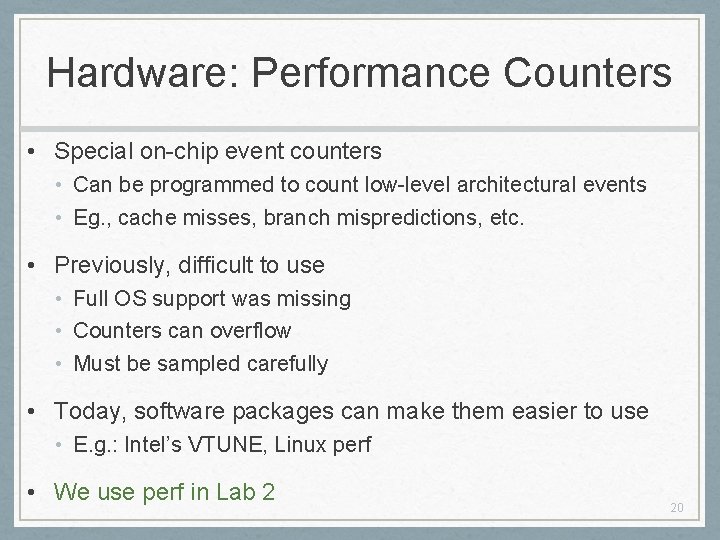
Hardware: Performance Counters • Special on-chip event counters • Can be programmed to count low-level architectural events • Eg. , cache misses, branch mispredictions, etc. • Previously, difficult to use • Full OS support was missing • Counters can overflow • Must be sampled carefully • Today, software packages can make them easier to use • E. g. : Intel’s VTUNE, Linux perf • We use perf in Lab 2 20

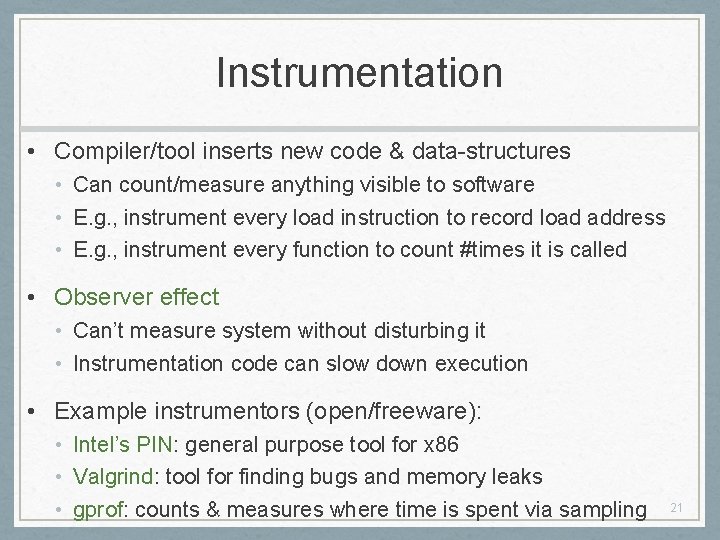
Instrumentation • Compiler/tool inserts new code & data-structures • Can count/measure anything visible to software • E. g. , instrument every load instruction to record load address • E. g. , instrument every function to count #times it is called • Observer effect • Can’t measure system without disturbing it • Instrumentation code can slow down execution • Example instrumentors (open/freeware): • Intel’s PIN: general purpose tool for x 86 • Valgrind: tool for finding bugs and memory leaks • gprof: counts & measures where time is spent via sampling 21

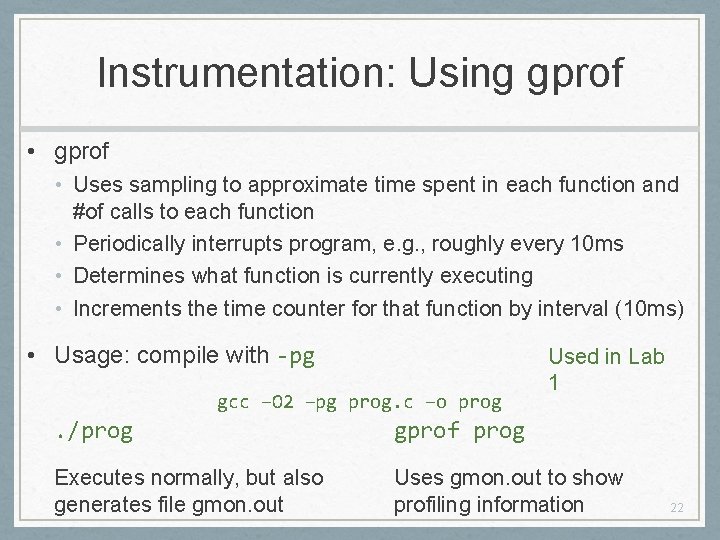
Instrumentation: Using gprof • Uses sampling to approximate time spent in each function and #of calls to each function • Periodically interrupts program, e. g. , roughly every 10 ms • Determines what function is currently executing • Increments the time counter for that function by interval (10 ms) • Usage: compile with ‐pg gcc –O 2 –pg prog. c –o prog Used in Lab 1 . /prog gprof prog Executes normally, but also generates file gmon. out Uses gmon. out to show profiling information 22

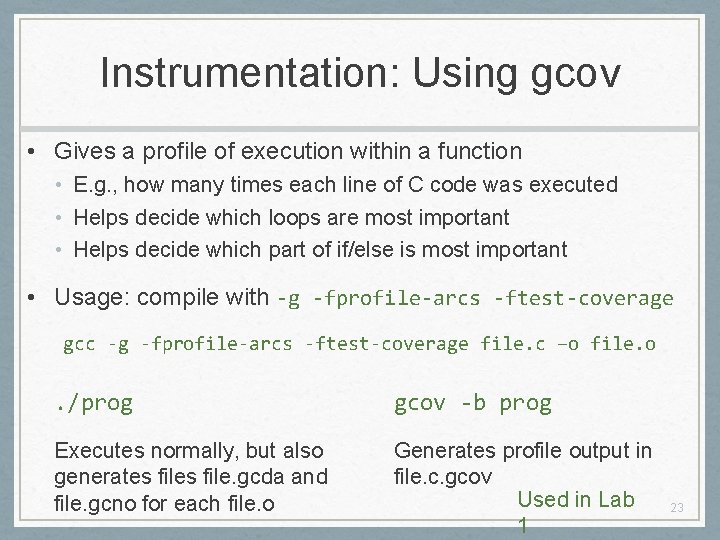
Instrumentation: Using gcov • Gives a profile of execution within a function • E. g. , how many times each line of C code was executed • Helps decide which loops are most important • Helps decide which part of if/else is most important • Usage: compile with ‐g ‐fprofile‐arcs ‐ftest‐coverage gcc ‐g ‐fprofile‐arcs ‐ftest‐coverage file. c –o file. o . /prog gcov ‐b prog Executes normally, but also generates file. gcda and file. gcno for each file. o Generates profile output in file. c. gcov Used in Lab 1 23

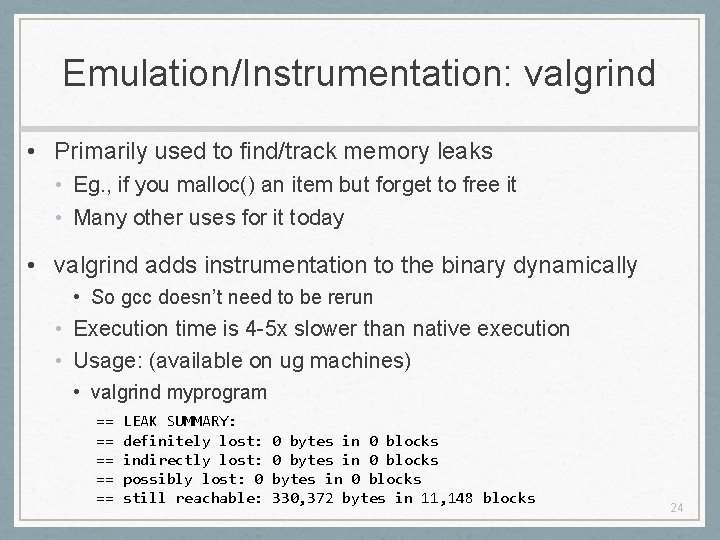
Emulation/Instrumentation: valgrind • Primarily used to find/track memory leaks • Eg. , if you malloc() an item but forget to free it • Many other uses for it today • valgrind adds instrumentation to the binary dynamically • So gcc doesn’t need to be rerun • Execution time is 4 -5 x slower than native execution • Usage: (available on ug machines) • valgrind myprogram == == == LEAK SUMMARY: definitely lost: indirectly lost: possibly lost: 0 still reachable: 0 bytes in 0 blocks 330, 372 bytes in 11, 148 blocks 24

Demo: Using gprof 25

Demo: Using gcov 26