East Asia Seminar at Asian Institute University of


- Slides: 40

East Asia Seminar at Asian Institute, University of Toronto Understanding China’s Growth: Past, Present and Future Xiaodong Zhu Department of Economics November 23, 2012

China’s growth since 1978 • In 1978, per capita GDP in China was 1/40 of that in US and 1/10 of that in Brazil • Since 1978, per capita GDP in China has grown at 8% a year on average, doubling every 9 years. • The rapid improvement in average living standard has occurred in a country with about 20% of world’s population

Per capita GDP in China and various countries

Growing importance of China in the world economy • China’s per capita GDP (PPP measure) is now 1/5 of U. S. level and at the same level as Brazil • In total size, China is now the second-largest economy in the world • Imports from China account for at least 10% of total imports for any region in the world

Questions • What are the main sources of China’s remarkable growth? • How long can China’s rapid growth be sustained? • What are the main challenges China faces in sustaining high rates of growth?

Main conclusions • China’s growth has been driven by increases in productivity, not by investment nor by cheap labor • There is still plenty of room for growth in China, strong growth potential in the next two decades • However, many challenges in realizing the growth potential

Outline of the talk • China’s historical economic performance up to 1950 • Accounting for China’s modern economic growth: pre-reform (1950 -1978) and reform (since 1978) periods • Sources of productivity growth in China since 1978 • Prospects of China’s future growth

China in pre-modern period • During the Song dynasty (circa 1200), China is thought to have had – the most advanced technologies – the highest iron output – the highest urbanization rate – the world’s largest economy • However, China fell behind the west around 1500

China’s historical economic performance Source: Madison (2007)

Needham puzzle Questions raised by Joseph T. M. Needham: • How did China maintain its technology advantage over Europe in the pre-modern period? • Why didn’t the Industrial Revolution occur in China

Reasons for the great divergence • Ongoing debate about why England was the first to industrialize – Kenneth Pomeranz (2000) Great Divergence: China, Europe and the Making of Modern World Economy • Some consensus that, after England’s Industrial Revolution, institutions play a significant role in determining the timing of a country’s industrialization – Acemoglu et. al. (2001) The colonial origins of comparative development: An empirical investigation

China’s modern growth before and after 1978

Growth Accounting Two methods of decomposing the sources of GDP growth: • standard method • alternative method based on growth theory

Standard method: Growth of GDP = α growth of labour + α growth of average human capital + (1 -α) growth of capital + growth of productivity Alternative method based on growth theory: Growth of per capita GDP = growth of labour participation rate + growth of average human capital + α /(1 -α) growth of capital-output ratio + 1 /(1 -α) growth of productivity


Different growth patterns before and after 1978 • In the pre-reform period, accumulation of both physical and human capital is the main source of growth • During the reform period, productivity growth is the main source of growth

Has China’s growth been driven by investment?

Standard growth accounting

Accounting based on growth theory

China’s growth has not been driven by investment • Despite rising rates of investment, returns to investment remain to be the highest in the world • This would not be possible without high productivity growth • High investment rates are the result of high productivity growth, not the cause of high GDP growth rates

What are the sources of productivity growth after 1978? • Policy and institutional reforms • Structural transformations – From agriculture to manufacturing and services – From state sector to non-state sector

Policy and institutional reforms • General policy of “Reform and Opening Up” (Gaige Kaifang) is decided in December 1978 • Agriculture: – Implemented Household Responsibility System and price reform in agriculture in the early 1980 s – Further market reforms in 1990 s – Relaxation of restrictions on non-farm activities: • rise and expansion of TVEs • structural transformations

Two Structural Transformations 0, 8 0, 7 0, 6 0, 5 0, 4 0, 3 0, 2 0, 1 0 19781979198019811982198319841985198619871988198919901991199219931994199519961997199819992000200120022003200420052006200720082009 Agriculture's Share of Total Employment State Sector's Share of Non-agricultural Employment

Policy and institutional reforms Outside agriculture: A tale of two sectors • 1978 -1988: Rise of the non-state sector • 1988 -1998: From reform without losers to inevitable tradeoffs • 1998 -2007: Privatization and trade liberalization


19 78 19 79 19 80 19 81 19 82 19 83 19 84 19 85 19 86 19 87 19 88 19 89 19 90 19 91 19 92 19 93 19 94 19 95 19 96 19 97 19 98 19 99 20 00 20 01 20 02 20 03 20 04 20 05 20 06 20 07 20 08 20 09 TFP of State and Non-State Sectors 140 120 100 80 Non-state 60 40 20 0 State


Summary • Productivity growth in non-state non-agricultural sector is the most important source of growth • Contribution of the labor reallocation from agriculture is significant, but modest • Even smaller direct contribution from downsizing the state sector – But significant indirect effect through increases in state sector’s productivity

Future prospects of China’s growth • Productivity growth has been the driving force of China’s growth in the last three and half decades • It will continue to be the key source of China’s future growth


Plenty of room for future productivity growth • In 1978, China’s productivity was only 3% of the U. S. level • After three decades of rapid growth, China’s productivity was still only 13% of the U. S. level • If the rapid growth continues for another two decades, China’s productivity level would still be only 40% of the U. S. level

Comparison: Productivity growth in Japan and Korea • In contrast, – Japan’s productivity level was 56% of U. S. level in 1950 and 83% of U. S. level in 1975 – Korea’s productivity level was 43% of U. S. level in 1965 and 63% of U. S. level in 1990

Where will future productivity growth come from? • Still plenty of room for adopting and learning best practices and frontier technologies from developed countries • Further institutional and policy reforms

Further institutional and policy reforms – Reduce capital market distortions


Further institutional and policy reforms – Capital market distortions have increased in recent years – Needs • A more decentralized banking system • Entry of small private financial institutions

Further institutional and policy reforms – Reduce capital market distortions – Reduce state’s monopoly in key industries and services • • • Energy Telecommunication Transportation Banking Health care Education

Where will future productivity growth come from? • Further institutional and policy reforms – Reduce capital market distortions – Reduce state monopoly in key industries and services – Reduce barriers to labor mobility • Despite 250 million migrant workers, cost of labor market distortions has not declined

Conclusion • China’s growth has been driven by productivity, not by capital investment • Lack of capital is still a barrier to growth for the non-state sector • If capital were allocated efficiently, China could have achieved the same growth performance without any increase in the investment rate • Reducing capital market distortions should be the focus of China’s growth rebalancing strategy – but, political constraints
 Statements about the changgo
 Southeast asian ministers of education
 China and the world east asian connections
 Chapter 8 china and the world east asian connections
 Iraq relative location
 Central asian institute
 Asian institute of quality management
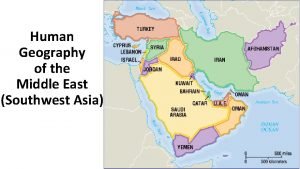
 Human geography of the middle east
 Oceania 1984 map
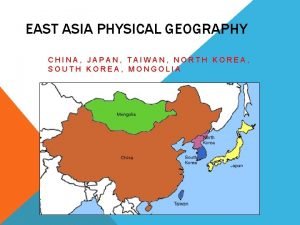
 Physical geography of east asia
 Taiwan physical geography
 Mon khmer
 Scholargentry
 China population density
 Physical geography of east asia
 German east asia squadron
 Chapter 27 tradition and change in east asia
 Chapter 27 tradition and change in east asia
 Chapter 26 tradition and change in east asia
 Chapter 14 the resurgence of empire in east asia
 Spicet chart
 Chapter 27 tradition and change in east asia
 Chapter 15 the resurgence of empire in east asia
 Chapter 15 the resurgence of empire in east asia
 Chapter 14 the resurgence of empire in east asia
 Chapter 13 the resurgence of empire in east asia
 East asia sushi
 Global east asia medical center
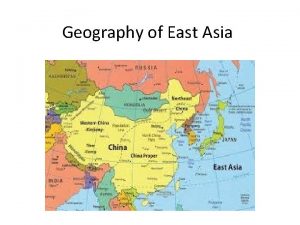
 East asia
 Lesson 8 middle east and south asia
 Southern & eastern asia physical features map answer key
 Post classical vietnam
 Wind is horizontal movement of air
 Laissez faire theory
 East is east and west is west
 Statistical institute for asia and the pacific
 University mobility in asia and the pacific
 Ritsumeikan asia pacific university notable alumni
 Ewu online library
 Ecupl
Ecupl Classical brigade system


