Dropout Seer Visualizing Learning Patterns in Massive Open


 • Massive Open Online Courses (MOOCs) are an effective educational environment and")


 • Introduce Dropout. Seer: a visual analytics system that: 1. Helps experts")
 1. Helps experts understand the reasons for dropout joint analysis of")


 3 rounds of interviews (based on understanding")
![Tasks [T 1] What is the general dropout distribution? [T 2] Are there any](https://slidetodoc.com/presentation_image/a0fb9e1e1a75353e1708049e1f657fe6/image-13.jpg "Tasks [T 1] What is the general dropout distribution? [T 2] Are there any")


 • 2 domain experts • Monthly meetings • Considered")
 • G 1. The visual designs should…. • G")

![4. 3 Visual Encoding [T 1] What is the general dropout distribution? [T 2]](https://slidetodoc.com/presentation_image/a0fb9e1e1a75353e1708049e1f657fe6/image-20.jpg "4. 3 Visual Encoding [T 1] What is the general dropout distribution? [T 2]")
![4. 3 Visual Encoding [T 2] … And what are the factors that affect](https://slidetodoc.com/presentation_image/a0fb9e1e1a75353e1708049e1f657fe6/image-21.jpg "4. 3 Visual Encoding [T 2] … And what are the factors that affect")


![Flow View [T 4] How do form posts correlate to a selected learner group?](https://slidetodoc.com/presentation_image/a0fb9e1e1a75353e1708049e1f657fe6/image-27.jpg "Flow View [T 4] How do form posts correlate to a selected learner group?")
![Flow View • [T 5] What are the learning patterns of a particular learner?](https://slidetodoc.com/presentation_image/a0fb9e1e1a75353e1708049e1f657fe6/image-28.jpg "Flow View • [T 5] What are the learning patterns of a particular learner?")

- Slides: 29
Dropout. Seer: Visualizing Learning Patterns in Massive Open Online Courses for Dropout Reasoning and Prediction 2016 IEEE Conference on Visual Analytics Science and Technology (VAST) IEEE TVCG journal
Authors
Motivation (Why) • Massive Open Online Courses (MOOCs) are an effective educational environment and is gaining popularity • High dropout rate may hinder their development • Statistical models can predict dropout but make it difficult to: 1. Understand reasons behind predicted results 2. Improve the prediction model 3. Design interventions to prevent dropout
Question: How did the paper motivate the idea that visualization can play a role to solve the problem?
Question: How did the paper motivate the idea that visualization can play a role to solve the problem? • Cited two recent works that “claim that feature ideation is a critical step in the model building process to build highly accurate models. ” • Explained why computational methods alone are not enough • Explained how visualization can help machine learning: by providing feedback on the model, and offering data understanding even with little domain knowledge
Contribution (What) • Introduce Dropout. Seer: a visual analytics system that: 1. Helps experts understand the reasons for dropout 2. Helps researchers identify crucial features which can further improve the performance of the model 3. Visualizes heterogeneous data extracted from 3 different kinds of learner activity • Present case studies and expert interviews to demonstrate the usefulness and effectiveness of Dropout. Seer.
Approach outline (how) 1. Helps experts understand the reasons for dropout joint analysis of video watching behavior, assignment performance, and forum discussion (heterogeneous data) 2. Helps researchers identify crucial features which can further improve the performance of the model by classifying model results into meaningful subgroups to find patterns and identify clusters and outliers.
About the system • Four linked views
Listing of contributions
3. Problem Characterization • 3 System components to solve 3 parts of the problem
3. 1 Data Abstraction • What types of data are pertinent to this problem? • What sub-categories of data types exist? • Descriptive Statistics of the three types of data in the actual dataset • Data preprocessing • Preliminary analysis to describe main data characteristics (bias, sparsity, uncertainty)
3. 2 Task Analysis • How? data) 3 rounds of interviews (based on understanding of the • To what aim? To characterize the requirements
Tasks [T 1] What is the general dropout distribution? [T 2] Are there any dropout learner groups? And what are the factors that affect the different groups? [T 3] What are the learning patterns demonstrated by different learner groups? [T 4] How do form posts correlate to a selected learner group? [T 5] What are the learning patterns of a particular learner?
Predictive Models • Logistic Regression • Random Forest • Nearest-Neighbor
Interesting paragraph
4. Visualization 4. 1 Design Guidelines 4. 2 Clustering Method 4. 3 Visual Encodings
4. 1 Design Guidelines (How) • 2 domain experts • Monthly meetings • Considered a wide range of visual encoding decisions • Decisions reached after 3 rounds of opinion exchange and trials on sample data
4. 1 Design Guidelines (what) • G 1. The visual designs should…. • G 2. The system should… • G 3. The degree of user intervention should… • G 4. System interactions should….
Feature Vector
4. 3 Visual Encoding [T 1] What is the general dropout distribution? [T 2] Are there any dropout learner groups? And what are the factors that affect the different groups?
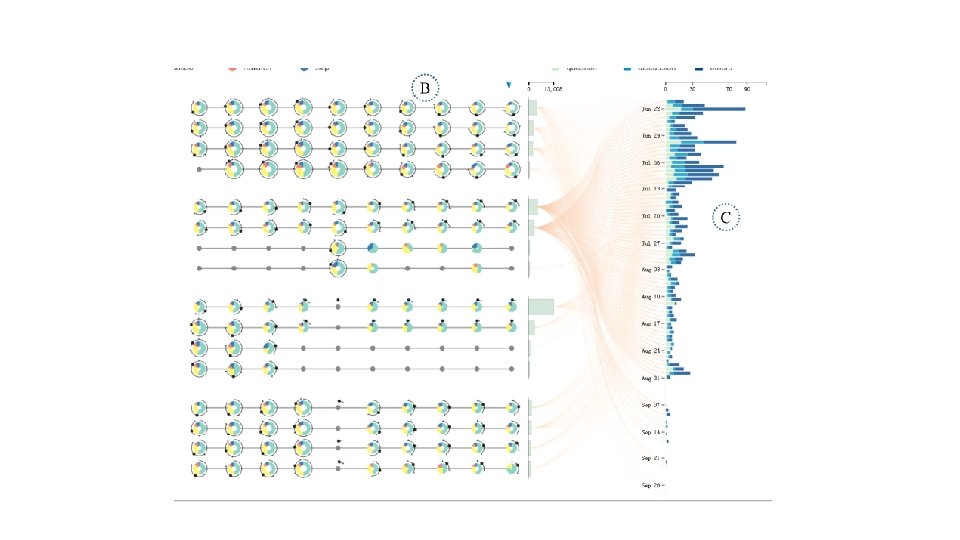
4. 3 Visual Encoding [T 2] … And what are the factors that affect the different groups? [T 3] What are the learning patterns demonstrated by different learner groups?
Glyph Design Alternatives
The Donut Glyph • Inner radius encodes average number of videos watched by the subgroup in this row • Outer radius encodes std. deviation of videos watched Subgroups with more participants are more important, so width of donut can be interpreted as the confidence of the subgroup
The Donut Glyph • The arc average and std. deviation of the percentage of achieved scores in each week’s assignments. • Complete arc = full mark • Small circle on the arc = average percentage
Discussion of Design Alternatives
Flow View [T 4] How do form posts correlate to a selected learner group?
Flow View • [T 5] What are the learning patterns of a particular learner? When a single learner is selected in the flow view, an individual layer will be expanded for a more detailed analysis (P. 6, top right)
Case Studies & Discussion