Decline of railways competitive alternate modes multimodal systems


 Demand in Billion NTKM Average Lead (in km)")


 – – – – 1.")


- Slides: 47
Decline of railways, competitive alternate modes, multimodal systems B. V. L. Narayana Group general manager RITES
Structure of presentation • • • Transport system in India Decline of railways Evolution of transport system in India Competitive alternate modes Multimodal transport system in India – Start – Evolution – Present status • Some concluding observations—future of transport in India
Key messages • Transport system in India has – Enlarged, expanded in scope and scale – Has evolved in technology – Is coming to age in line with developed countries • Has become truly multimodal – Increasing penetration of containerization – Developing capacities – Increasing economic global integration
Key message Gandhi said Indian railways • A customer is the most important visitor on our premises. He is not dependent on us. We are dependent on him. He is not an interruption in our work. He is the purpose of it. He is not an outsider in our business. He is part of it. We are not doing him a favor by serving him. He is doing us a favor by giving us an opportunity to do so. ” • Have lost focus of – What customers want – Behave as if they are in business of rail transportation – Have refused to go up the value chain of transportation – Are not willing to take risks and responsibilities • Loss of market share is due to lack of congruence between customer needs and our services
12/26/2021 5
12/26/2021 6
Historical analysis • Planning Commission, Government of India, had undertaken – three Transport System Studies in the years 197879, 1986 -87 and 2007 -08 all of which were conducted by RITES. – Thirty eight commodities are uniformly seen – allows us to do a comparative analysis using categorization based on commodity characteristics.
Historical evolution of modal shares Year Modal Shares in Total Originating Tonnes Total Originating Coastal Railway Highwa Pipeline Tonnes (MT) Shippin Airlines IWT s ys s g 1950 -51 82. 2 * 73. 2 (89%) 9. 0 (11%) - - 1978 -79 283. 40 ** 184. 70 (65%) 95. 60 (34%) 3. 10 (1%) - 1986 -87 484. 9 ** 255. 40 (53%) 224. 00 (46%) 5. 50 (1%) - 2007 -08 2555. 35 768. 72 1558. 87 (30. 08%) (61. 01%) 59. 10 (2. 31%) 0. 28 (0. 01%) - - 113. 50 (4. 44%) 54. 88 (2. 15%)
Historical analysis 1 2 3 4 5 1978 Ratio With Respect To Total Transport 1979 Demand (i) Bulk 0. 594 ( ii ) Non Bulk 0. 235 ( iii ) Containersable High Value 0. 171 Share - Bulk (i) Rail 0. 825 ( ii ) Road 0. 174 Share - Non Bulk (i) Rail 0. 483 ( ii ) Road 0. 516 Share - Containersable High Value (i) Rail 0. 321 ( ii ) Road 0. 679 Rate Of Growth Of Transport (%) (i) Bulk ( ii ) Non Bulk ( iii ) Containersable High Value 19861987 2007 -2008 0. 598 0. 228 0. 173 0. 485 0. 195 0. 319 0. 712 0. 287 0. 584 0. 416 0. 377 0. 622 0. 136 0. 863 0. 173 0. 827 0. 074 0. 926 8. 64 7. 94 8. 85 14. 83 15. 94 39. 99
Historical analysis Volume of Demand (MT) Demand in Billion NTKM Average Lead (in km) category 1978 - 198679 87 2007 - 1978 198608 -79 87 2007 - 1978 1986 - 200708 -79 87 08 Bulk 167 282 1117 119 186 613 715 660 548 Non bulk 66 108 451 34 52 162 510 487 359 Containe risable 48 82 736 31 51 418 639 627 567
Dominance of rail mode Type & Category Bulk Non Bulk Containerisable High Value 1978 -79 1986 -87 2007 -08
Value chain—historical analysis Customer evolution • 1950 -60 s—transportation • 1960 -70 s-warehousing, local handling, documentation, transportation, local leads • 1970 -80 s—all above+ packaging, inventory management • 1980 -90 s-logistics • 1990 s-2000 -logistics+value add manufacturing • 2000 onwards—supply chain management Evolution of services on IR • 1950 -60 s—transportation • 1960 -1980 s-warehousing, local handling, transportation, local leads • 1980 -1990 s-- transportation, warehousing • 1990’s onwards-transportation
Commodity wise modal share Commodity 1978 -79 1986 -87 2007 -08 Rail Road Coal 91 9 87 13 83 17 Food grains 68 33 47 53 21 79 Iron Ore 99 1 96 4 84 16 Limestone & Dolomite 91 9 74 26 69 31 Mineral Oils 72 28 65 35 22 78 Cement 79 22 63 37 51 49 Chemical Manures 70 30 61 39 67 33 Iron & Steel 64 36 45 55 20 80 Salt 70 30 63 37 42 58 Others 36 64 21 79 8 92 Total 66 34 54 46 33 67
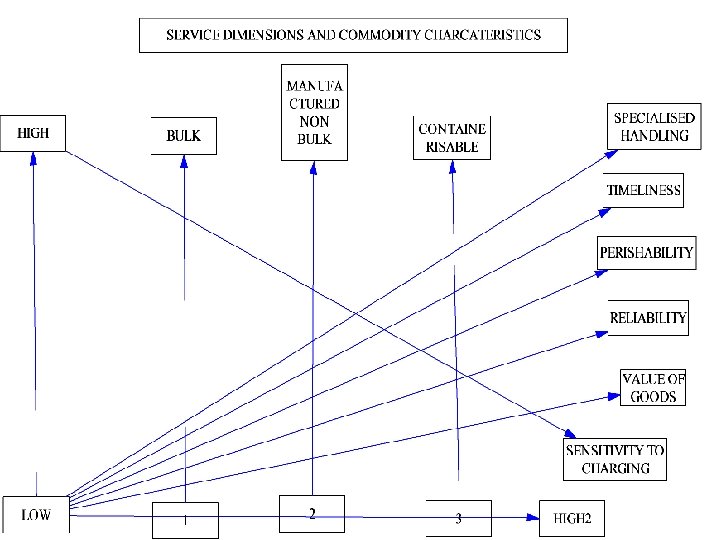
Service requirements
Commodity Characteristics Characteristic Bulk Non bulk Containerisable Primary Parcel size high Medium to low Propensity to damage during handling Sensitivity to positioning on time low high low Medium to low high Intrinsic value low Medium to high Need for specialized handling low medium high Perishability low medium high Value of goods low high Need for add on services low medium high Reliability and flexibility Low to medium Medium to high Derivatives
Rail transport elasticity Based on past data Year 1991 -92 to 2001 -02 to 2010 -11 1991 -92 to 2010 -11 Rail Transport Elasticity. 47. 91. 78 Rail Transport Elasticity w. r. t. IIP Sector-Wise Elasticity of Rail Traffic w. r. t GDP Sectors / Commodity Movement by IR Agriculture / Foodgrains Mining & quarrying / Iron Ore & L & D Industry / Steel & POL Manufacturing / Other Goods Construction / Cement Electricity / Coal Mining & Quarrying Manufacturing 1. 3 0. 7 Electricity 0. 9 Elasticity of Rail Tonnage w. r. t. GDP 19912001 -02 1991 -92 92 to to to 20012010 -11 02 0. 9 1. 2 0. 7 1. 1 0. 9 0. 5 0. 9 1. 5 2. 0 0. 8 0. 7 1. 0 1. 1 0. 9 General 0. 7
INFERENCES FROM GDP ANALYSIS • The rail elasticity vis-a-vis economic activity is less than equal to one when compared to overall GDP. • Rail elasticity tends to vary with the nature of sector and therefore growth in sectors where commodities are ‘Railable’ results in higher demand generation. • The rail elasticity would be influenced by what sectors rail mode attempts to service in large way. • what are “Railable “commodities will depend upon the congruence established between modal and commodity characteristics
Implications for transporters • different groups require different dimensions of service as the emphasized dimensions of quality and • therefore require differentiated services. • As the dimension of value of goods rises, the ability to charge for transportation is function of reliability and ability to give add on services. • Thus containersable cargoes are the most paying segment, followed by non bulk and finally bulk segment.
DOMINANCE OF RAIL IN PASSENGER TRANSPORT TYPE AND 1950 -51 CATEGORY LONG DISTANCE >1000 KM INTER CITY 300 -800 KM SHORT DISTANCE SUBURBAN RURAL 1978 -79 1987 -88 1997 -98 2007 -2008
Concerns - railways • • Neglect of piecemeal traffic Poor penetration of containerization Line and terminal capacities Mechanization of freight terminals Security concerns Poor project implementation Asset reliability 12/26/2021 20
Issues for Discussion • In what business we are in? • Do we estimate demand? • Who can help us in estimation of demand? • How do we cost services? • Do we need to change Mgmt/ orgn structure? 12/26/2021 21
VERY LOW NON SUB GENERAL SUBURBAN LD INTER CITY OVER NIGHT VERY HIGH REQUIREMENT OF ADD ON FACILITIES REQUIREMENTS OF COMFORT MAPPING OF PASSENGER SERVICES ON CUSTOMER DIMENSIONS PLD VERY LOW PRICE SENSITIVITY TIME SENSITIVITY VERY HIGH
PROJECTS DOCUMENTS SMALLS PARCELS CONTAINERIZED NON BULK VERY LOW INTRINSIC VALUE OF PARCEL TIME SENSITIVITY HANDLING SENSITIVITY VERY HIGH MAPPING OF FREIGHT SERVICES ON CUSTOMER DIMENSIONS VERY LOW PRICE SENSITIVITY PARCEL SIZE VERY HIGH
Evolution of logistics integration 12/26/2021 26
12/26/2021 27
Multimodal transport in India • Was always there—not recognized • Lack of integrated services offering • Two drivers – Containerization – Globalization • Indian railways – Pioneered containerization in India • Domestic-1979 • international
Multi modal transport • Multi modal transport act— 1991 • Liberalization of institutions – – Customs Commerce Transport Ports • Spread of multimodal transport – – Acceptance of philosophy Spread of infrastructure Spread of handling systems Harmonization of procedures
Containerization—KPMG analysis in india Drivers of containerization Key feature • The EXIM container market in India has grown at a CAGR of 12 percent in the past five years, as compared to the 8– 10 percent growth that other commodities such as POL, Iron ore and coal experienced during the same period. Growth in the container market is expected to continue in the medium term as a result of rising containerization levels and growth in trade. At 51 percent, the containerization level in India continue to fall short of that in developed countries, which have achieved significant levels of 70– 80 percent • Increasing containerization of break bulk cargo • Growth of industries with containerisable cargo • Capacity creation –MLO terminals, logistics parks, DFC and industrial corridors • Thrust on developing container terminals
Containerization and handling
Status on date • Container penetration – Overall 40 -50% – Likely 60 -70% by 2030 – Regional imbalances • West and south reached 70% • East –only 10 -15% • Now progress shifted to deficient areas – Increasing infrastructure • Ports • MMLPs • Logistics corporation
WHY RAILWAYS • USP’S – VERY HIGH DEGREE OF SAFETY – GOOD SPEEDS POSSIBLE – CAN MANAGE SCALE AND SCOPE AT THE SAME TIME – CAN BE COST EFFECTIVE – IS HIGHLY ENVIRONMENTALLY FRIENDLY • DEMAND FOR RAILTRAVEL – AREA – ECONOMIC ACTIVTY – POPULATION • IN INDIAN RAILWAYS HAVE BENEFIT OF ALL THREE FACTORS • DEMAND IS NOT A CONSTRAINT • MULTIMODALISM ANSWER TO TRANSPORT AND LOGISTICS EFFICIENCY
Indicators of growing economy • Study by KPMG indicates(2013) – – – – 1. 8 trillion to 3. 6 by 2020—economy Crude steel production –four times by 2030 Demand for cement to double-2030 Textiles industry -78 billion to 220 billion-2020 Agriculture -300 million MT – 2030 Coal consumption =1100 MMT -2020 -35% imports EXIM cargo-890 MMT to 2800 MMT Middle class 160 million to 640 million—need finished goods—urban centers of consumption • All in all a growing manufacturing and service economy
Megatrends to affect economy • Changing demographics – Urbanization – 60% urban population in 20 -25 clusters-2030 – Industrial clusters need DFCs • Evolving requirements of trade – Increasing retail, and manufacturing sectors – Increased warehousing, niche industries – Requirement of geography and commodity specific storages • Increasingly skewed modal mix – Desired overlay of networks with hub and spoke configurations
Indian perception position in world economy Source –approach to 12 th planning commission
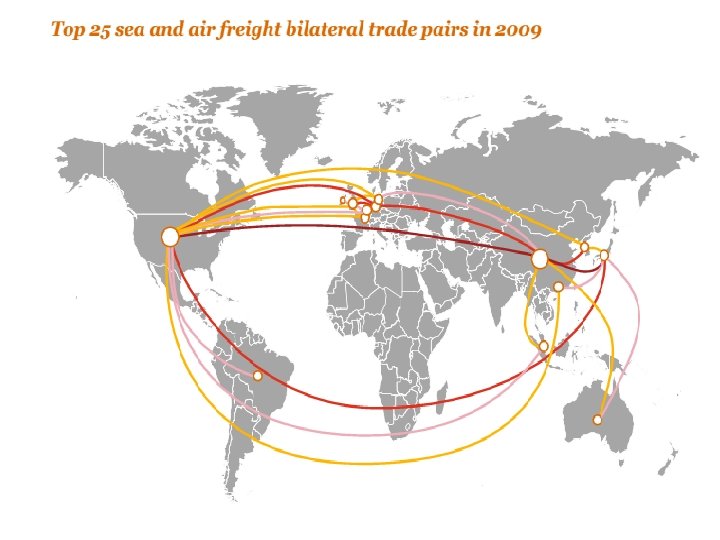
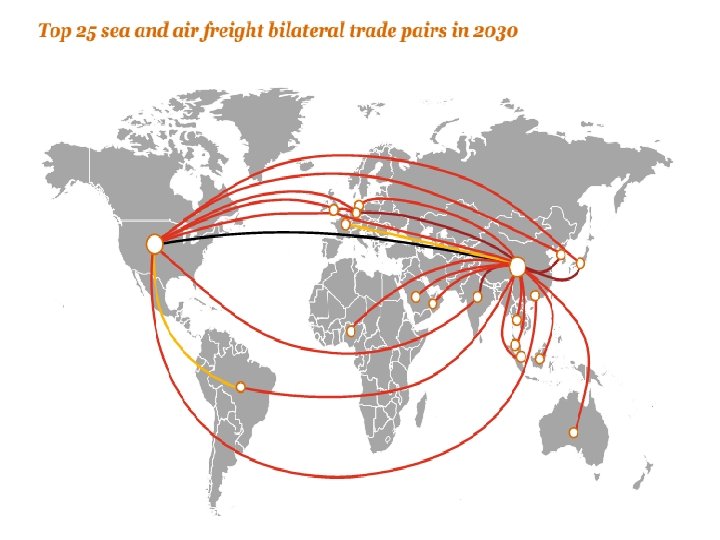
Key drivers of Indian transport system • Present – Economic growth – Globalization – World trade patterns – World Fuel prices – Transport technologies – urbanization • Future – Fuel prices – Alternate fuels – Regional trade patterns • Asia , china • ASEAN • Global SCM integration • Expanding new markets – South America – BRICS – AFRICA • Urbanization
Present directioning of transport • Strategic directioning of economy – Faster , Sustainable and Inclusive growth – Implications for transport • Speed of transport • Least social cost to nation • Cover all areas of the country • Global perspective – Integrated economy –integrated global logistics links
Directioning • Focus on – Multimodal systems • Containerization penetration • Capacities at all places –ports, terminals, carriers, institutional systems • Shift to logistics and supply chain practices – on global linkages • Open to all players—FDI • Liberalization of trade – Increase and balance share of railways • DFC and capacity building • Shift to logistics capacity building – Reduce overall transport demand
Future evolution of transport • Freight • More and more localized • – power generation • Ports • Pithead – Production systems • SEZS and Ports – Large logistics demand • Intermediate products – IT driven systems – Skills differentiation • Last mile delivery – Small vehicles—possible rail, waterways—local logistics • Private driven investments • Continuing urbanization • • Passenger – Land based integration • Rail , road, shipping – Tourism and business—drivers – Possible harmonization of cultures or adaptation to provide country specific peoples demands – Truly multi modal trips • Locally • Long distance – Harmonized international and local systems – Skill levels evolution Private driven investments Continuing urbanization
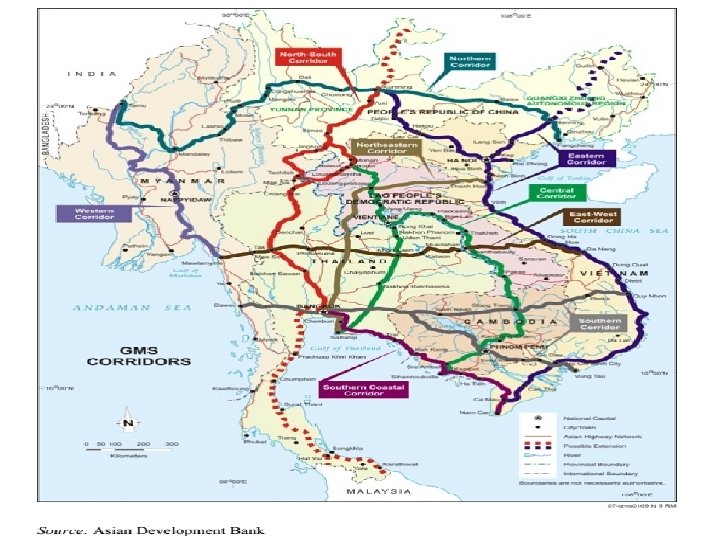
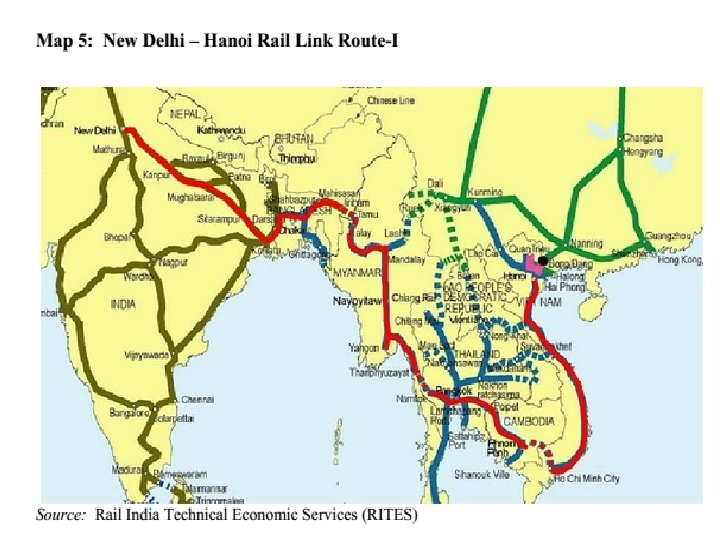
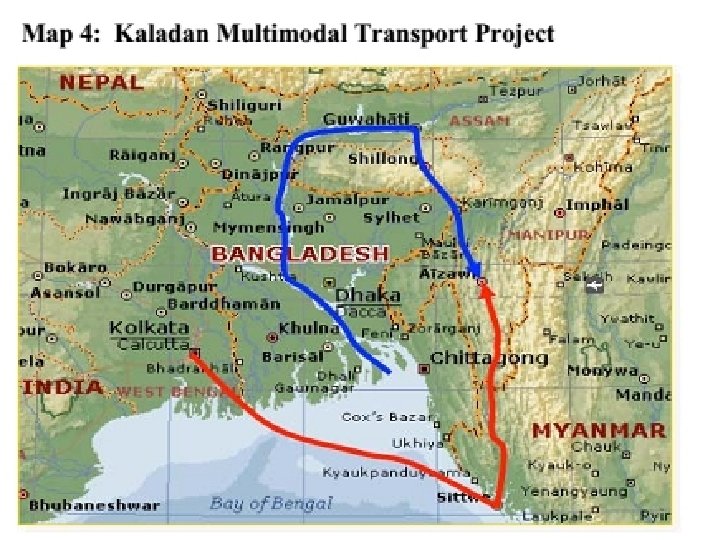
ASEAN India connectivity
THANK YOU ANY QUESTIONS