Dark Current Measurements in RF Structures Jan Paszkiewicz


- Slides: 26
Dark Current Measurements in RF Structures Jan Paszkiewicz Me. VArc, San Juan, 20 -24 May 2018 1
Field Emission Profile Measurements 2
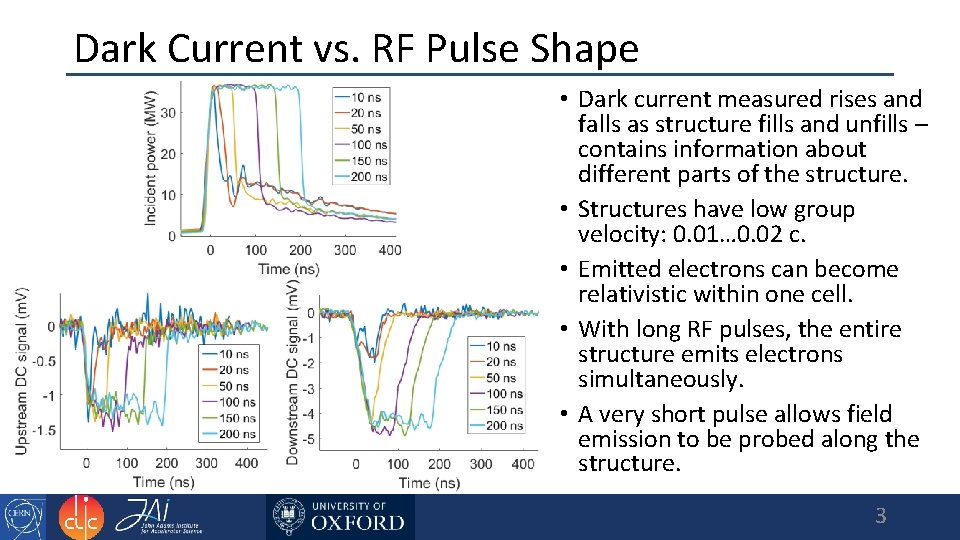
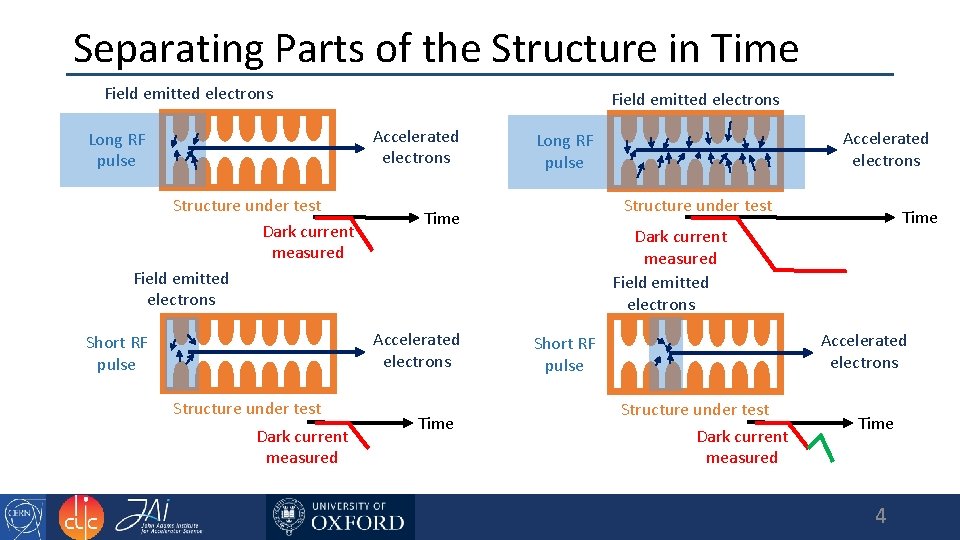
Dark Current vs. RF Pulse Shape • Dark current measured rises and falls as structure fills and unfills – contains information about different parts of the structure. • Structures have low group velocity: 0. 01… 0. 02 c. • Emitted electrons can become relativistic within one cell. • With long RF pulses, the entire structure emits electrons simultaneously. • A very short pulse allows field emission to be probed along the structure. 3
Separating Parts of the Structure in Time Field emitted electrons Accelerated electrons Long RF pulse Structure under test Dark current measured Field emitted electrons Structure under test Dark current measured Structure under test Time Accelerated electrons Short RF pulse Time Accelerated electrons Long RF pulse Time Dark current measured Field emitted electrons Accelerated electrons Short RF pulse Structure under test Dark current measured Time 4
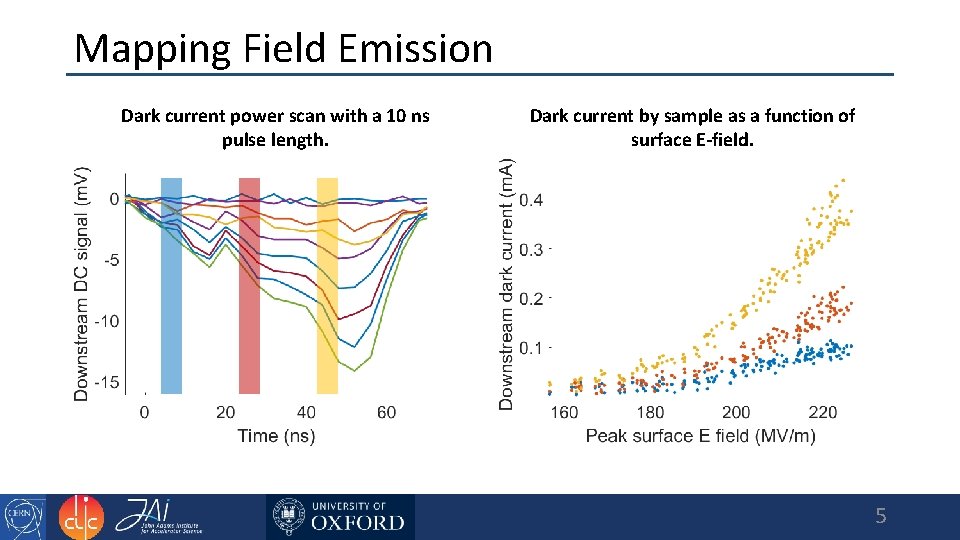
Mapping Field Emission Dark current power scan with a 10 ns pulse length. Dark current by sample as a function of surface E-field. 5
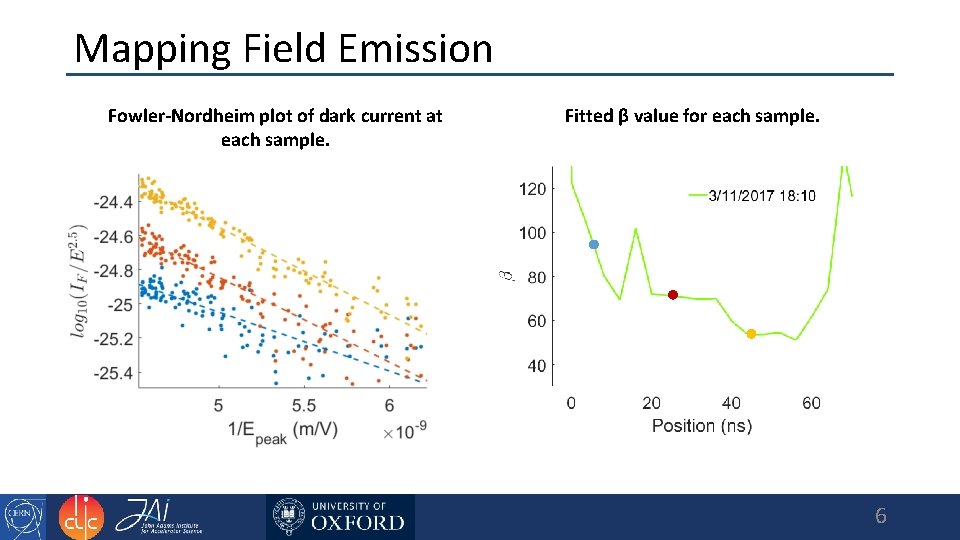
Mapping Field Emission Fowler-Nordheim plot of dark current at each sample. Fitted β value for each sample. 6
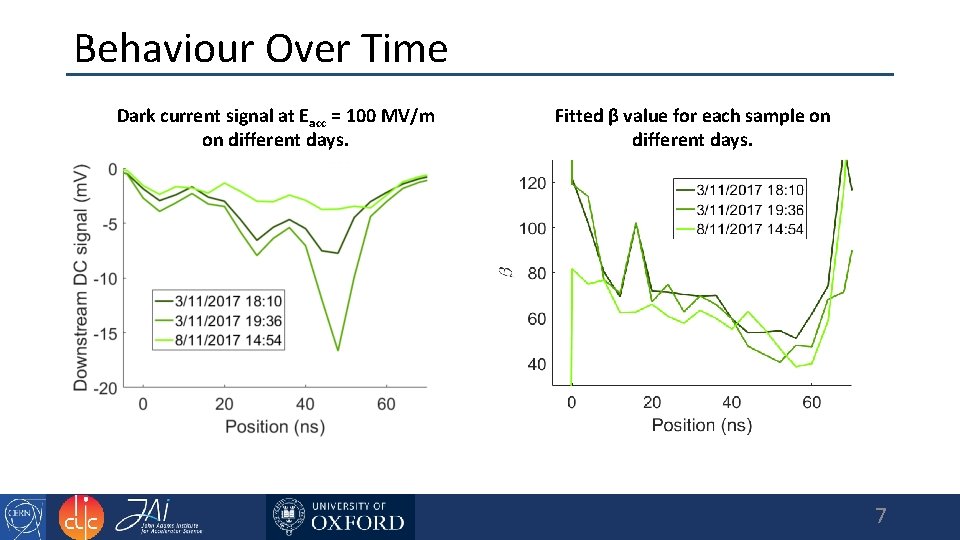
Behaviour Over Time Dark current signal at Eacc = 100 MV/m on different days. Fitted β value for each sample on different days. 7
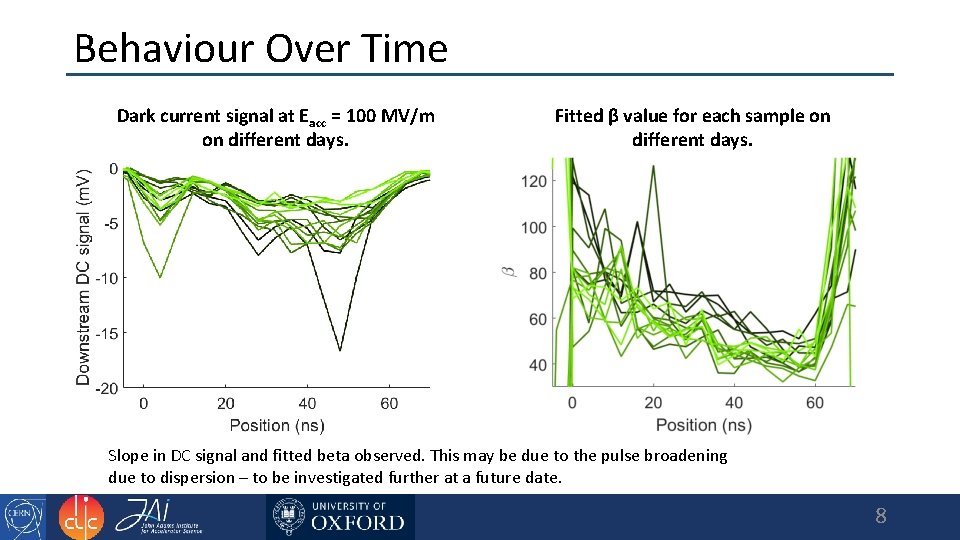
Behaviour Over Time Dark current signal at Eacc = 100 MV/m on different days. Fitted β value for each sample on different days. Slope in DC signal and fitted beta observed. This may be due to the pulse broadening due to dispersion – to be investigated further at a future date. 8
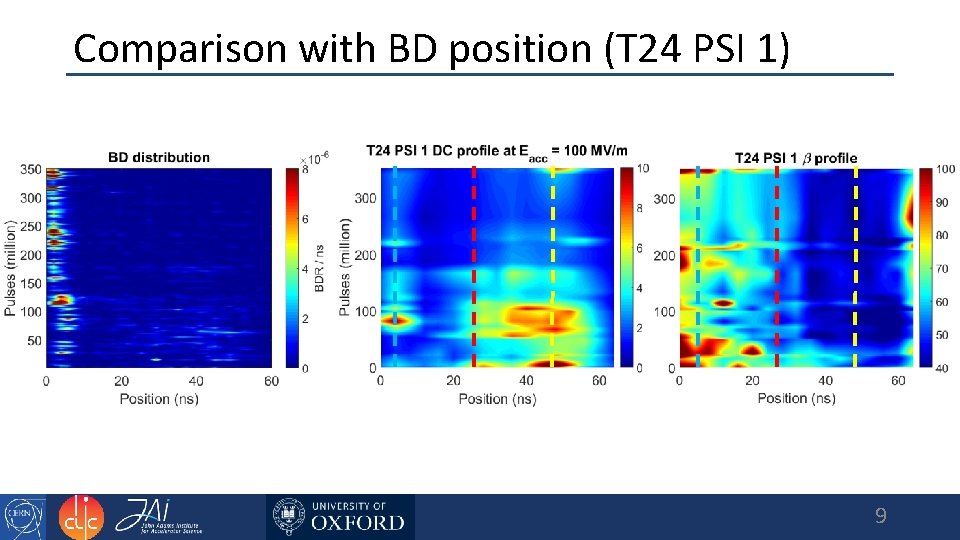
Comparison with BD position (T 24 PSI 1) 9
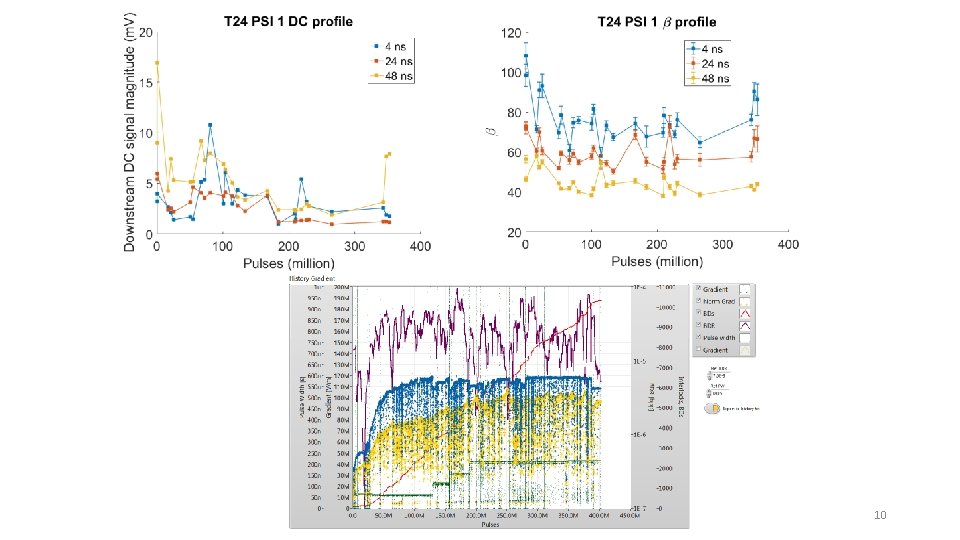
10
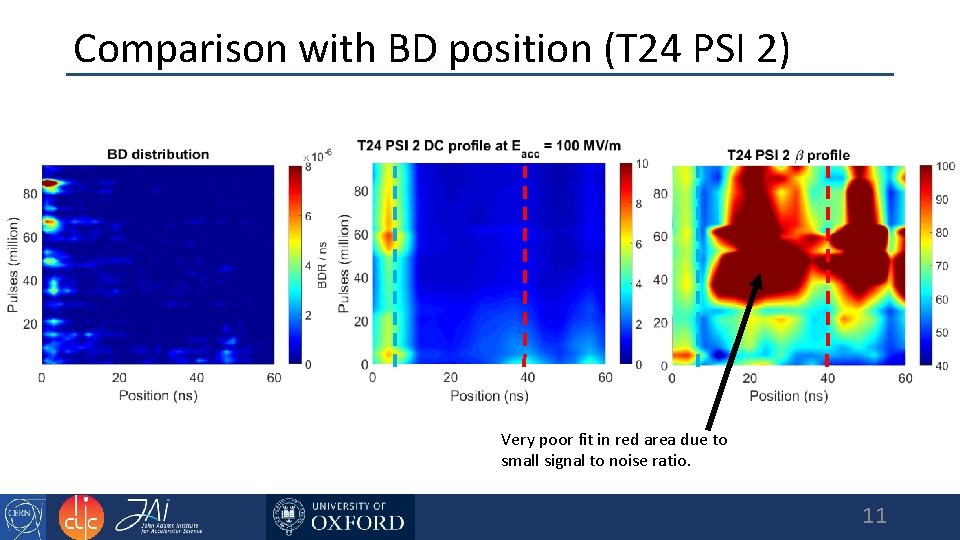
Comparison with BD position (T 24 PSI 2) Very poor fit in red area due to small signal to noise ratio. 11
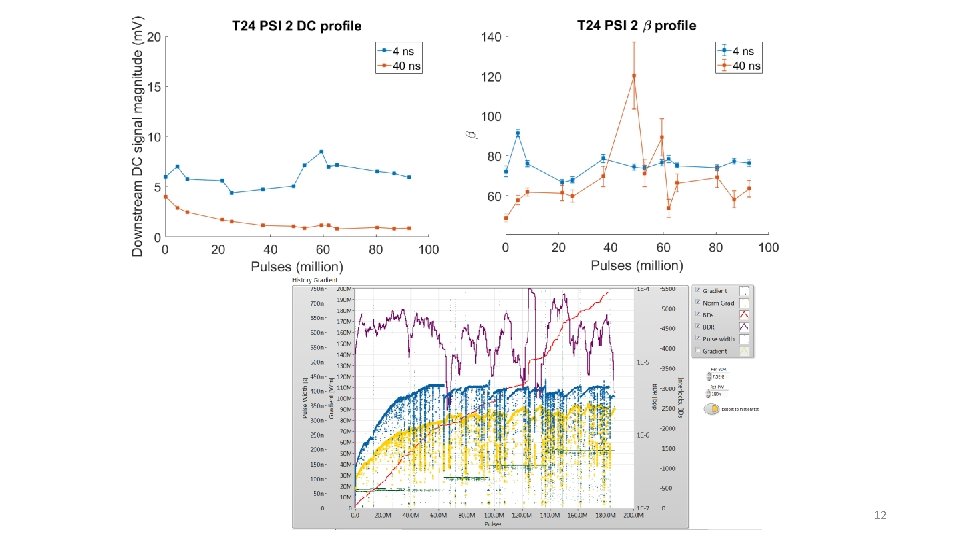
12
High Frequency Fluctuation Measurements 13
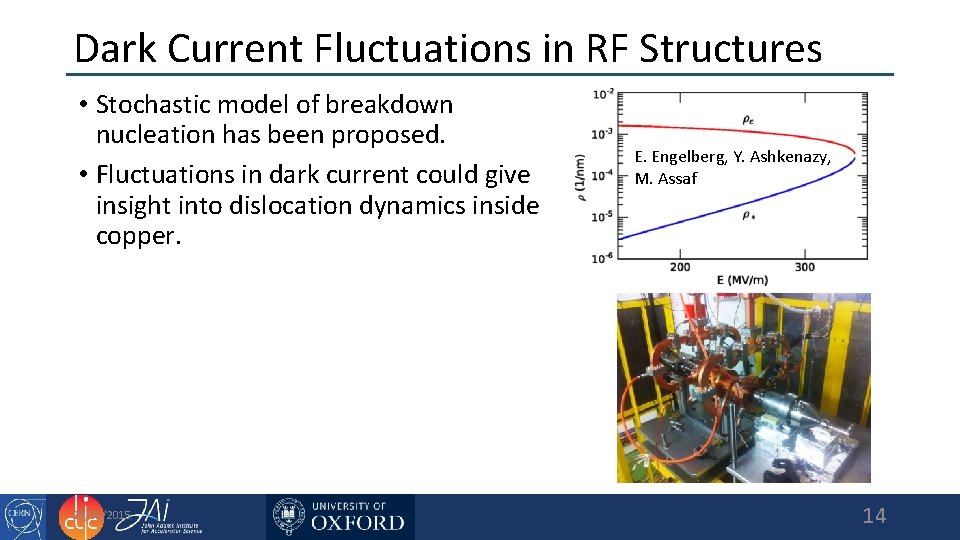
Dark Current Fluctuations in RF Structures • Stochastic model of breakdown nucleation has been proposed. • Fluctuations in dark current could give insight into dislocation dynamics inside copper. 28/01/2015 E. Engelberg, Y. Ashkenazy, M. Assaf 14
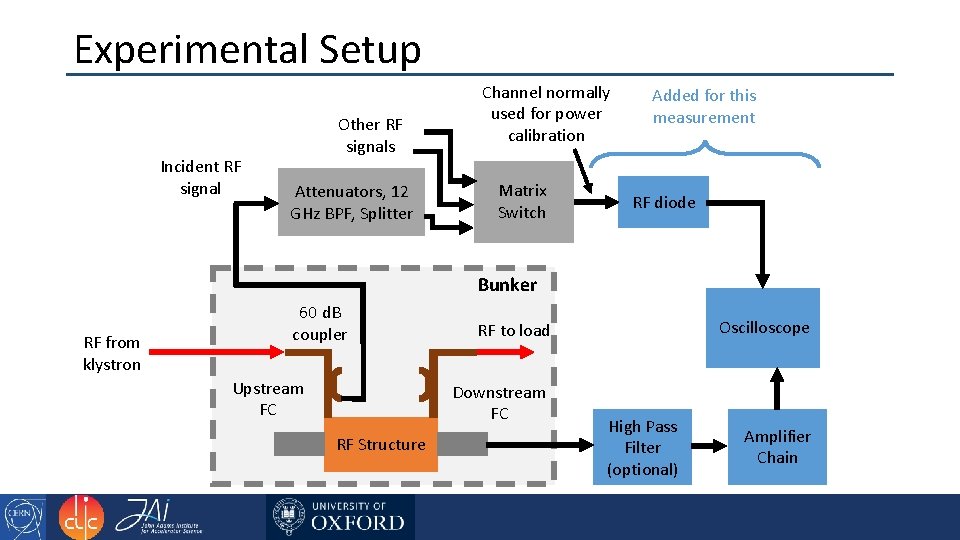
Experimental Setup Incident RF signal Other RF signals Attenuators, 12 GHz BPF, Splitter Channel normally used for power calibration Matrix Switch Added for this measurement RF diode Bunker RF from klystron 60 d. B coupler Upstream FC Downstream FC RF Structure Oscilloscope RF to load High Pass Filter (optional) Amplifier Chain
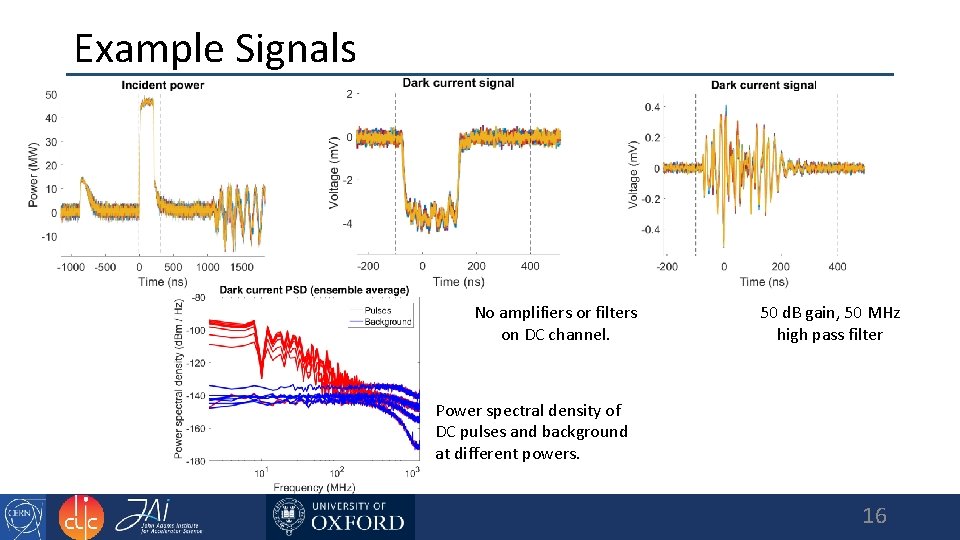
Example Signals No amplifiers or filters on DC channel. 50 d. B gain, 50 MHz high pass filter Power spectral density of DC pulses and background at different powers. 16
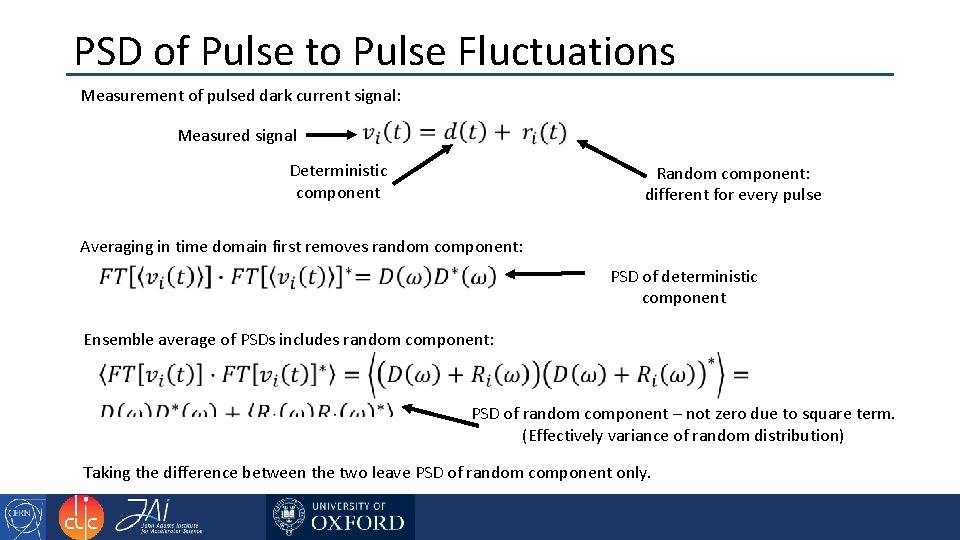
PSD of Pulse to Pulse Fluctuations Measurement of pulsed dark current signal: Measured signal Deterministic component Random component: different for every pulse Averaging in time domain first removes random component: PSD of deterministic component Ensemble average of PSDs includes random component: PSD of random component – not zero due to square term. (Effectively variance of random distribution) Taking the difference between the two leave PSD of random component only.
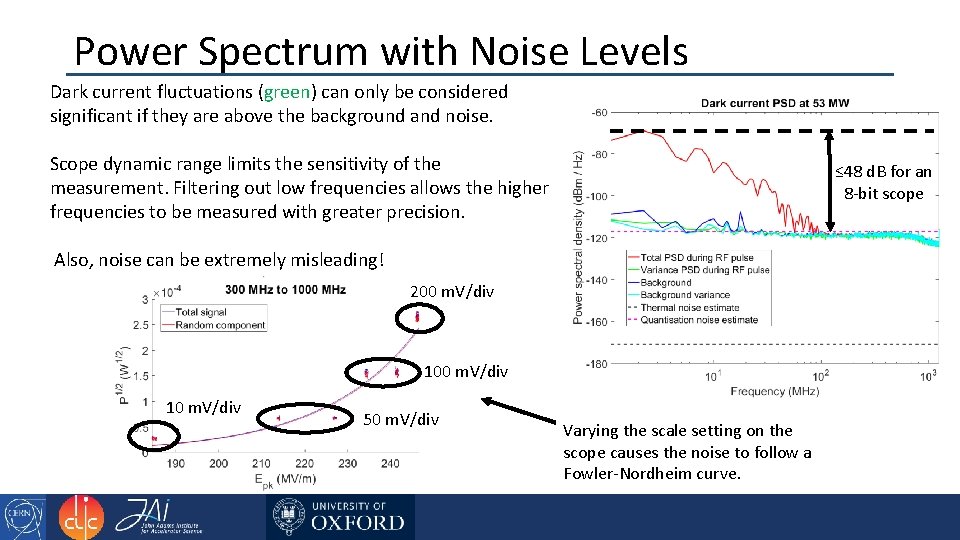
Power Spectrum with Noise Levels Dark current fluctuations (green) can only be considered significant if they are above the background and noise. Scope dynamic range limits the sensitivity of the measurement. Filtering out low frequencies allows the higher frequencies to be measured with greater precision. ≤ 48 d. B for an 8 -bit scope Also, noise can be extremely misleading! 200 m. V/div 10 m. V/div 50 m. V/div Varying the scale setting on the scope causes the noise to follow a Fowler-Nordheim curve.
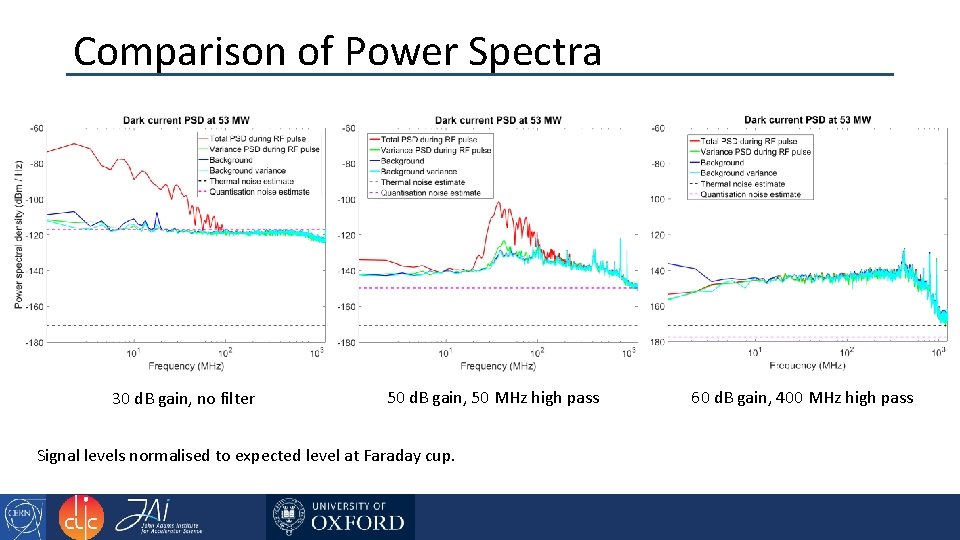
Comparison of Power Spectra 30 d. B gain, no filter 50 d. B gain, 50 MHz high pass Signal levels normalised to expected level at Faraday cup. 60 d. B gain, 400 MHz high pass
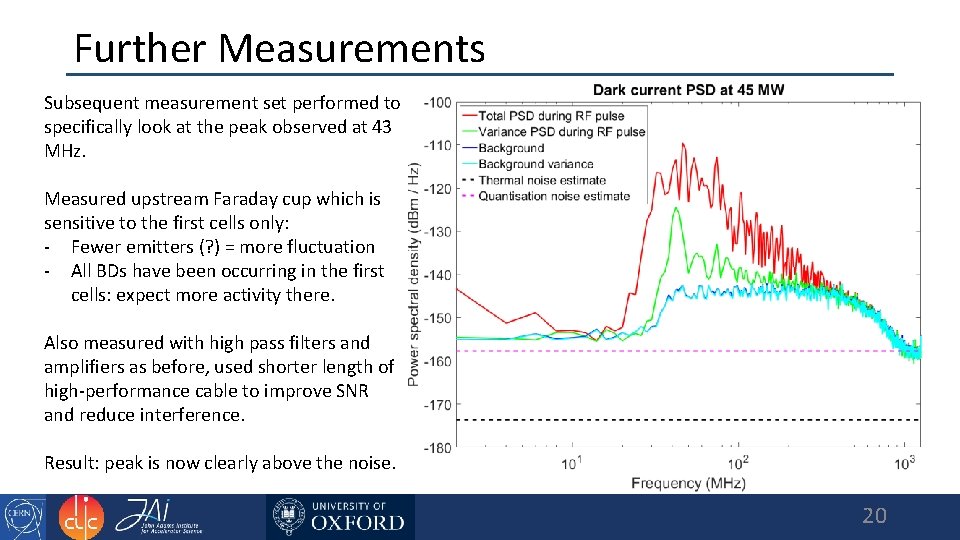
Further Measurements Subsequent measurement set performed to specifically look at the peak observed at 43 MHz. Measured upstream Faraday cup which is sensitive to the first cells only: - Fewer emitters (? ) = more fluctuation - All BDs have been occurring in the first cells: expect more activity there. Also measured with high pass filters and amplifiers as before, used shorter length of high-performance cable to improve SNR and reduce interference. Result: peak is now clearly above the noise. 20
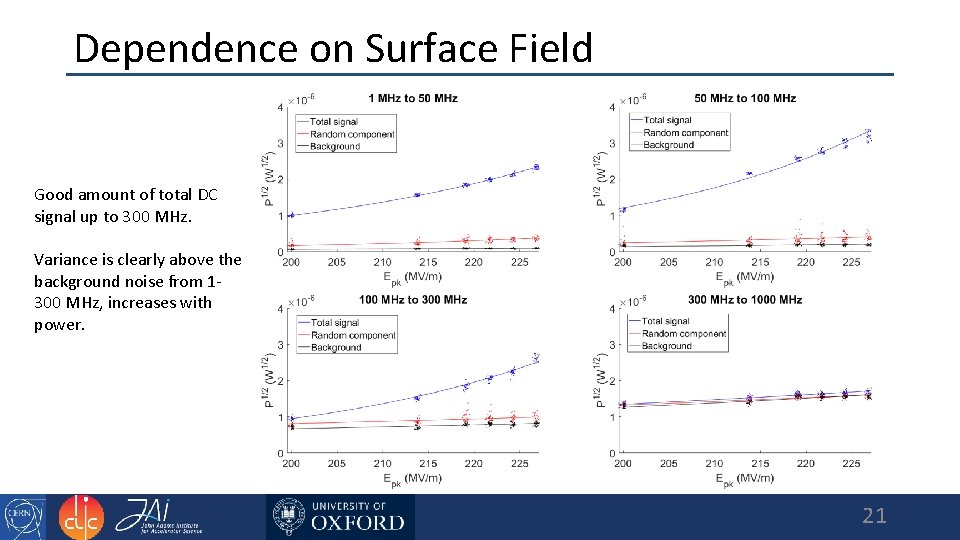
Dependence on Surface Field Good amount of total DC signal up to 300 MHz. Variance is clearly above the background noise from 1300 MHz, increases with power. 21
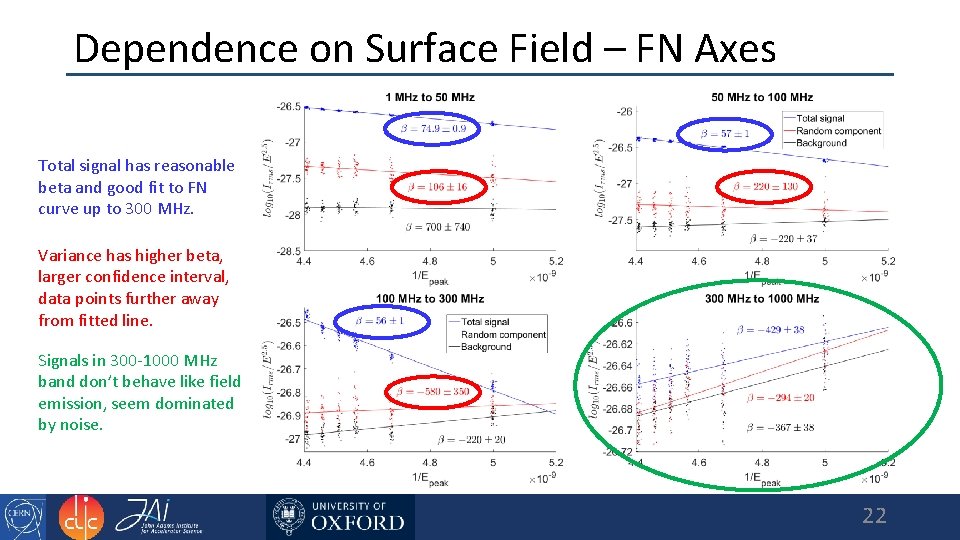
Dependence on Surface Field – FN Axes Total signal has reasonable beta and good fit to FN curve up to 300 MHz. Variance has higher beta, larger confidence interval, data points further away from fitted line. Signals in 300 -1000 MHz band don’t behave like field emission, seem dominated by noise. 22
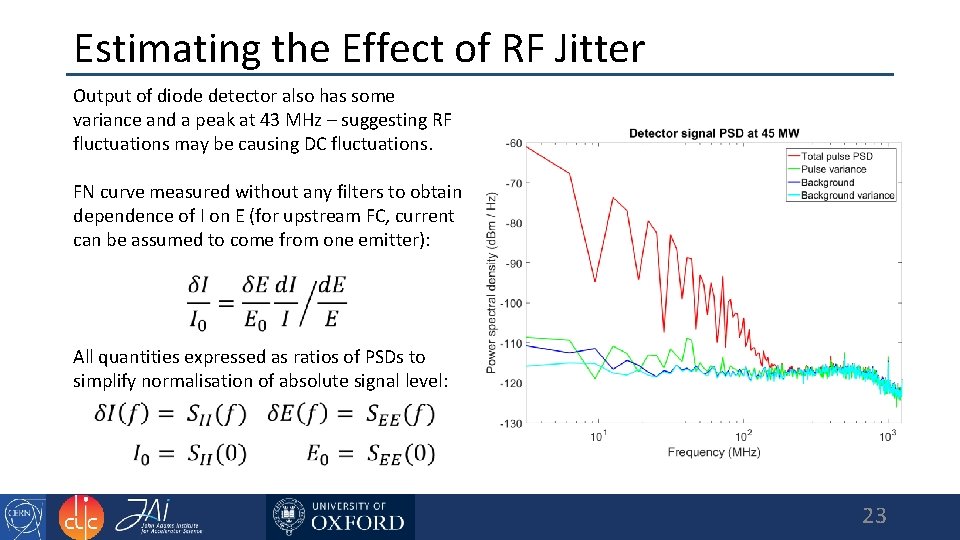
Estimating the Effect of RF Jitter Output of diode detector also has some variance and a peak at 43 MHz – suggesting RF fluctuations may be causing DC fluctuations. FN curve measured without any filters to obtain dependence of I on E (for upstream FC, current can be assumed to come from one emitter): All quantities expressed as ratios of PSDs to simplify normalisation of absolute signal level: 23
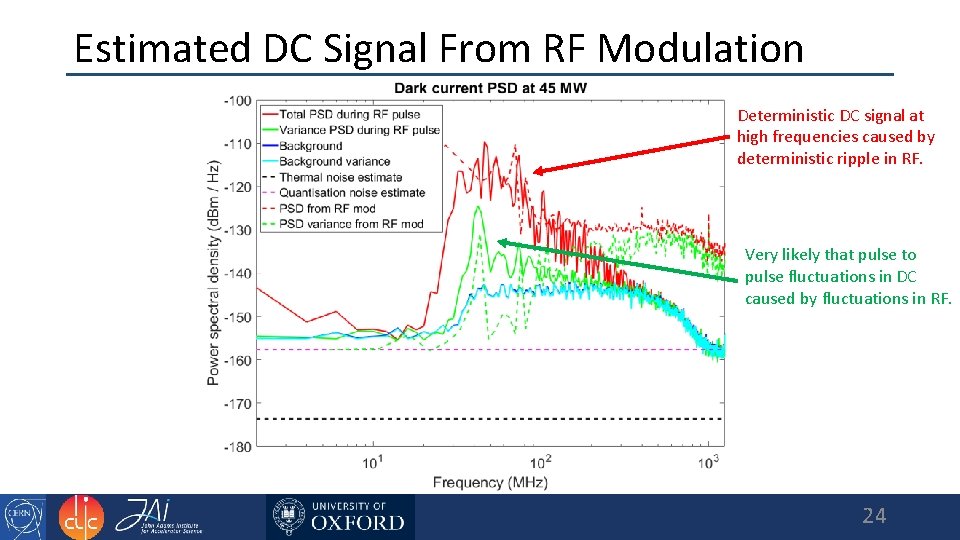
Estimated DC Signal From RF Modulation Deterministic DC signal at high frequencies caused by deterministic ripple in RF. Very likely that pulse to pulse fluctuations in DC caused by fluctuations in RF. 24
Conclusions and Further Steps • Random fluctuations in dark current observed, believed to be caused by fluctuations in incident RF pulse. • RF pulse frequency content and jitter should be controlled more precisely, or at least measured carefully. • Replace diode with mixer setup for better linearity and higher SNR.
Thank you! Questions? 26