Crawford Area Transportation Authority Living in Fast ForwardA
- Slides: 32
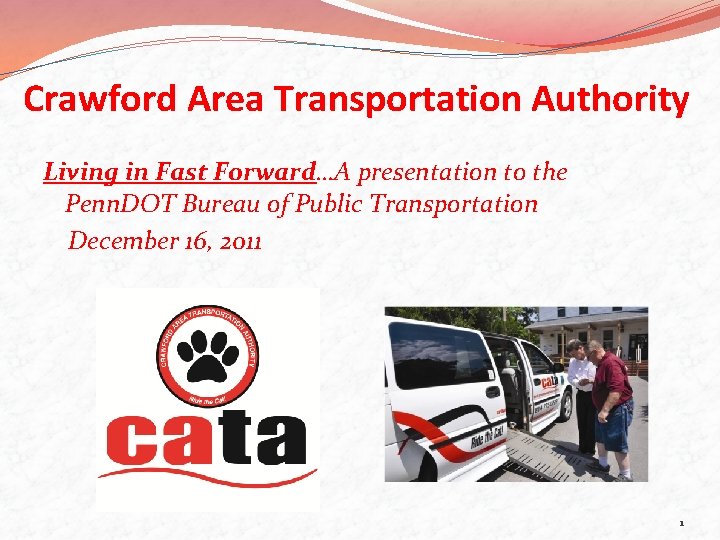
Crawford Area Transportation Authority Living in Fast Forward…A presentation to the Penn. DOT Bureau of Public Transportation December 16, 2011 1
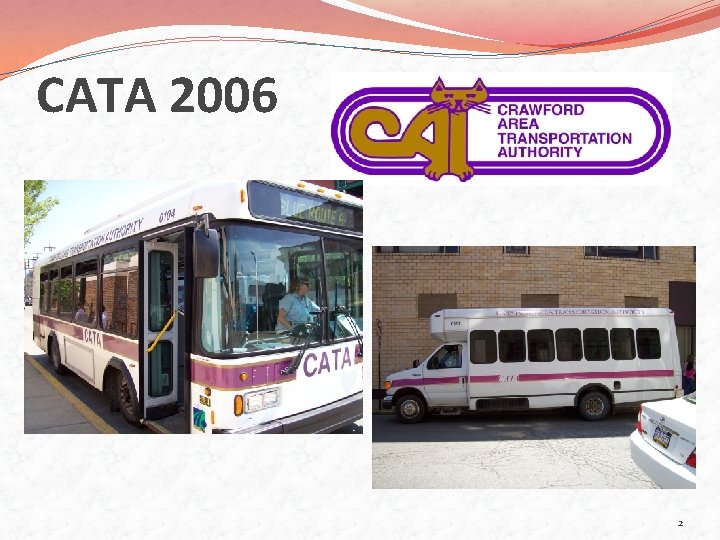
CATA 2006 2
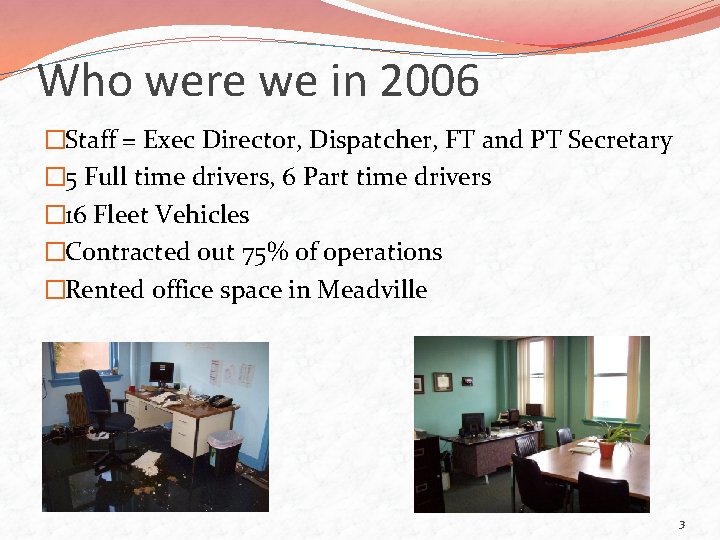
Who were we in 2006 �Staff = Exec Director, Dispatcher, FT and PT Secretary � 5 Full time drivers, 6 Part time drivers � 16 Fleet Vehicles �Contracted out 75% of operations �Rented office space in Meadville 3
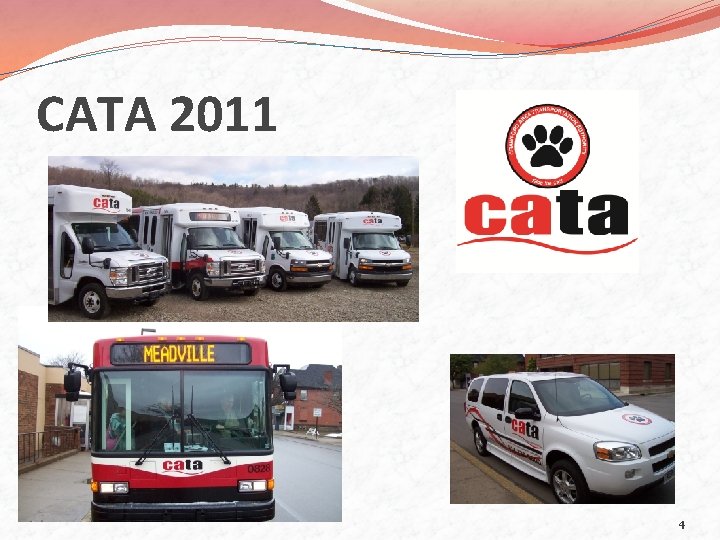
CATA 2011 4
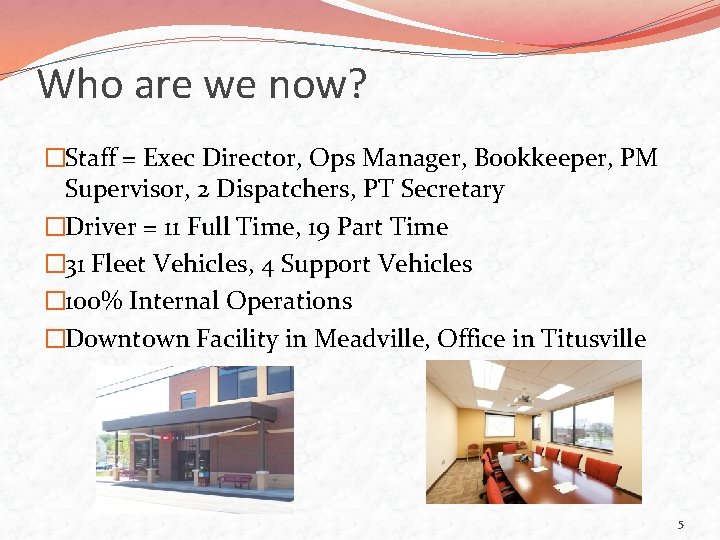
Who are we now? �Staff = Exec Director, Ops Manager, Bookkeeper, PM Supervisor, 2 Dispatchers, PT Secretary �Driver = 11 Full Time, 19 Part Time � 31 Fleet Vehicles, 4 Support Vehicles � 100% Internal Operations �Downtown Facility in Meadville, Office in Titusville 5
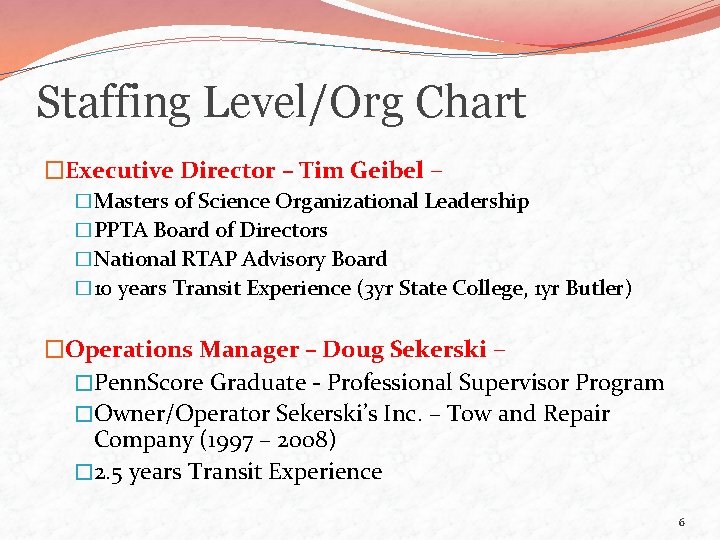
Staffing Level/Org Chart �Executive Director – Tim Geibel – �Masters of Science Organizational Leadership �PPTA Board of Directors �National RTAP Advisory Board � 10 years Transit Experience (3 yr State College, 1 yr Butler) �Operations Manager – Doug Sekerski – �Penn. Score Graduate - Professional Supervisor Program �Owner/Operator Sekerski’s Inc. – Tow and Repair Company (1997 – 2008) � 2. 5 years Transit Experience 6
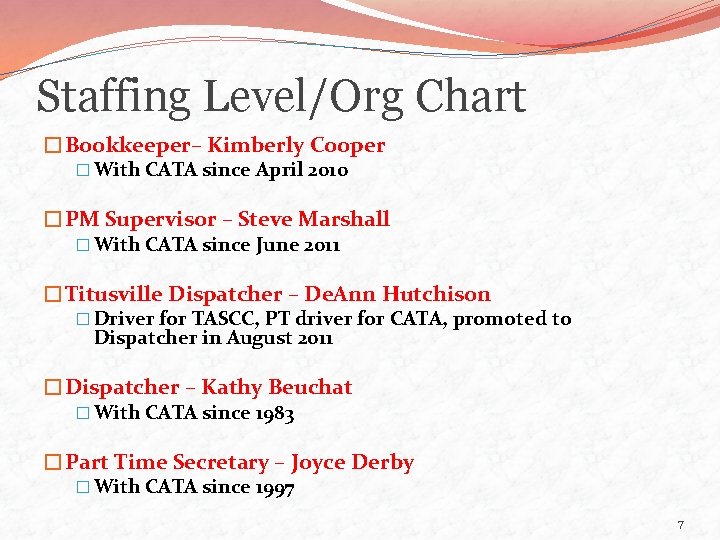
Staffing Level/Org Chart �Bookkeeper– Kimberly Cooper � With CATA since April 2010 �PM Supervisor – Steve Marshall � With CATA since June 2011 �Titusville Dispatcher – De. Ann Hutchison � Driver for TASCC, PT driver for CATA, promoted to Dispatcher in August 2011 �Dispatcher – Kathy Beuchat � With CATA since 1983 �Part Time Secretary – Joyce Derby � With CATA since 1997 7
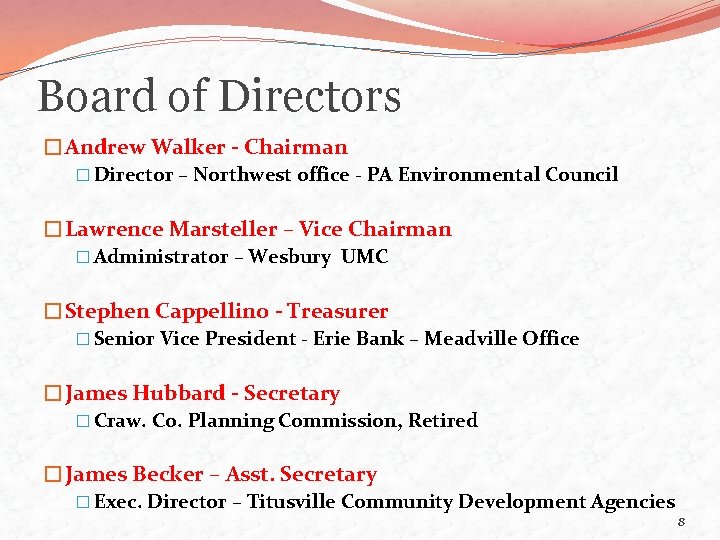
Board of Directors �Andrew Walker - Chairman � Director – Northwest office - PA Environmental Council �Lawrence Marsteller – Vice Chairman � Administrator – Wesbury UMC �Stephen Cappellino - Treasurer � Senior Vice President - Erie Bank – Meadville Office �James Hubbard - Secretary � Craw. Co. Planning Commission, Retired �James Becker – Asst. Secretary � Exec. Director – Titusville Community Development Agencies 8
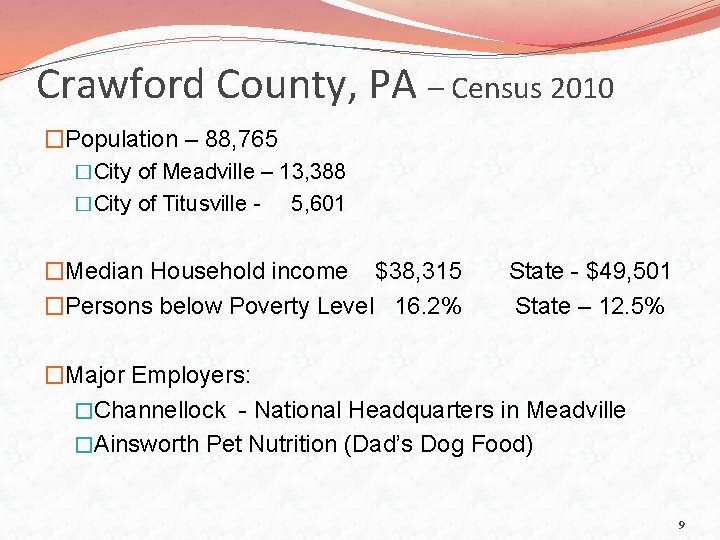
Crawford County, PA – Census 2010 �Population – 88, 765 �City of Meadville – 13, 388 �City of Titusville - 5, 601 �Median Household income $38, 315 �Persons below Poverty Level 16. 2% State - $49, 501 State – 12. 5% �Major Employers: �Channellock - National Headquarters in Meadville �Ainsworth Pet Nutrition (Dad’s Dog Food) 9
How we provide service �Fixed Route � 7 Meadville Routes, 2 Titusville �Shared Ride �County-wide operation � 7 day service in Meadville, 6 day service in Titusville �Various levels of service throughout rest of County �Partnerships with Active Aging 10
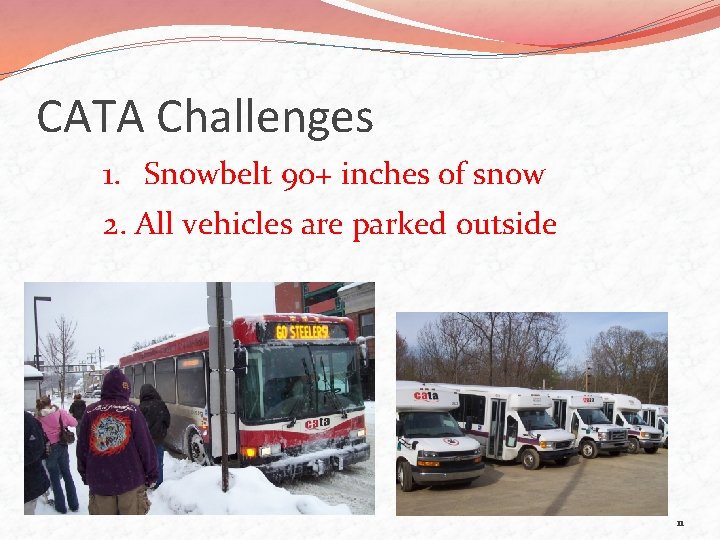
CATA Challenges 1. Snowbelt 90+ inches of snow 2. All vehicles are parked outside 11
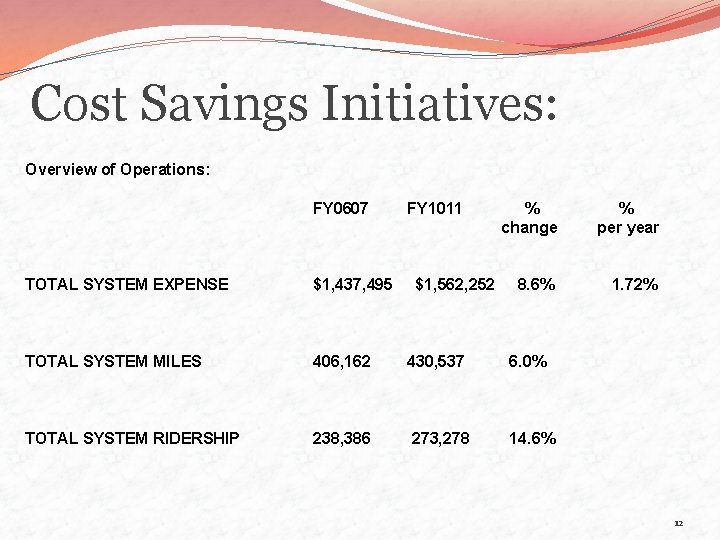
Cost Savings Initiatives: Overview of Operations: FY 0607 FY 1011 $1, 562, 252 % change % per year 8. 6% 1. 72% TOTAL SYSTEM EXPENSE $1, 437, 495 TOTAL SYSTEM MILES 406, 162 430, 537 6. 0% TOTAL SYSTEM RIDERSHIP 238, 386 273, 278 14. 6% 12
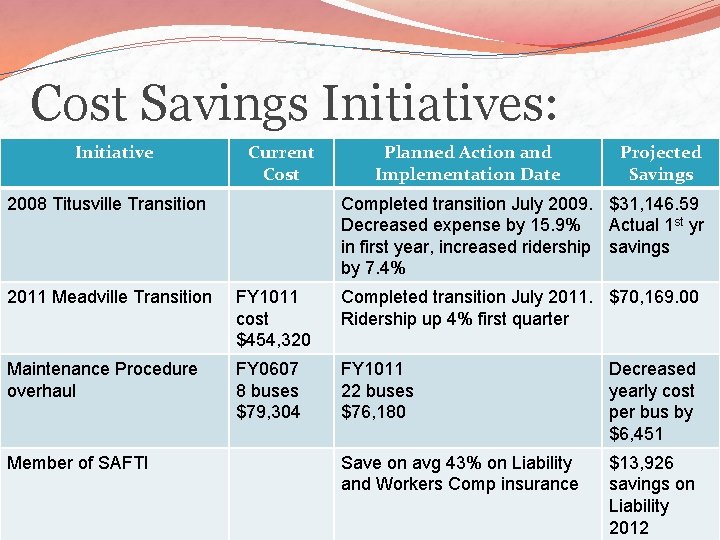
Cost Savings Initiatives: Initiative Current Cost 2008 Titusville Transition Planned Action and Implementation Date Projected Savings Completed transition July 2009. $31, 146. 59 Decreased expense by 15. 9% Actual 1 st yr in first year, increased ridership savings by 7. 4% 2011 Meadville Transition FY 1011 cost $454, 320 Completed transition July 2011. $70, 169. 00 Ridership up 4% first quarter Maintenance Procedure overhaul FY 0607 8 buses $79, 304 FY 1011 22 buses $76, 180 Decreased yearly cost per bus by $6, 451 Save on avg 43% on Liability and Workers Comp insurance $13, 926 savings on Liability 2012 13 Member of SAFTI
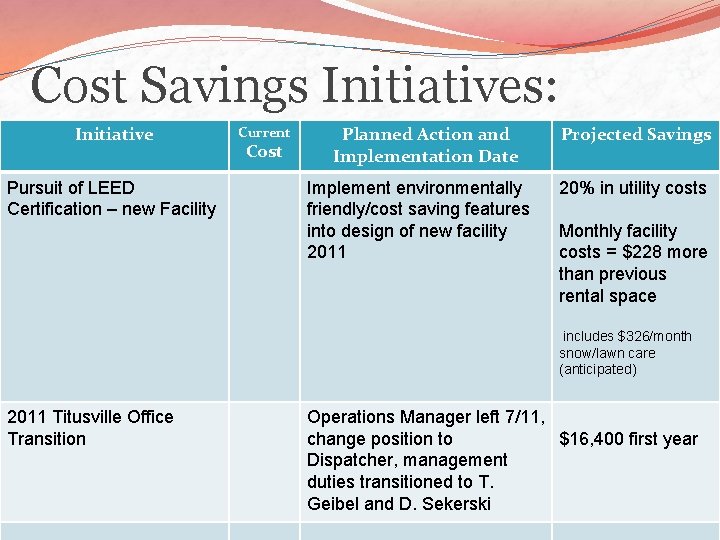
Cost Savings Initiatives: Initiative Pursuit of LEED Certification – new Facility Current Cost Planned Action and Implementation Date Implement environmentally friendly/cost saving features into design of new facility 2011 Projected Savings 20% in utility costs Monthly facility costs = $228 more than previous rental space includes $326/month snow/lawn care (anticipated) 2011 Titusville Office Transition Operations Manager left 7/11, change position to $16, 400 first year Dispatcher, management duties transitioned to T. Geibel and D. Sekerski 14
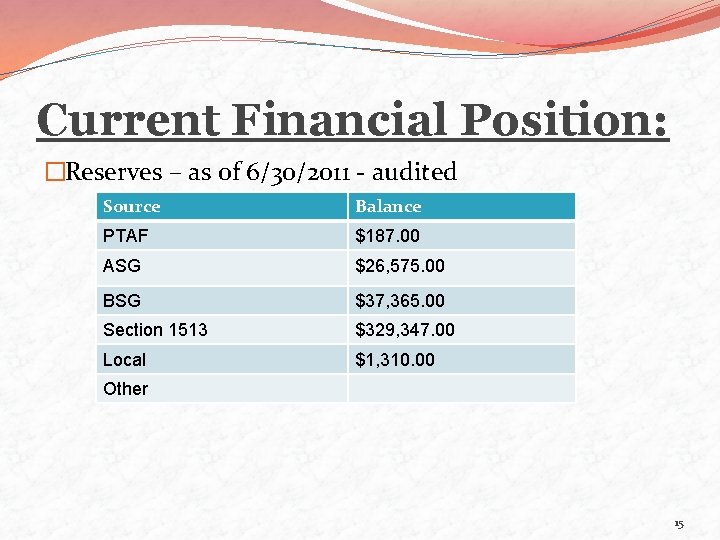
Current Financial Position: �Reserves – as of 6/30/2011 - audited Source Balance PTAF $187. 00 ASG $26, 575. 00 BSG $37, 365. 00 Section 1513 $329, 347. 00 Local $1, 310. 00 Other 15
Current Financial Position: e l b �Level of Short-Term Debt/Loans—Identify each line of credit (excludes long-term bond financing) Name of Financial Institution l p a ic Amount of Available Credit p A n Interest Rate Current Credit in Use o N 16
Current Financial Position: �Accounts Payable – Past due 90 days and over Vendor Amount Past Due p A n a ic l p e l b Estimated Pay Date �Accounts Receivable – Past due 90 days and over o N Program/Agency Amount Past Due Date Requisitioned Estimated Pay Date 17
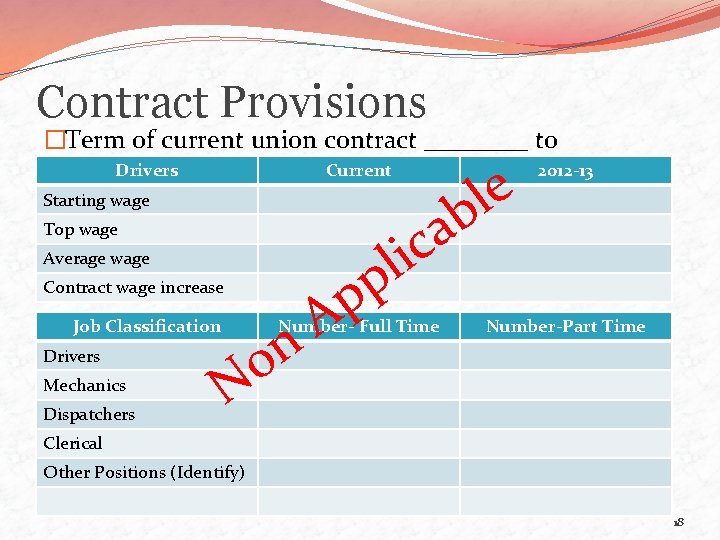
Contract Provisions �Term of current union contract ____ to Drivers Current 2012 -13 _____ Starting wage Top wage Contract wage increase Job Classification Drivers Mechanics Dispatchers a ic l p Average wage n o p A Number- Full Time N e l b Number-Part Time Clerical Other Positions (Identify) 18
Important Contract Provisions e l b �Use of part-time employees l p a ic �Number/percent of “split shift” drivers �Overtime �Outsourcing N n o p A �Other 19
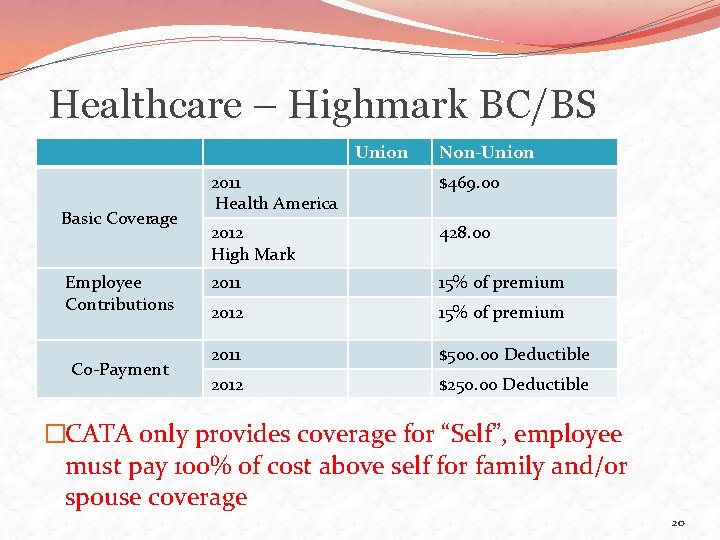
Healthcare – Highmark BC/BS Union Basic Coverage Employee Contributions Co-Payment Non-Union 2011 Health America $469. 00 2012 High Mark 428. 00 2011 15% of premium 2012 15% of premium 2011 $500. 00 Deductible 2012 $250. 00 Deductible �CATA only provides coverage for “Self”, employee must pay 100% of cost above self for family and/or spouse coverage 20
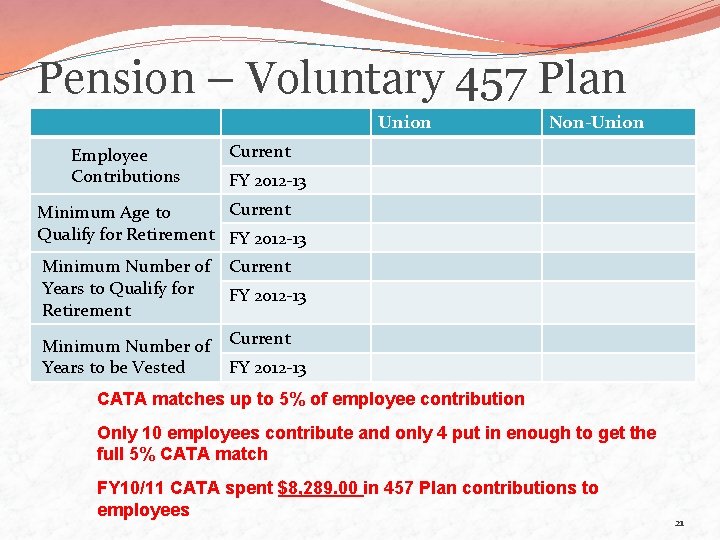
Pension – Voluntary 457 Plan Union Employee Contributions Non-Union Current FY 2012 -13 Current Minimum Age to Qualify for Retirement FY 2012 -13 Minimum Number of Years to Qualify for Retirement Current Minimum Number of Years to be Vested Current FY 2012 -13 CATA matches up to 5% of employee contribution Only 10 employees contribute and only 4 put in enough to get the full 5% CATA match FY 10/11 CATA spent $8, 289. 00 in 457 Plan contributions to employees 21
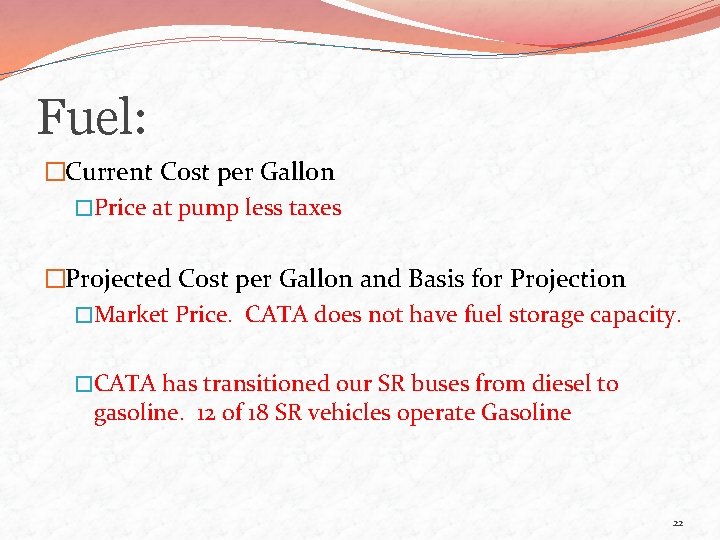
Fuel: �Current Cost per Gallon �Price at pump less taxes �Projected Cost per Gallon and Basis for Projection �Market Price. CATA does not have fuel storage capacity. �CATA has transitioned our SR buses from diesel to gasoline. 12 of 18 SR vehicles operate Gasoline 22
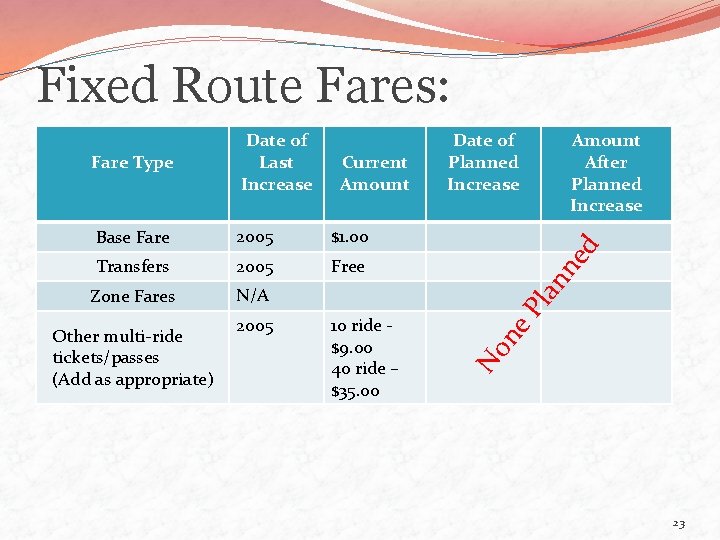
Fixed Route Fares: Transfers 2005 Free Zone Fares N/A Other multi-ride tickets/passes (Add as appropriate) 2005 10 ride $9. 00 40 ride – $35. 00 ne d $1. 00 Pl an 2005 Amount After Planned Increase ne Base Fare Current Amount Date of Planned Increase No Fare Type Date of Last Increase 23
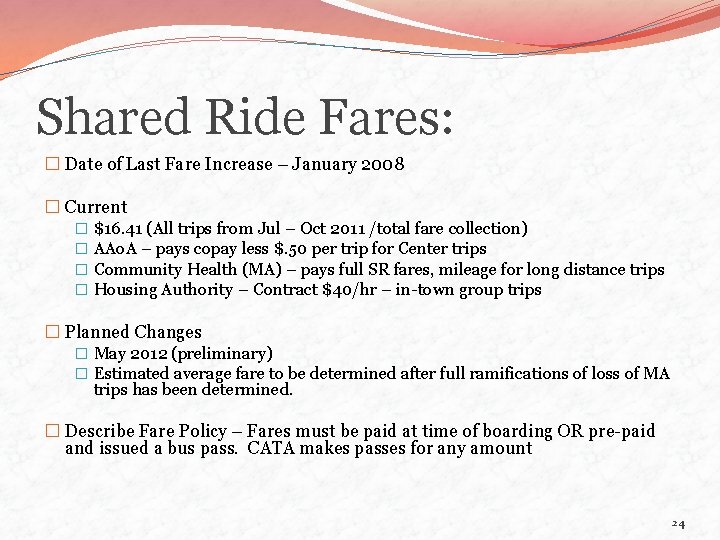
Shared Ride Fares: � Date of Last Fare Increase – January 2008 � Current � $16. 41 (All trips from Jul – Oct 2011 /total fare collection) � AAo. A – pays copay less $. 50 per trip for Center trips � Community Health (MA) – pays full SR fares, mileage for long distance trips � Housing Authority – Contract $40/hr – in-town group trips � Planned Changes � May 2012 (preliminary) � Estimated average fare to be determined after full ramifications of loss of MA trips has been determined. � Describe Fare Policy – Fares must be paid at time of boarding OR pre-paid and issued a bus pass. CATA makes passes for any amount 24
Other Major Factors Producing Cost Increases Beyond Inflation: Factors Current Amount Example: Subcontracts Example: Employee Retention (Add others or change as appropriate) N n o Projected Future Amount p A l p a ic e l b Explanation 25
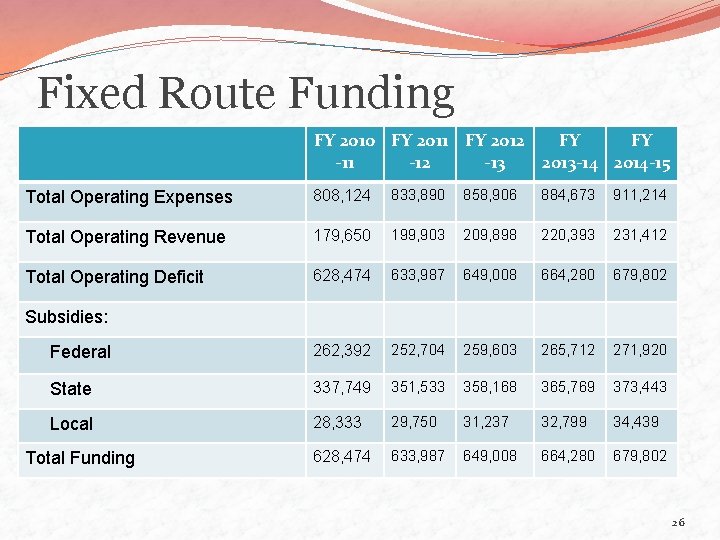
Fixed Route Funding FY 2010 FY 2011 FY 2012 FY FY -11 -12 -13 2013 -14 2014 -15 Total Operating Expenses 808, 124 833, 890 858, 906 884, 673 911, 214 Total Operating Revenue 179, 650 199, 903 209, 898 220, 393 231, 412 Total Operating Deficit 628, 474 633, 987 649, 008 664, 280 679, 802 Federal 262, 392 252, 704 259, 603 265, 712 271, 920 State 337, 749 351, 533 358, 168 365, 769 373, 443 Local 28, 333 29, 750 31, 237 32, 799 34, 439 628, 474 633, 987 649, 008 664, 280 679, 802 Subsidies: Total Funding 26
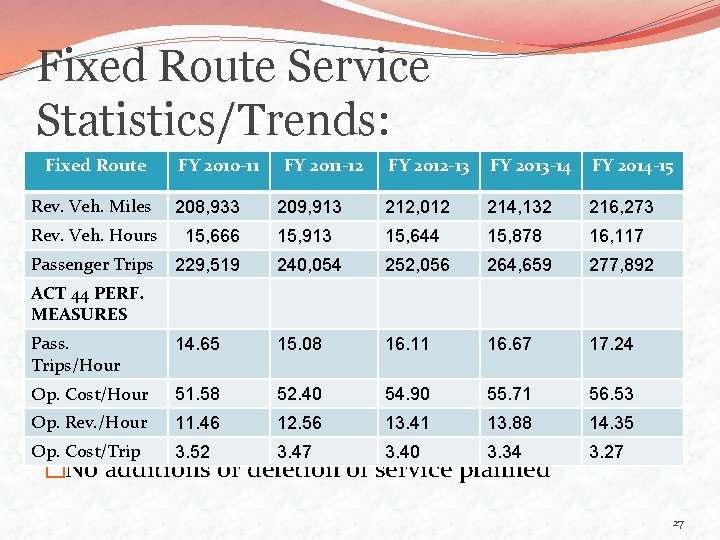
Fixed Route Service Statistics/Trends: Fixed Route FY 2010 -11 FY 2011 -12 FY 2012 -13 FY 2013 -14 FY 2014 -15 Rev. Veh. Miles 208, 933 209, 913 212, 012 214, 132 216, 273 Rev. Veh. Hours 15, 666 15, 913 15, 644 15, 878 16, 117 Passenger Trips �Describe ACT 44 PERF. MEASURES 229, 519 240, 054 252, 056 Any Proposed Changes 264, 659 277, 892 Pass. Trips/Hour 14. 65 15. 08 16. 11 16. 67 17. 24 Op. Cost/Hour 51. 58 52. 40 54. 90 55. 71 56. 53 Op. Rev. /Hour 11. 46 12. 56 13. 41 13. 88 14. 35 Op. Cost/Trip 3. 52 3. 47 3. 40 3. 34 3. 27 �No additions or deletion of service planned 27
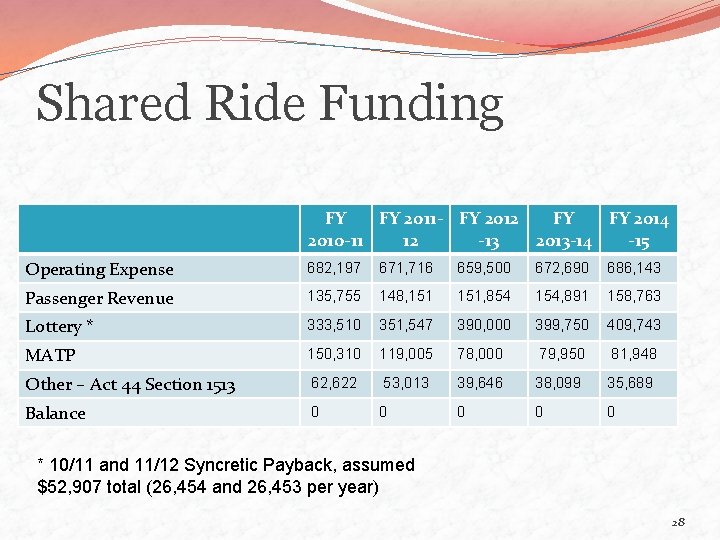
Shared Ride Funding FY FY 2011 - FY 2012 FY FY 2014 2010 -11 12 -13 2013 -14 -15 Operating Expense 682, 197 671, 716 659, 500 672, 690 686, 143 Passenger Revenue 135, 755 148, 151, 854 154, 891 158, 763 Lottery * 333, 510 351, 547 390, 000 399, 750 409, 743 MATP 150, 310 119, 005 78, 000 79, 950 81, 948 Other – Act 44 Section 1513 62, 622 53, 013 39, 646 38, 099 35, 689 Balance 0 0 0 * 10/11 and 11/12 Syncretic Payback, assumed $52, 907 total (26, 454 and 26, 453 per year) 28
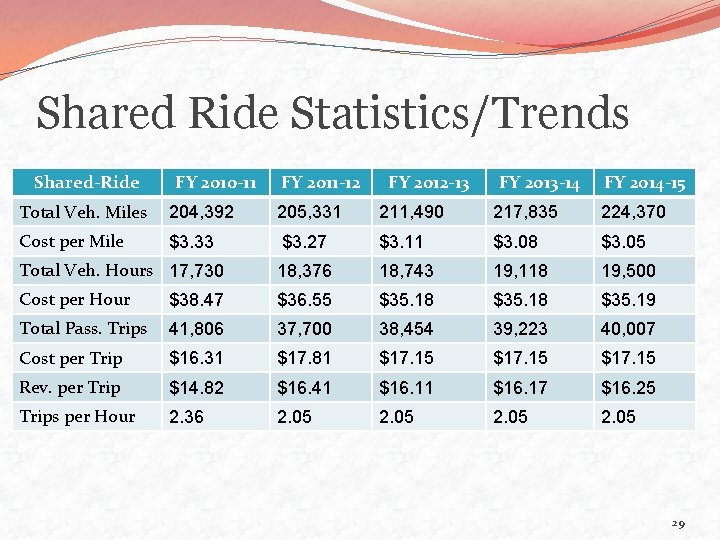
Shared Ride Statistics/Trends Shared-Ride FY 2010 -11 FY 2011 -12 FY 2012 -13 FY 2013 -14 FY 2014 -15 Total Veh. Miles 204, 392 205, 331 211, 490 217, 835 224, 370 Cost per Mile $3. 33 $3. 27 $3. 11 $3. 08 $3. 05 Total Veh. Hours 17, 730 18, 376 18, 743 19, 118 19, 500 Cost per Hour $38. 47 $36. 55 $35. 18 $35. 19 Total Pass. Trips 41, 806 37, 700 38, 454 39, 223 40, 007 Cost per Trip $16. 31 $17. 81 $17. 15 Rev. per Trip $14. 82 $16. 41 $16. 17 $16. 25 Trips per Hour 2. 36 2. 05 29
Capital Status Review – Decade Needs Assessment � Storage and Wash Facility – 3 Million – awaiting State Bond Funding, Conceptual Plan completed 2010 � Shared Ride Dispatch Software - $150, 000 � Standard Fleet Replacement – 12 -20 passenger buses and minivans � FY 2013 - 3 vehicles $255, 000 � FY 2014 - 7 vehicles $580, 000 � FY 2016 - 8 vehicles $585, 000 � 2020 Major Fleet replacement – Gilligs – 1. 6 Million 30
Looking to the Future �Regional Coordination with Venango County �In 2010, CATA secured letters of interest in a feasibility study from Crawford and Venango Commissioners �Sustainability of Shared Ride program �Major cut backs in MA service, anticipated loss of $60, 000 - $125, 00 of revenue per year 31
Questions? !? 32