Climate Networks Extreme Events Jrgen Kurths Potsdam Institute


our life these days?")
 Strong drought that spring in North Korea Kim Jong")


 New (inverse) problems arise!")
 theory for system Earth")


 Network Approach")


 surface pressure 1948 –")


 Topography and simplied SAMS mechanisms. (b) 99 th percentile of hourly rainfall during")
 > 0 – sink: extreme events here preceded")

 of extreme rainfall")
, ECMWF (Re-Analysis),")

")


 • Phys. Rev.")


 4 weeks • Significance 0. 001 (student´s test)")
- Slides: 66
Climate Networks & Extreme Events Jürgen Kurths Potsdam Institute for Climate Impact Research & Institut of Physics, Humboldt-Universität zu Berlin & King‘s College, University of Aberdeen juergen. kurths@pik-potsdam. de http: //www. pik-potsdam. de/members/kurths/
Main Collaborators: - PIK Potsdam N. Boers, J. Donges, N. - Marwan, N. Molkenthin, J. Runge, V. Petoukhov, V. Stolbova UC Sta Barbara B. Bookhagen Uni North Carol. N. Malik, P. Mucha INPE (Brazil) J. Marengo UWA (Austral. ) M. Small Uni Utrecht H. Dijkstra Acad Sc (Czech) M. Palus, J. Hlinka
Contents • • • Introduction Climate networks Event synchronization Extreme floods in Central Andes Monsoon dynamics in India Conclusions
Working in operational prediction of extreme events dangerous for (y)our life these days?
Headline News (June 12, 2014) Strong drought that spring in North Korea Kim Jong Un: responsible are the meteorologists due to their bad forecasts
Main building of PIK: Michelson House Albert Abraham Michelson made experiments here in 1881 when he worked in Berlin&Potsdam (Germany)
Telegraph Hill: Scientific Breakthroughs Ernst von Rebeur-Paschwitz 1861 -1895 1832/33 Opto. Mechanical Telegraph Line Station No. 4 Potsdam First Solution of Einstein‘s Equations Secular Station Potsdam Reinhard Süring 1866 -1950 1889 First Record of Teleseismic Earthquake Karl Schwarzschild 1873 -1916 Albert Einstein 1879 -1955 Friedrich Robert Helmert 1843 -1917 1904 Interstellar Matter Large Refractor Johannes Hartmann 1865 -1936 1881 Michelson Experiment 1870 -1950 Potsdam Datum Point Helmert Tower Albert Abraham Michelson, 1852 -1931 8
PIK: Mission • PIK addresses crucial scientific questions in the fields of global change, climate impact and sustainable development. • Researchers from the natural and social sciences work together to generate interdisciplinary insights and to provide society with sound information for decision making. • The main methodologies are systems and scenarios analysis, modelling, computer simulation, and data integration
Research Domain IV Transdisciplinary Concepts and Methods
Research Domain 4: Transdisciplinary Concepts and Methods
Humboldt Universität zu Berlin Founded in 1809 teaching & research Wilhelm von Humboldt 30 Nobel laureats (Planck, Einstein, van ´t Hoff, Nernst, Hahn, Koch…) University of Excellence
Complex Networks Origin in Social Networks
Social Networks
Complex Network Approach to Climate
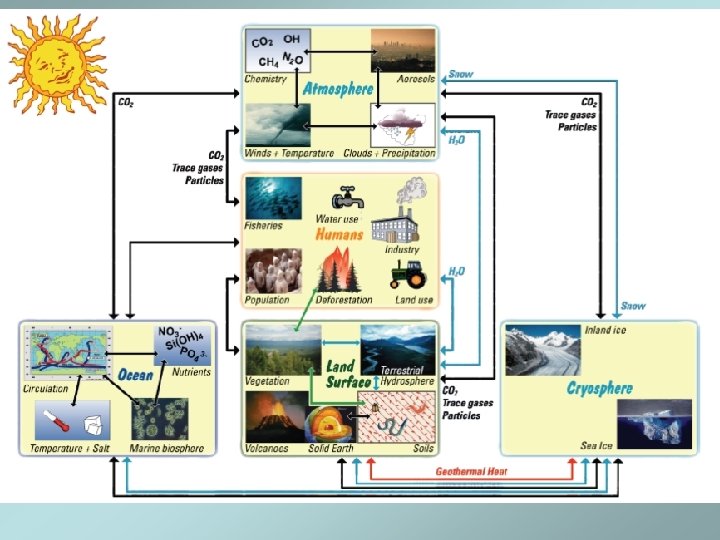
System Earth
Network Reconstruction from a continuous dynamic system (structure vs. functionality) New (inverse) problems arise! Is there a backbone underlying the climate system?
Basic Idea: Use of rich instrumentarium of complex network (graph) theory for system Earth and sustainability Hope: Deepened understanding of system Earth (with other techniques NOT possible)
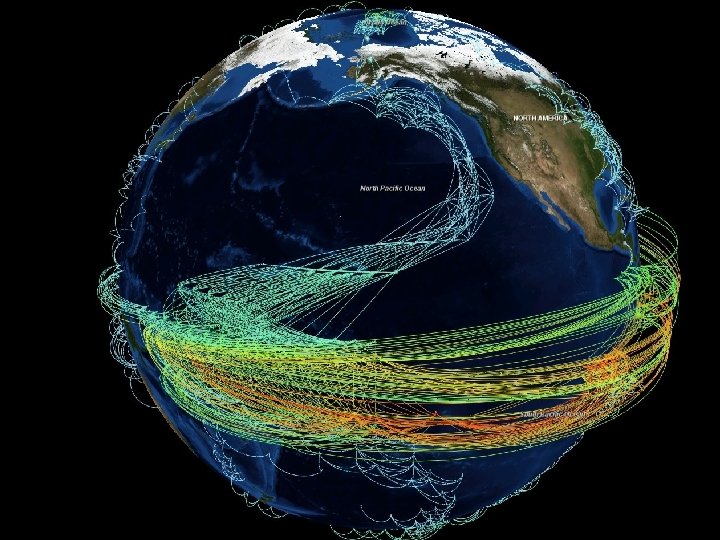
Climate Networks Observation sites Earth system Climate network Network analysis Time series
Infer long-range connections – Teleconnections
Complex network approach to climate system
Visual Analytics tools temperature climate networks scalable for > 100. 000 edges graphics card implementation 2 D node layout (360 degree circular projection) avoiding edge clutter at the equator Thomas Nocke, PIK
Artifacts and Interpretation of (Climate) Network Approach
Reconstructing causality from data ? Artefacts due to - Common drivers - Indirect links Achievements 1. Causal algorithm to efficiently detect linear and nonlinear links (Phys. Rev. Lett. 2012) 2. Quantifying causal strength with Momentary Information Transfer (Phys. Rev. E 2012) 3. Reconstructing Walker Circulation from data (J. Climate 2014, ) 28
Reconstructing causality from data Classic techniques Correlation/regression Advanced method conditional independencies
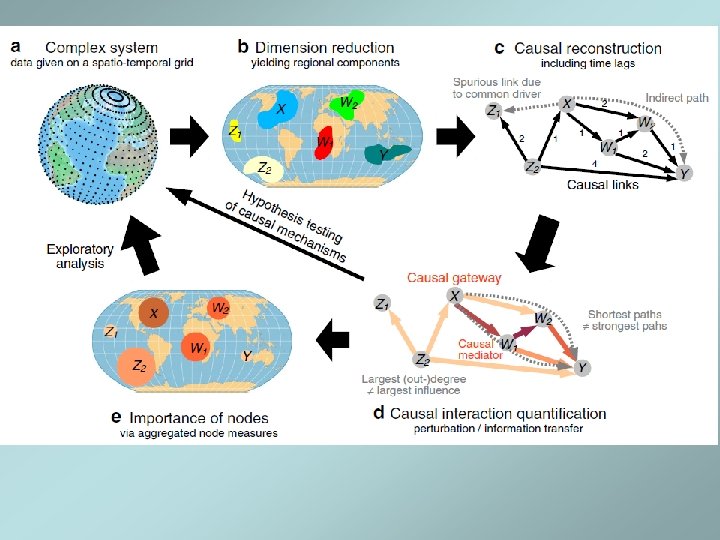
Identifying causal gateways and mediators in complex spatio-temporal systems • Step 1: Dimension reduction via VARIMAX (principal components, rotation, significance) • Step 2: Causal reconstruction: identify causalities based on conditional dependencies (different time lags) • Step 3: Causal interaction quantification: identify strongest paths • Step 4: Hypothesis testing of causal mechanisms Nature Commun, 6, 8502 (2015)
Atmospheric data • • • Reanalysis data – NCEP/NCAR (Boulder) surface pressure 1948 – 2012 Spatial resolution: 2. 5º → 10, 512 grid points Weekly data: each node time series of 3, 339 points
60 strongest VARIMAX components refer to main climatic patterns • ENSO: “ 0” – western uplift, “ 1” – eastern downdraft limbs • Monsoon: “ 33” Arabian Sea high-surface-pressure sector, “ 26” tropical Atlantic West African Monsoon system
Identification of causal pathways Effects of sea level pressure anomalies in ENSO region to pressure variability in the Arabic Sea via the Indonesian Archipelago
Extreme Events Strong Rainfall during Monsoon Challenge: Predictability
Motivation: the predictability of the Indian monsoon remains a problem of vital importance Objectives: to reveal spatial structures in network of extreme events over the Indian subcontinent and their seasonal evolution during the year.
New Technique: Event Synchronization
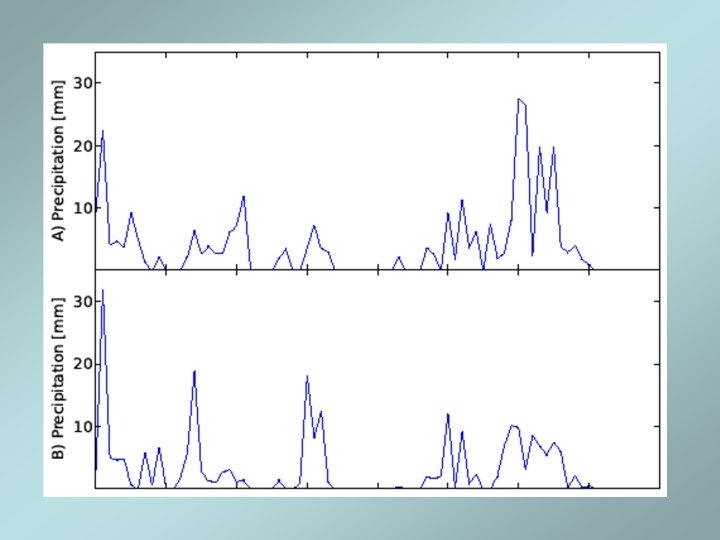
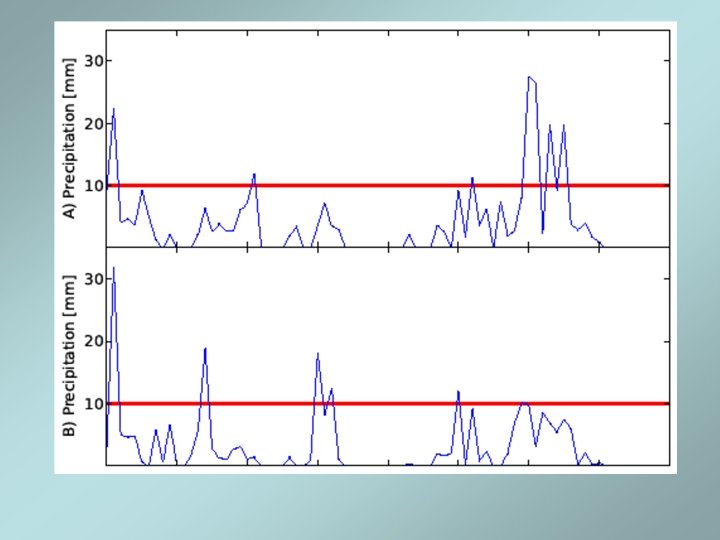
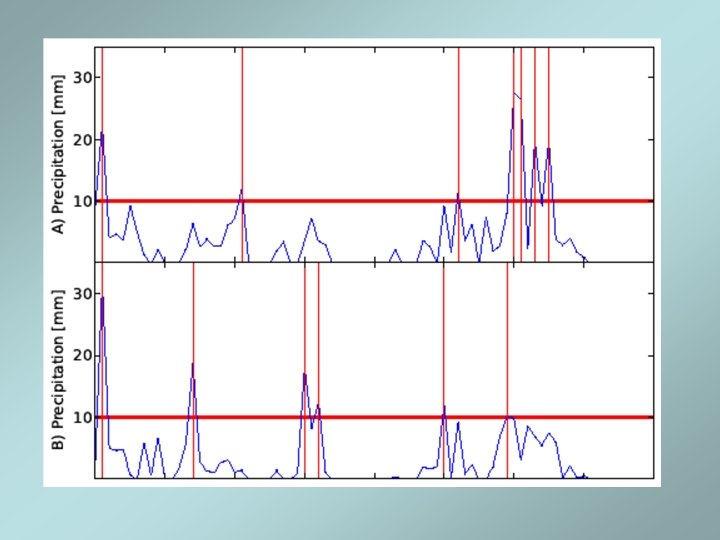
2. Event synchronization 1. Network approach Nodes: geographical locations Links: synchronization of extreme rainfall events between nodes Step 1. Apply a threashold to time series of each grid point to obtain event series Rainfall amount (mm/day) METHOD Time (days) Step 2. Event synchronization – use time lags to compare individual events between two grid points Step 3. Construct the network by creating links between points with the highest synchronization values Network measures degree Average link lengths betweenness Network Quiroga et. al. 2002 422011 Malik et. al. Boers et. al. 2013
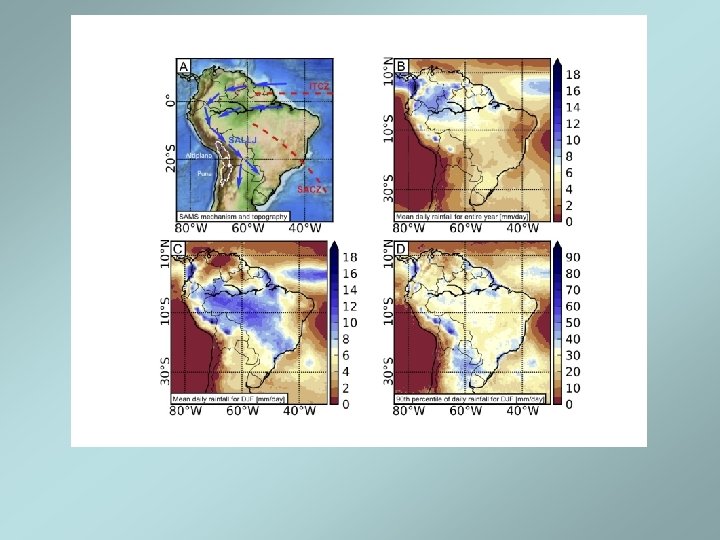
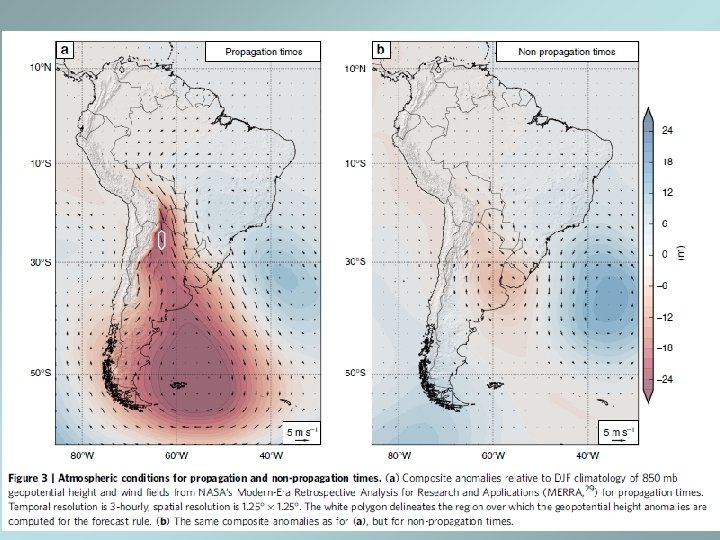
Extreme Rainfall Events of the South American Monsoon System • • TRMM 3 B 42 V 7 daily satellite data Measured: Jan 1, 1998 – March 31, 2012 Spatial resolution: 0. 25 x 0. 25 Spatial coverage: Method: event synchronization Extreme event: > 99 % percentile Dec-Feb (DJF) – summer monsoon months
(a) Topography and simplied SAMS mechanisms. (b) 99 th percentile of hourly rainfall during DJF derived from TRMM 3 B 42 V 7. (c) Fraction of total DJF rainfall accounted for by events above the 99 th percentile. (d) Rainfall time series of concatenated DJF seasons and the corresponding 99 th percentile for a grid cell located at the ECA at 17 S and 66 W.
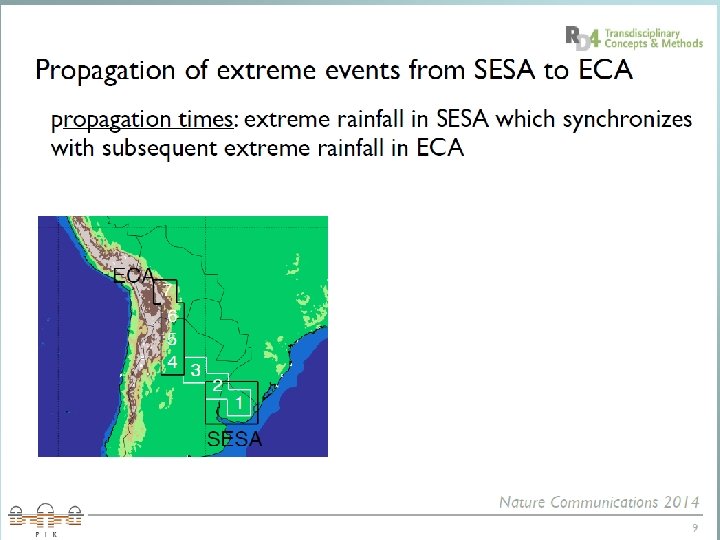
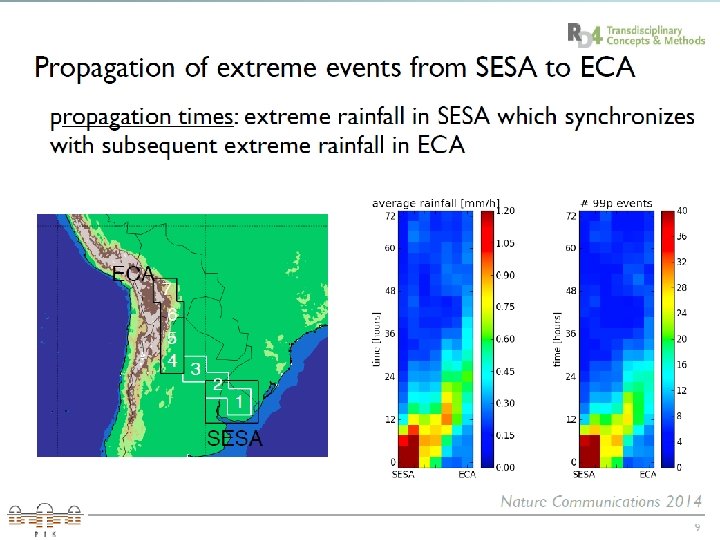
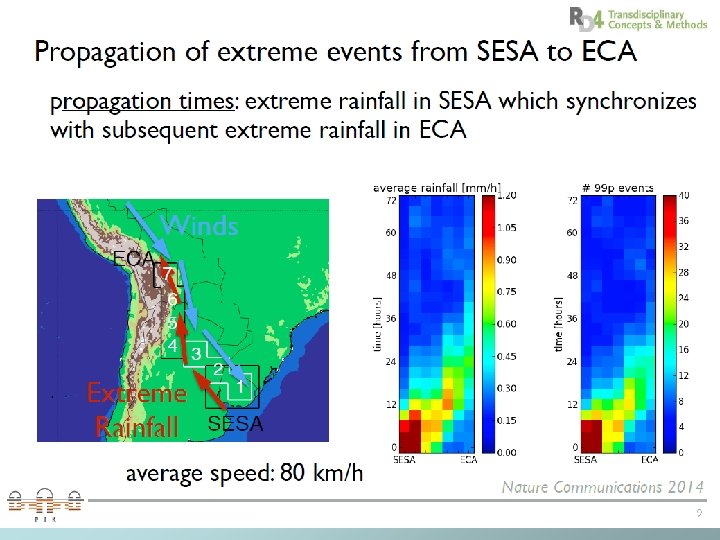
Non-symmetric Adjacency Matrix (in – out) > 0 – sink: extreme events here preceded by those at another location < 0 – source: extreme events follow at another location
SESA – Southeast South America ECA – Eastern Central Andes
• > 60 % (90 % during El Nino conditions) of extreme rainfall events in Eastern Central Andes (ECA) are preceded by those in Southeastern South America (SESA) • Low pressure anomaly from Rossbywave activity propagates northwards (cold front) and low-level wind channel from Amazon Nature Commun. (2014), GRL (2014), J. Clim. (2014), Clim. Dyn. (2015)
Model comparison via networks • TRMM data, ECHAM 6 (Global circulation model), ECMWF (Re-Analysis), ETA (regional climate model) • → Strong differences found • ECHAM 6 closest to data Clim. Dyn. 2015
Indian Monsoon
Data: • APHRODITE: daily rainfall, raingauge interpolated, 0. 5 °/0. 25° resolution (1951 -2007) • TRMM: daily rainfall, satellitederived, 0. 25° (1998 -2013) • NCEP/NCAR: reanalysis, 2. 5 °, T, P, winds, vorticity, divergency
Spatial patterns of extreme rainfall: TRMM Common network measures for three time periods: pre-monsoon (MAM), Summer (ISM) Links between a set of 153 reference grid points to and Winter monsoon (WM). other grid points and Surface Vector Winds mean 1998 -2012. From top to bottom: North Pakistan Stolbova V. , Martin P. , Bookhagen B. , Kurths J. , Nonlin. Proc. in Geophysics, (NP), Tibetan Plateau (TP), Eastern Ghats (EG). 2014
Spatial patterns of extreme rainfall: APHRODITE Common network measures for three time periods: pre-monsoon (MAM), Summer (ISM) and Winter monsoon (WM). Links between a set of 45 reference grid points to other grid points and Surface Vector Winds mean 1998 -2012. From top to bottom: North Pakistan Nonlin. Proc. in Geophysics, 2014 (NP), Tibetan Plateau (TP), Eastern Ghats (EG).
Spatial patterns of extreme rainfall q Network approach allows to reveal spatial structures of extreme rainfall synchronization. q Identified essential spatial domains (North Pakistan, Eastern Ghats and Tibetan Plateau) for the synchronization of extreme rainfall during the Indian Summer Monsoon which appear during the pre-monsoon season, evolve during ISM and disappear during the postmonsoon season. q Findings open possibility to account spatial distribution of essential patterns in determining the ISM timing and strength by observation of rainfall variability within dominant patterns.
Summary • Complex climate networks promising approach • Network divergence: a general tool to analyze extreme event propagation in complex systems • Explains intraseasonal variability of moisture flux from the Amazon to the subtropics: Rossby Waves • Prediction of floods in the Central Andes • Approach in its infancy – many open problems
Our papers on climate networks • Europhys. Lett. 87, 48007 (2009) • Phys. Rev. E 81, 015101 R (2010) • Climate Dynamics 39, 971 (2012) • PNAS 108, 20422 (2011) • Phys. Rev. Lett. 106, 258701 (2012) • Europhys. Lett. 97, 40009 (2012) • Climate Past 8, 1765 (2012) • Geophys. Res. Lett. 40, 2714 (2013) • Climate Dynamics 41, 3 (2013) • J. Climate 27, 720 (2014) • Nature Scientific Reports 4, 4119 (2014) • Climate Dynamics (2014) • Geophys. Res. Lett. 41, 7397 (2014) • Nature Commun. 5, 5199 (2014) • Climate Dynamics 44, 1567 (2015) • J. Climate 28, 1031 (2015) • Climate Past 11, 709 (2015) • Climate Dynamics (online 2015) • Nature Commun. 6, 8502 (2015)
Codes available • Unified functional network and nonlinear time series analysis for complex systems science: The pyunicorn software package, CHAOS 25, 113101 (2015) https: //github. com/pik-copan/pyunicorn • Causal network identification: Python software script by J. Runge http: //tocsy. pik-potsdam. de/tigramite. php
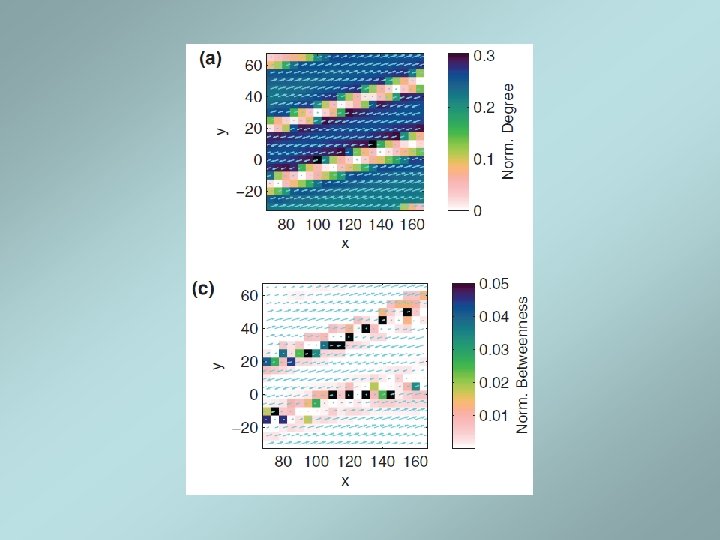
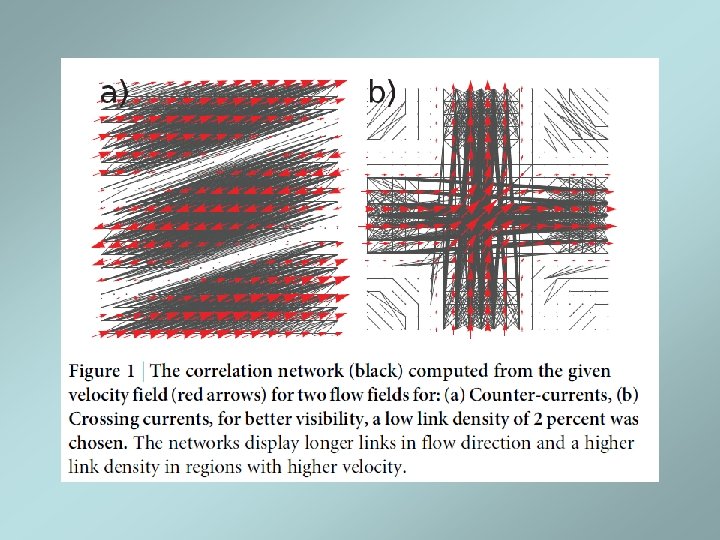
Test of the climate network reconstruction method: Networks from special flows • Advection-diffusion dynamics on a background flow • Analytic and numerical treatment compared with correlation-based reconstruction of simulated data Nature Scientific Rep. 4, 4119 (2014) Nonlin. Proc. Geophys. 21, 651 (2014)
Algorithmic parameters causal • Ƭ (max) 4 weeks • Significance 0. 001 (student´s test) • Tigramite approach (time series graphbased measure of information transfer)