Chapter 53 POPULATION ECOLOGY Adapted from Mrs Chous


 •")

 of")


:")
 = 7. 7 billion https: //www.")
- Slides: 32
Chapter 53 POPULATION ECOLOGY Adapted from Mrs. Chou’s presentation
Ch. 53 Vocabulary Define: Demography Semelparity Iteroparity Carrying capacity Exponential growth curve Logistic growth curve K-selection r-selection Ecological footprint
You Must Know: • How density, dispersion, and demographics can describe a population. • The differences between exponential and logistic models of population growth. • How density-dependent and densityindependent factors can control population growth.
Introduction • Population = group of individuals of a single species living in same general area • Density: # individuals / area • Dispersion: pattern of spacing between individuals
Determining population size and density: • Count every individual • Random sampling • Mark-recapture method
Patterns of Dispersal: 1. Clumped – most common; near required resource 2. Uniform – usually antagonistic interactions 3. Random – unpredictable spacing, not common in nature
Demography: the study of vital statistics of populations and how they change over time • Additions occur through birth, and subtractions occur through death. • Life table: age-specific summary of the survival pattern of a population
Survivorship Curve: represent # individuals alive at each age • Type I: low death rate early in life (humans) • Type II: constant death rate over lifespan (squirrels) • Type III: high death rate early in life (oysters)
Change in Population Size = Births during time interval - Deaths during time interval
Zero Population Growth
Population Growth Models
Exponential population growth: ideal conditions, population grows rapidly
Exponential Growth Equation d. N/dt = change in population r = growth rate of pop. N = population size
Exponential Growth Problem Sample Problem: A certain population of mice is growing exponentially. The growth rate of the population (r) is 1. 3 and the current population size (N) is 2, 500 individuals. How many mice are added to the population each year?
• Unlimited resources are rare! • Logistic model: incorporates carrying capacity (K) • K = maximum stable population which can be sustained by environment
Logistic Growth Equation d. N/dt = change in population r = growth rate of pop. N = population size K = carrying capacity
Logistic Growth Problem Sample Problem: If a population has a carrying capacity (K) of 900, and the growth rate (r) is 1. 1, what is the population growth when the population (N) is 425?
Life History: traits that affect an organism’s schedule of reproduction and survival 3 Variables: 1. Age of sexual maturation 2. How often organism reproduces 3. # offspring produced per reproductive episode Note: These traits are evolutionary outcomes, not conscious decisions by organisms
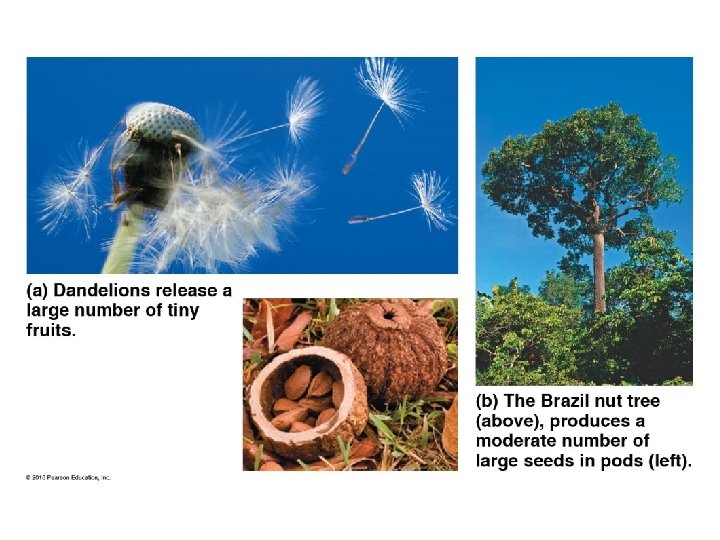
Semelparity • Big-bang reproduction • Many offspring produced at once • Individual often dies afterwards • Less stable environments Agave Plant
Semelparity • Big-bang reproduction • Many offspring produced at once • Individual often dies afterwards • Less stable environments Salmon Spawning https: //www. youtube. com/watch? v=YZPHrl 4 ICm 0
Iteroparity • Repeated reproduction • Few, but large offspring • More stable environments Lizards Perennial Plants Birds Mammals Insects
Current hypothesis suggests two critical factors contribute to the evolution of semelparity and iteroparity: • Survival rate of offspring • Likelihood adult will survive to reproduce again Semelparity Unpredictable environment/low survival rate for offspring & adults Iteroparity More stable environment/higher survival rate for offspring & adults Many life histories are intermediate between the two extremes!
• K-selection: pop. close to carrying capacity • r-selection: maximize reproductive success K-selection r-selection Live around K Exponential growth High prenatal care Little or no care Low birth numbers High birth numbers Good survival of young Poor survival of young Density-dependent Density independent ie. Humans ie. cockroaches
Factors that limit population growth: • Density-Dependent factors: population matters • i. e. Predation, disease, competition, territoriality, toxic wastes, physiological factors • Density-Independent factors: population not a factor • i. e. Natural disasters: fire, flood, weather
Density-Dependent Regulation
Population Dynamics • Population fluctuations due to biotic & abiotic factors 1975 -1980: peak in wolf numbers 1995: harsh winter weather (deep snow)
What do you notice about the population cycles of the showshoe hare and lynx?
Boom-and-bust cycles • Predator-prey interactions • Eg. lynx and snowshoe hare on 10 -year cycle
Age-Structure Diagrams
Human Population Growth • 2 configurations for a stable human population (zero population growth): A. High birth / high death B. Low birth / low death • Demographic transition: occurs when population goes from A B
Global Carrying Capacity • Current world population (2017) = 7. 7 billion https: //www. worldometers. info/world-population/ • Estimated carrying capacity = 10 -15 billion? • Ecological footprint: total land + water area needed for all the resources a person consumes in a pop. • 1. 7 hectares (ha)/person is sustainable • Typical person in U. S. = 10 ha footprint Limitations? Consequences? Solutions?