Ecology Population Ecology POPULATIONS 3 A population is


 I. High death rate in post -reproductive years")


 • Short maturation & lifespan • Many (small)")


- Slides: 26
Ecology: Population Ecology
POPULATIONS 3. A population is a group of individuals of the same species living in an area 2
DISTRIBUTION PATTERNS Populations disperse in a variety of ways that are influenced by environmental and social factors • Uniform distribution results from intense competition or antagonism between individuals. • Random distribution occurs when there is no competition, antagonism, or tendency to aggregate. • Clumping is the most common distribution because environmental conditions are seldom uniform. 3
What causes these populations of different organisms to clump together? Clumped distribution in species acts as a mechanism against predation as well as an efficient mechanism to trap or corner prey. It has been shown that larger packs of animals tend to have a greater number of successful kills. Fig. 52. 1, Campbell & Reece, 6 th ed.
POPULATION DISPERSAL • In rare cases, long-distance dispersal can lead to adaptive radiation • For example, Hawaiian silverswords are a diverse group descended from an ancestral North American tarweed 5
THE SPREAD OF THE AFRICANIZED HONEY BEE WHEN DID THEY FIRST ARRIVE IN THE AMERICAS? HOW LONG DID IT TAKE FOR THEM TO EXPAND THEIR RANGE INTO THE US? HOW CAN YOU EXPLAIN THEIR SUCCESS IN EXPANDING THEIR 6 TERRITORY?
SMALL GEOGRAPHIC RANGE 7
SPECIES WITH A LARGE GEOGRAPHIC RANGE 8
ESTIMATING POPULATION SIZE THE MARK-AND-RECAPTURE TECHNIQUE 2. 1. 3. 9
ESTIMATING POPULATION SIZE THE MARK-AND-RECAPTURE TECHNIQUE • 10
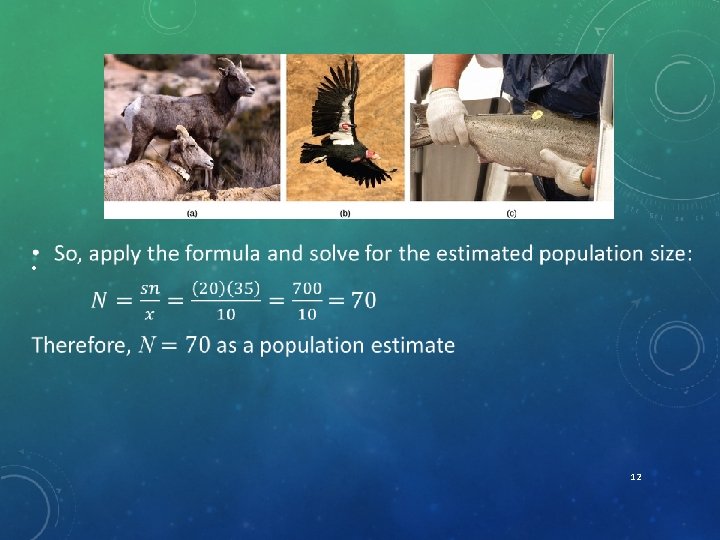
LET’S TRY AN EXAMPLE! • 11
WHICH METHOD WOULD YOU USE? 1. To determine the number of deer in the state of Virginia? 2. To determine the number of turkeys in a county? 3. To determine the number of dogs in your neighborhood? 4. To determine the number of ferrel cats in your neighborhood? 13
SURVIVORSHIP CURVES 1000 Human (type I) I. High death rate in post -reproductive years Hydra (type II) 100 Survival per thousand What do these graphs indicate regarding species survival rate & strategy? II. Constant mortality rate throughout life span Oyster (type III) 10 1 0 25 50 75 Percent of maximum life span 100 III. Very high early mortality but the few survivors then live long (stay reproductive)
POPULATION GROWTH CURVES d = delta or change N = population Size t = time B = birth rate D =death rate 15
POPULATION GROWTH MODELS •
EXPONENTIAL GROWTH CURVES d = delta or change N = Population Size t = time rmax = maximum per capita growth rate of population Population Size, N Growth Rate of E. coli Time (hours) 17
LOGISTIC GROWTH CURVES 18
LOGISTIC GROWTH CURVES d = delta or change N = Population Size t = time K =carrying capacity rmax = maximum per capita growth rate of population 19
COMPARISON OF GROWTH CURVES 20
GROWTH CURVE RELATIONSHIP 21
EXAMINING LOGISTIC POPULATION GROWTH 22
EXAMINING LOGISTIC POPULATION GROWTH Hypothetical Example of Logistic Growth Curve K = 1, 000 & rmax = 0. 05 per Individual per Year 23
POPULATION REPRODUCTIVE STRATEGIES • r-selected (opportunistic) • Short maturation & lifespan • Many (small) offspring; 1 (early) reproduction; • No parental care • High death rate • K-selected (equilibrial) usually • Long maturation & lifespan • Few (large) offspring; usually several (late) reproductions • Extensive parental care • Low death rate
How Well Do These Organisms Fit the Logistic Growth Model? Some populations overshoot K before settling down to a relatively stable density Some populations fluctuate greatly and make it difficult to define K 25
Age Structure Diagrams: Always Examine The Base Before Making Predictions About The Future Of The Population Rapid growth Afghanistan Male Female 10 8 6 4 2 0 2 4 6 Percent of population Age 85+ 80– 84 75– 79 70– 74 65– 69 60– 64 55– 59 50– 54 45– 49 40– 44 35– 39 30– 34 25– 29 20– 24 15– 19 10– 14 5– 9 0– 4 8 10 8 Slow growth United States Male Female 6 4 2 0 2 4 6 Percent of population Age 85+ 80– 84 75– 79 70– 74 65– 69 60– 64 55– 59 50– 54 45– 49 40– 44 35– 39 30– 34 25– 29 20– 24 15– 19 10– 14 5– 9 0– 4 8 8 No growth Italy Male Female 6 4 2 0 2 4 6 8 Percent of population