POPULATION ECOLOGY Study of Populations Population Individuals of


- Slides: 17
POPULATION ECOLOGY
Study of Populations Population � Individuals of a species within a given area Population Structure � Age distribution of individuals in a population � The way the individuals are spread over the environment Population Density � Number of individuals of a population per unit of area Demographic events � Changes of structure Births, deaths, immigration, emigration
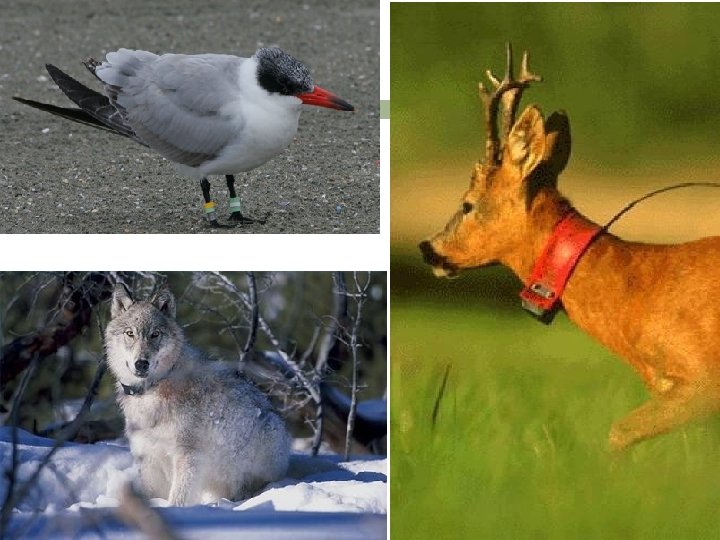
Study of Populations Tracking devices � Able to record & transmit information about location, physiology, feeding behavior, & social behavior Estimate population densities from samples � m 2/n 2 n 1 = n 1/N = number of marked individuals in the first sample (all get marked) n 2 = total number of individuals in the second sample m 2 = number of marked individuals in the second sample N= estimated size of the total population
Study of Populations Birth & death rates can be estimated � N 1 – N 0 + B – D + I – E � N 1 = number of individuals at time 1 � N 0 = number of individuals at time 0 � B = number of individuals born between 0 & time 1 � D = number that died between 0 & time 1 � I = number that immigrated between 0 & time 1 � E = number that emigrated between 0 & time 1
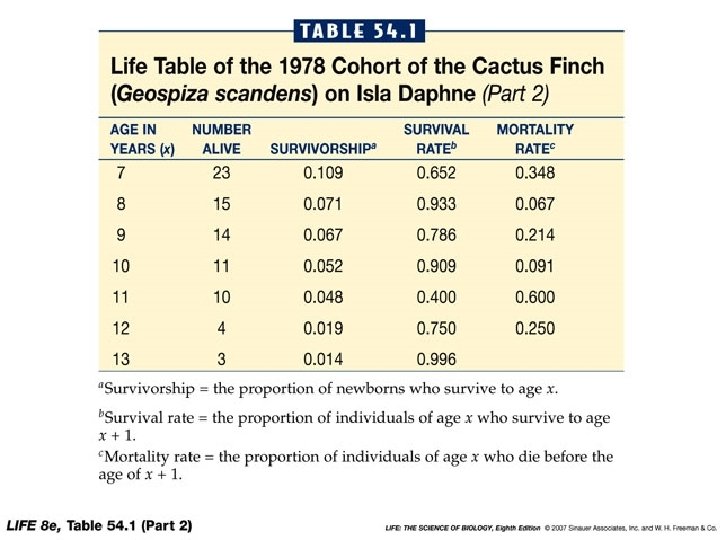
Study of Populations Life table � Displays information about birth & death rates in a population � Constructed by Cohorts tracking a group of individuals born at the same time Survivorship Number that are still alive at later dates � Used to predict future trends
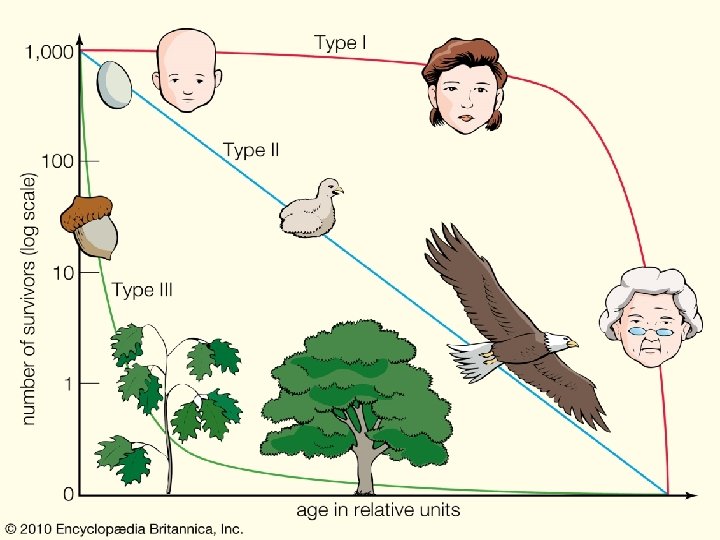
Survivorship Curves Type I curves are typical of populations in which most mortality occurs among the elderly 1. Type II curves occur when mortality is not dependent on age 2. 1. 3. ~ humans in developed countries ~many species of large birds and fish Type III curves occur when juvenile mortality is extremely high, life expectancy increases for individuals who survive their risky juvenile period.
Age distribution
Life History Describes how an organisms allocates it time & energy among growth, reproduction, & other activities. � Important in understanding how populations grow & are distributed � Vital for designing population management plans
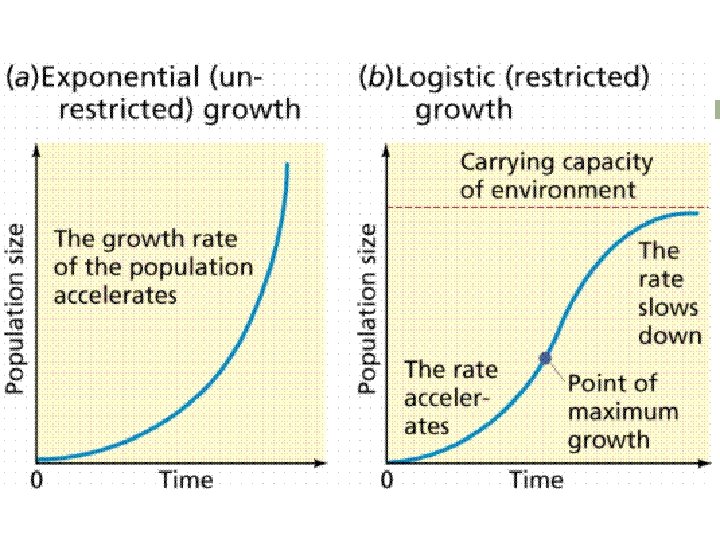
Factors that Influence Population Densities All populations have the potential for explosive growth. � As number of individuals increase, the number of new individuals accelerates. � Graph forms a continuous upward curve Known as EXPONENTIAL GROWTH
Factors that Influence Population Densities Limited by resources & biotic interactions Environmental carrying capacity (K) � Determined by the availability of resources Food, nest sites, shelter, disease, predators, etc. Growth slows down as it reaches the carrying capacity because of resource limitations � Forms a S-shaped curve � (logistic growth)
Factors that Influence Population Densities influence birth & death rates � Density-dependent (birth & death rates change together). Each additional individual makes things worse for other members. As species increases, food supply may deplete Poorer nutrition increase death rate & decrease birth rate Predator attracted to areas with high densities of prey Diseases spread more easily in dense populations Density independent factors � physical or abiotic factors like weather, forest fire, pollutant, etc.
Factors why some are more common than others Species that use abundant resources generally reach higher population densities � Animals that eat plants are more common than animals that eat other animals Species with small body sizes generally reach higher population densities � Density generally decreases as body size increases � Small bodies require less energy
Factors why some are more common than others Newly introduced species may reach high population densities � May escape factors that normally prevent them from becoming more abundant Normal predators/pathogens are absent Complex social organization may facilitate high densities � High social species achieve high population densities