Population Ecology Populations Population all individuals of 1


 Clumped: most common, a) group around resources b) social behavior c)")
 full count 2) Quadrats 3) Transects 4) Mark-recapture m-r good")


 Steady state")
 favor low pop density (d independent) b) quick production")


 of Age groups 2. Age groups for")


 – average # children born per")

- Slides: 27
Population Ecology!
Populations Population: all individuals of 1 species in area Population size : number of individuals Population density : number per area Population distribution : dispersal pattern
Distribution patterns 1) Clumped: most common, a) group around resources b) social behavior c) lack of offspring dispersal 2) Uniform (or close enough) a) territory division 3) Random – rare a) uniform resources b) ignore each other
Population Size Estimates 1) full count 2) Quadrats 3) Transects 4) Mark-recapture m-r good for organisms that move around a lot
Mark-recapture Based on assumption: % marked on day 2 same as the % of the total population that is marked Steps: day 1 capture organisms & mark them day 2 capture organisms & see what % are marked calculation day 2 marked = day 1 marked day 2 total population
Population Growth Positive growth ……. . birth & immigration Negative growth …… death & emigration Migration : periodic change w/ seasons Net reproduction = births – deaths Per capita = per individual Doubling time: time for pop to double size
Rapid Population Growth Exponential growth : population grows at a rate proportional to its size a) ideal conditions allow max growth rate Biotic potential : max growth rate for a population (under ideal conditions)
Logistic Population Growth Exponential Growth slowed by Density dependent limiting factors predation, parasites, disease limited resources, competition Not by Density independent limiting factors weather, natural disasters, humans
Carrying capacity = Max # individuals an area can support indefinitely (D) Steady state #2 on graph
Life History Strategies r-selected a) favor low pop density (d independent) b) quick production of many small babies c) high biotic potential so called r-selected K-selected a) favor high pop density (d dependent) b) good competitors c) low biotic potential & parental care
Life History Strategies
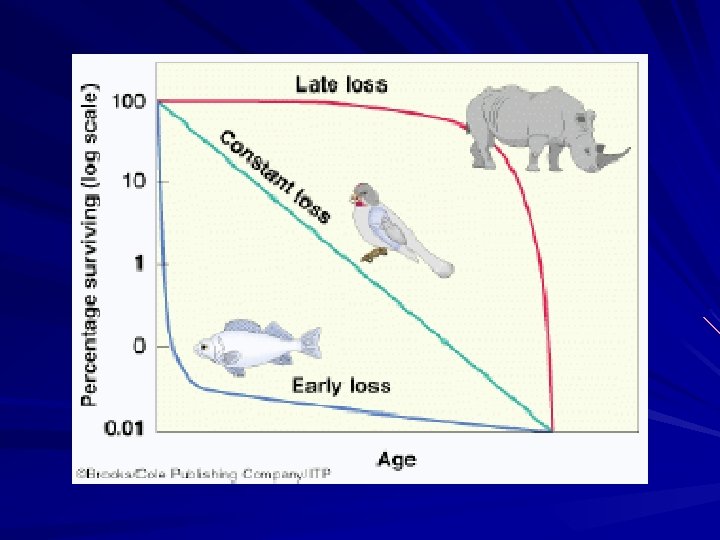
Different Life Histories = Different Survivorship Curves Type I : live long & prosper (parental care) k-selected Type II : good luck could die at any time… Type III : by-by baby high infant mortality r-selected
Human Population growth 1 to 2 billion…………. . 123 years Growth to 3 billion …………. 33 years Growth to 4, 5, 6 …………. . 14, 13, 12
Demographics 1. study of population statistics 2. Number of individuals of a. different age groups b. socioeconomic status c. education levels d. other 3. Used by ecologists to predict population growth
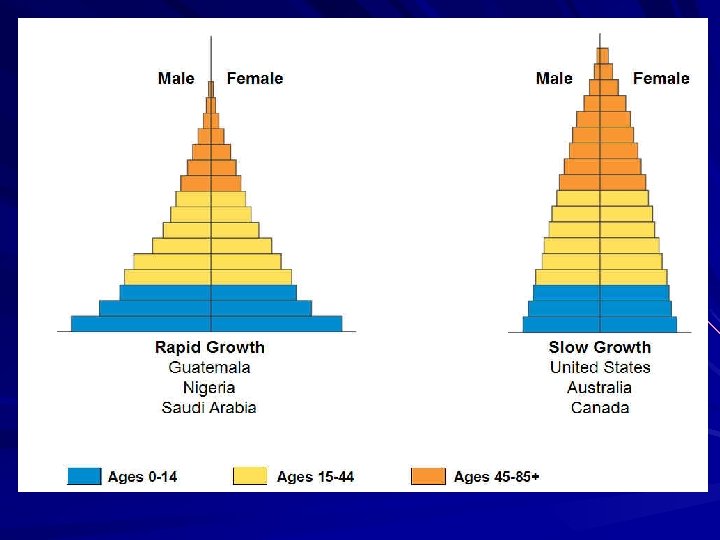
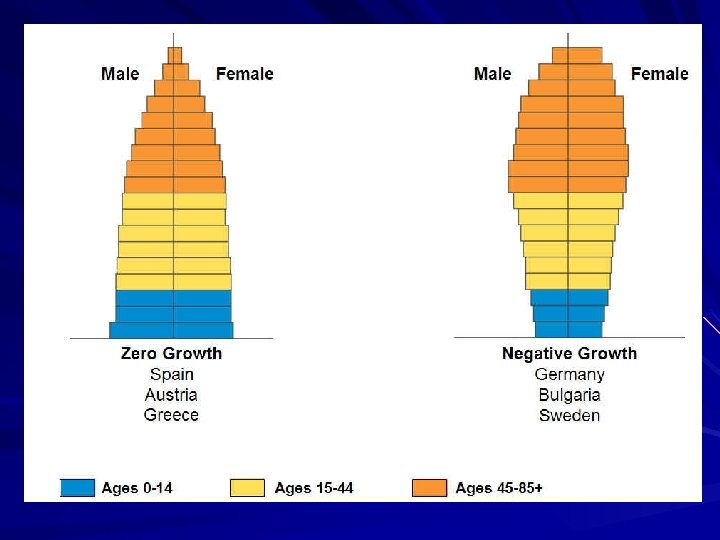
Age Structure Diagrams 1. Demographic Model (graph) of Age groups 2. Age groups for predicting population growth a. Post – reproductive: too old to reproduce b. Reproductive: currently able to reproduce c. Pre - reproductive: too young to reproduce
http: //data. worldbank. org/indicator/SP. DY N. IMRT. FE. IN? end=2016&start=1968&vie w=chart https: //www. cia. gov/library/publications/the -world-factbook/geos/ng. html
Singapore Lowest TFR : 0. 82 Education: 3 % of GDP literacy rate: 97% Education: Infant mortality rate: 2. 4 / 1, 000 Mother age at first birth : 30. 5
World Highest TFR : Education: literacy rate: 86% Education: Infant mortality rate: Mother age at first birth : Contraceptive prevalence Child labor:
U. S. A. Medium TFR : 1. 9 Education: literacy rate: 99% Education: Infant mortality rate: 5. 8 / 1, 000 Mother age at first birth : 26 Contraceptive prevalence 74%
Niger Highest TFR : 6. 6 Education: literacy rate: 19% Education: Infant mortality rate: 83 / 1, 000 Mother age at first birth : 18 Contraceptive prevalence 14% Child labor: 43%
Demographic Transition Model
Fertility Rates and $$$$$$$ Total Fertility Rate (TFR) – average # children born per woman Replacement = 2. 1 USA = 1. 87 Niger = 6. 6 Signapore: TFR Infant mortality = 2. 4/1, 000 TFR in developed countries = at or below 2. 1