Ecology BIO C 322 Population Ecology Population Group
 Population Ecology")
Ecology (BIO C 322) Population Ecology

Population • Group of organisms of same species occupying a particular space, • Functioning as part of biotic community. • Group attributes meaningful only at the population level. e. g. birth rate, death rate. • Demography = Stastical study of human populations birth, migration, aging, death.
 w.")
Indices of Density • Population density: Size of a population (number or biomass) w. r. t. a definite unit of space. e. g. 1 tree/m 2 • Crude density: No. per unit of total space. • Ecological density: No. per unit of habitat space. • Relative abundance; may be time-relative. e. g. No. of birds seen per hr. • Frequency of occurrence: % of sample plots occupied by a particular species.

Mark-recapture Method to estimate Population Density

Lincoln Index • To estimate no. of organisms, X, of a species in a given area. • X = Population estimate • N 1 = No. of animals captured & marked in sample S 1 at time t 1 • N 2 = No. of animals captured in sample S 2 at time t 2 • M 2 = No. of marked animals found in sample S 2 at time t 2. X / N 1 = N 2 / M 2

Quadrat or Transect Sampling • Counting organisms of a single species in plots of transects.
 Ability of a population to increase by reproduction;")
• • • Natality (Birth) Ability of a population to increase by reproduction; birth rate. Absolute or crude natality rate: No. of new individuals produced per unit time. Specific natality rate: No. of new individuals per unit time per unit population. Maximum natality: Theoretical maximum; under ideal conditions; no limiting factors. Ecological or realized natality: Under actual conditions (size and age composition & abiotic factors).
 • Absolute or crude death rate (deaths per unit time). • Specific")
Mortality (Death) • Absolute or crude death rate (deaths per unit time). • Specific death rate (M). • Minimum mortality: Under ideal conditions. • Ecological or realized mortality. • Survival rate = 1 - M

Life Table • Table of mortality & survivorship schedules of a population based on an initial cohort. • Study table 6. 1 (TB): Life table for an Alaskan population of Dall mountain sheep.
: Study in Virginia x (Age)")
Another example: Cohort of 530 grey squirrels (Sciurus carolinensis): Study in Virginia x (Age) nx 0 -1 1 -2 2 -3 3 -4 4 -5 5 -6 530 159 80 48 21 5 lx = nx/no dx = nxnx+1 1 371 0. 3 79 0. 15 32 0. 09 27 0. 04 16 0. 01 5 qx = dx/nx 0. 70 0. 50 0. 40 0. 55 0. 75 1

Mortality & Survivorship Curves • Graphical representation of life table data. • Mortality curve: qx (age-specific mortality rate) plotted on y-axis, age on x-axis. • Survivorship curve: nx or lx plotted on yaxis (log 10 scale), age on x-axis. • Mean life expectancy or mean duration of life: Age at which half the population is still surviving.
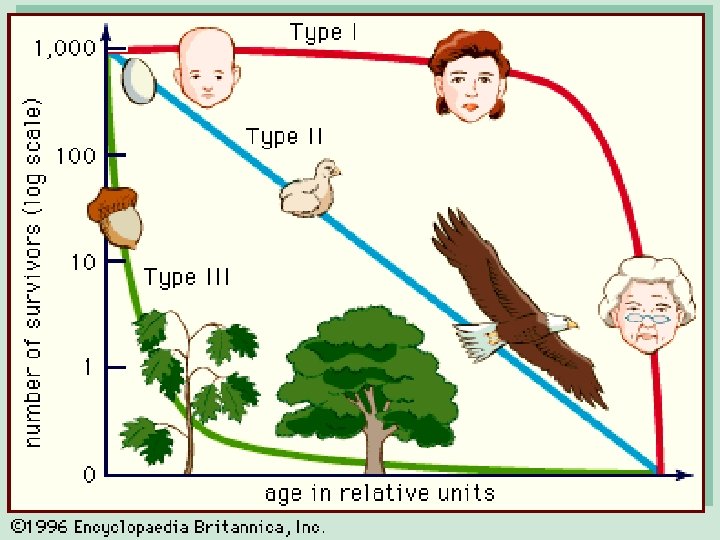

Effect of Density • Shape of survivorship curve varies with density of population. • Figure 6. 4 (TB): Curves for two mule deer populations; • Observations: Curve for denser population is more concave Shorter life expectancy. • Increased hunting pressure and intraspecific competition.

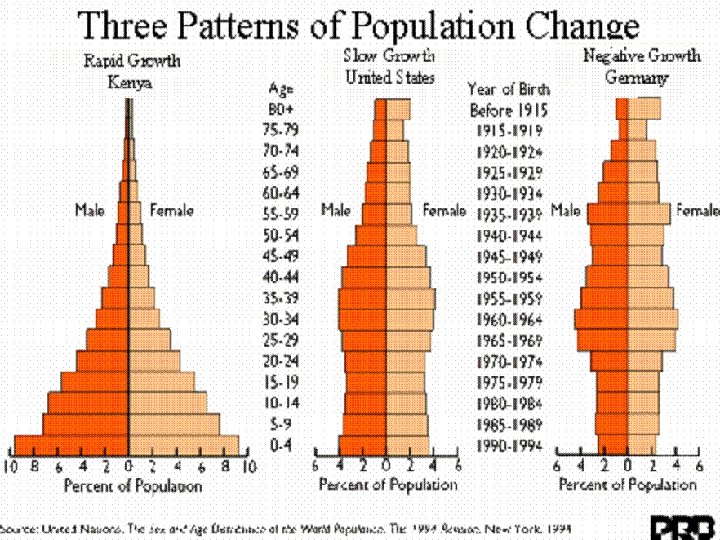
Age Structures / Pyramids • Three major age groups in a population: pre-reproductive, reproductive & postreproductive. • Age pyramid: Oldest group at top. • Age structure of different population types: – Expanding: rapidly growing population. – Stable – Diminishing
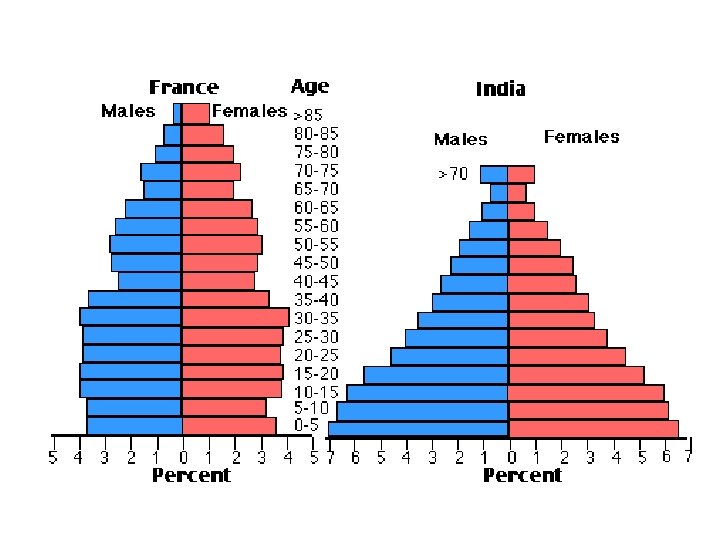

Species Differences in Age Structure • Relative distribution of the ages varies among different populations. • For humans, these ages are almost equal in length, about 1/3 of human life falling in each class. • Insects: Long pre-rep periods, very short rep period and no post-rep period. • For angiosperms (plants), the ratio of life span to pre-rep stage is 10: 1.
- Slides: 17