ATS 351 Lecture 9 Radar Radio Waves Electromagnetic


 •")


 agencies established the Weather Surveillance")


- Slides: 46
ATS 351 Lecture 9 Radar
Radio Waves
Electromagnetic Waves • Consist of an electric field and a magnetic field • Polarization: describes the orientation of the electric field.
Frequency and Wavelength • Frequency and wavelength are related by: = c/f = wavelength c = speed of light (3. 0 x 108 m/s) f = frequency, measured in Hertz (1/s) is the number of times the crest of the wave passes a given point.
RADAR Radio Detection And Ranging
Radar Frequencies Radar band L S C X Ku K Ka W Frequency Wavelength (GHz) (cm) 1 -2 2 -4 4 -8 8 -12 12 -18 18 -27 27 -40 40 -300 15 -30 8 -15 4 -8 2. 5 -4 1. 7 -2. 5 1. 2 -1. 7 0. 75 -1. 2 1 -7. 5 • Radar Frequencies • Higher frequency, smaller antenna • W and K: cloud radars • X, C, S, and L: precipitation radars
Choice of wavelength • Choice affects – Ability to detect weak targets at long range – Resolution of small features – Types of targets to study – Effects of propagating through atmosphere – Radar size, weight, and cost • Short wavelength – Smaller, less expensive – More effective in detecting small particles such as cloud droplets and drizzle drops – Also partially absorbed by these particles (attenuation) • Long wavelength – Absorption by intervening particles drastically reduced
Radar Terminology • Period: time it takes for the wave to propagate from one crest to the next (about 1 millisecond, from the beginning of one pulse to the next) • Pulse duration: about 1 microsecond (from beginning of pulse to end of same pulse) • Pulse Repetition Frequency (PRF): rate at which radar transmits (cycles per second)
Radar Hardware • Transmitter – generates high frequency signal – Source of EM radiation • Wave Guide – Carries the waves generated by the transmitter to the antenna • Antenna – Transmits signal – Reflector sends signal away from system • Receiver – Detects and amplifies backscattered energy
Backscatter • amount of energy that is scattered and travels back to the receiver • Very small amount • Depends on: – Size (relative to wavelength) – Shape – State – Temperature – Dielectric property
Radar Equation • Received Power = constants x radar x target • Radar: power transmitted, antenna gain, wavelength, bandwidth, pulse duration • Target: number, diameter, volume, range, dielectric property
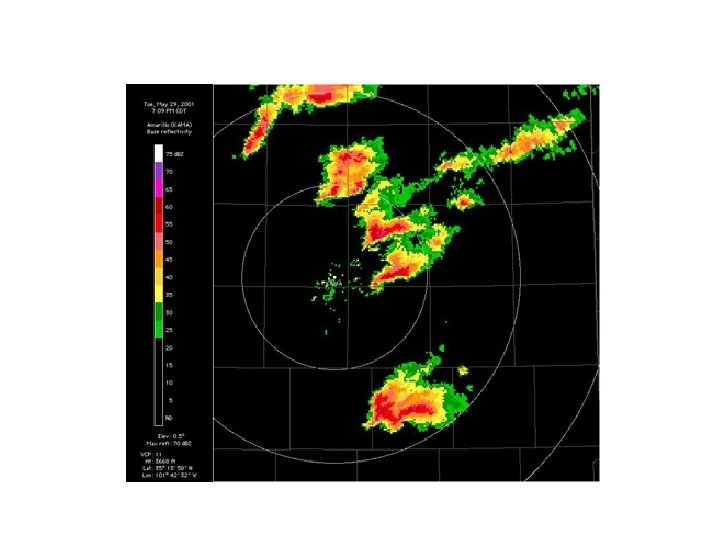
Reflectivity • Transmitted power: 105 – 106 W • Received power: 10 -13 – 10 -14 W • Comparison: decibels d. B = 10 log 10(P 2/P 1) • Reflectivity: (N*D 6) • Reflectivity factor: d. BZ = 10 log 10(Z)/volume • d. BZ ranges from – 20 to 70
Z-R relationship • Calculate rain rates from reflectivity • Z = a. Rb • The a and b depend on size of drops and type of system • Sources of error – – Attenuation Large drops Beam Blockage Air motions
Azimuth and Elevation Angles • The angle of the radar beam with respect to north • Angle of the beam with respect to the ground
PPI • Plan Position Indicator • Range, azimuth display • Constant elevation angle • Rotates 360°: surveillance scan • Less than 360°: sector scan
RHI • Range Height Indicator • Range, elevation display • Constant azimuth • Vertical structure • Typically rotated from near horizon to near zenith
Scanning Mode • How fast the radar makes sweeps • Clear air mode – – Much slower Scattering by differences in refractivity Scattering from insects and birds Lower reflectivity scale • Precipitation Mode – Much faster – Detects smaller particles
Clear Air Mode
Radar scan geometry • As beam moves away from radar, moves higher above surface of Earth • Radar returns from targets near radar represent low -level wind field, while returns from distant targets represent wind field at higher levels • So distance away from radar in center of display represents changes in horizontal and vertical distance
Attenuation • Due to scattering and absorption that weakens the power • By gases – Very small, neglected • By clouds – Significant for x-band – Small over long distances • By hydrometeors – Affects radars with wavelengths less than 10 cm • shorter the wavelength, more attenuation
Side lobes and ground clutter • Interception by targets on the ground such as building, trees, etc. (also bugs!) • Large and typically produce high reflectivity • Worst closest to radar
Range Folding • Maximum ambiguous range – Range to which a transmitted pulse can travel and return before the next pulse is transmitted – Rmax=c/2 PRF • Folding results from detection beyond Rmax – Distance so far that multiple pulses sent before returned signal adding to confusion – Called second trip echoes – Echo appears at incorrect range and elongated with weaker reflectivity
Snow on Radar
Bright band • Area of high reflectivity • Generated as snow falls through melting layer • Below melting layer, snow acquires a coat of water, so looks like a big rain drop
Bow Echo
V-Notch
Supercells and Hook Echoes
Doppler Effect • a change in the frequency with which waves (as of sound or light) from a given source reach an observer when the source and the observer are in motion with respect to each other so that the frequency increases or decreases according to the speed at which the distance is decreasing or increasing
Doppler • Determines direction of movement based on shift in frequency (Doppler shift) • The closer the higher the wave frequency (higher pitch) • F = 2 V/wavelength where V is the velocity of the target (dr/dt) • Inbound: negative and cool colors • Outbound: positive and warm colors • Zero Isodop: zero velocity (perpendicular to the beam)
Doppler Dilemma • Maximum unambiguous velocity – Maximum mean radial velocity radar can measure – Vmax = PRF*wavelength/4 (Nyquist velocity) • Recall Rmax=c/2 PRF • As PRF increases, Rmax decreases and Vmax increases – Can not maximize both Rmax and Vmax
Doppler examples
Veering and Backing winds
Rotation
Tornado Vortex Signature
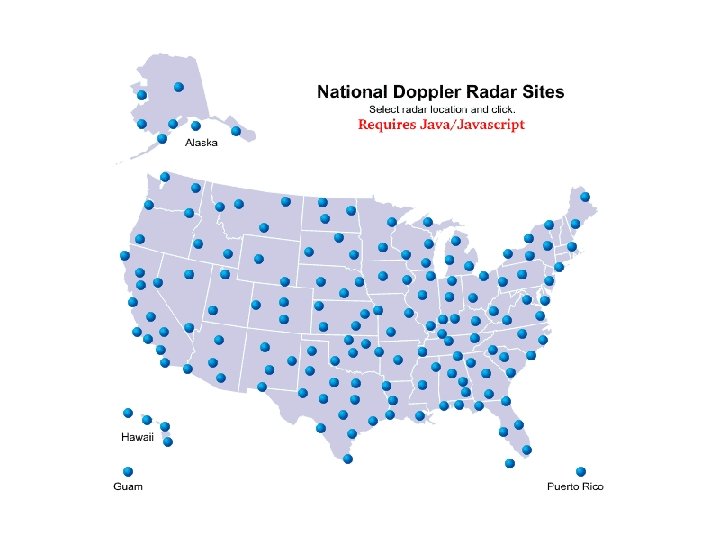
WSR-88 D • In 1988, NEXRAD (Next Generation Radar) agencies established the Weather Surveillance Radar 88 Doppler • Improvement from previous radars to include Doppler capabilities • S-band radar ( = 10 cm)
CSU-CHILL
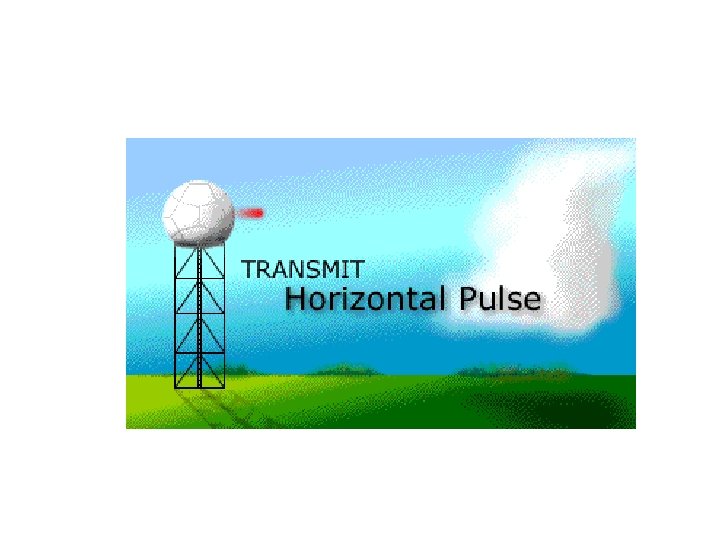
Polarimetric Radar • Alternating or simultaneous transmission of both horizontally and vertically polarized waves
Polarimetric Variables • Comparing power returned in the horizontal and vertical provides additional information on the size, shape, and ice density of cloud and precipitation particles • Ex. Differential Reflectivity (ZDR) – Ratio of horizontal to vertical power return – Good indicator of size shape (0 d. B for tumbling hail, 2 -3 d. B for rain)
Applications of polarimetric radar • • Improved estimation of rain and snow rates Discrimination of hail from rain Gauging hail size Precipitation type in winter storms Electrically active storms Aircraft icing conditions Identification of birds, insects, etc. Elimination of “bad” echo
CSU-CHILL example
Doppler on Wheels • 3 cm X-band mobile Doppler radars • Mounted on back of truck
Cloudsat • Cloud Profiling Radar • 94 GHZ • Measures the power backscattered by clouds as a function of distance from the radar