ATS 351 Lecture 8 Satellites Electromagnetic Waves Electromagnetic


 (1 -α) ơ T A 4 atmosphere ơ T S")


")


 • AIRS (Atmospheric")


 • TRMM (Tropical Rainfall")

")
- Slides: 38
ATS 351 Lecture 8 Satellites
Electromagnetic Waves
Electromagnetic Waves • Consist of an electric field and a magnetic field • Polarization: describes the orientation of the electric field.
Remote Sensing • Passive vs Active sensors – Active sensors emit radiation and measure what is sent back to them • Radars are active sensors. – Passive sensors detect naturally occurring radiation • Most satellites are passive sensors.
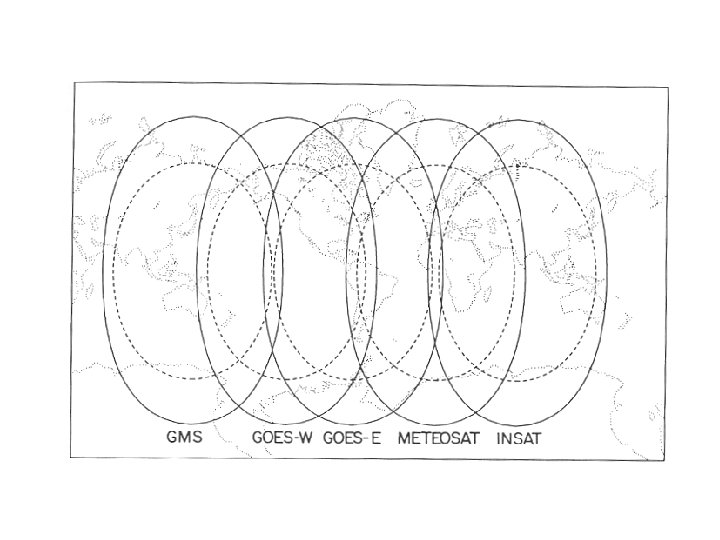
Satellite Basics • Satellites are in many different types of orbits. – – – – Geosynchronous (36, 000 km) LEO (300 -1000 km) MEO (10, 000 km) Polar (LEO orbit) Sunsynchronous Molinya Constellations • Ascending vs Descending Nodes
Satellite Basics How many times a day a particular point is seen by a sunsynchronous satellite
Satellite Basics Satellite Formations fly multiple satellites in the same orbit. Satellite constellations fly multiple satellites in varying orbits to provide maximum earth coverage.
Satellite Basics • Most satellites carry multiple sensors – Saves money • Instrument design • Instrument launch • Multiple funders – Allows many earth/atmosphere parameters to be observed at one time
Satellite Basics • Current weather satellites include radiometers, radars, and sounders – Radiometers sense emitted radiation – Radars sense reflectivity in the vertical rather than horizontal – Sounders sense profiles of radiance from many layers of the atmosphere. • Radiometers sense emitted radiation in the infrared and microwave • Brightness temperature (Tb) – The temperature of an equivalent blackbody emitting radiation. – Infrared and microwave sensors measure the emitted radiation and report it as a brightness temperature – Insert LOTS of complicated math here. – Tb = Ts
Emissivity • Emissivity – amount of absorbed radiation that is emitted by a body – – Has values between 0 and 1 Ocean has an emissivity of about 0. 5 Land cloud cover have an emissivity > 0. 8 Over land, emissivity is dependent on soil moisture and vegetation cover, and is very difficult to determine. – Over ocean, emissivity is dependent on wind speed and sea surface temperature
Retrievals • A retrieval is a method by which we infer information about the atmosphere based on measured brightness temperatures • Retrievals can be used to infer – – Cloud liquid water Water vapor content Concentrations of atmospheric gases (CO, CH 4, CO 2) Land surface properties (Soil Moisture, vegetation) • If y is the observed brightness temperature, x is the state of the Earth/Atmosphere system, and f is a forward model that predicts y based on x: y = f(x) x = f-1(y)
What is x? (So/4) (1 -α) ơ T A 4 atmosphere ơ T S 4 ơ T A 4 surface
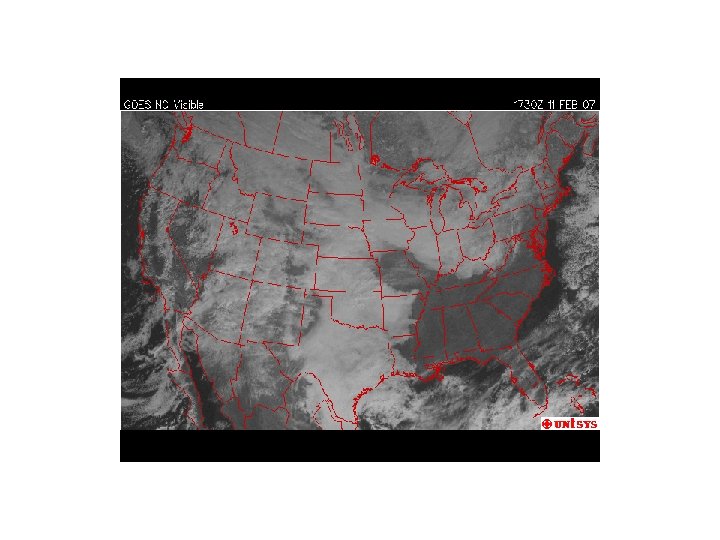
Visible Satellite Imagery • Visible satellites basically take pictures of the earth. • Most visible satellites are in geosynchronous orbit. • In the US, we use the GOES satellites. – GOES: Geostationary Operational Environmental Satellites – GOES satellites carry 5 sensors • • • Visible (. 6 microns) Shortwave IR (3. 9 microns) Water Vapor (6. 7 microns) Infrared (11 microns) Infrared (12 microns)
GOES West GOES East
• http: //rammb. cira. colostate. edu/ramsdis/onlin e/goes-west_goes-east. asp
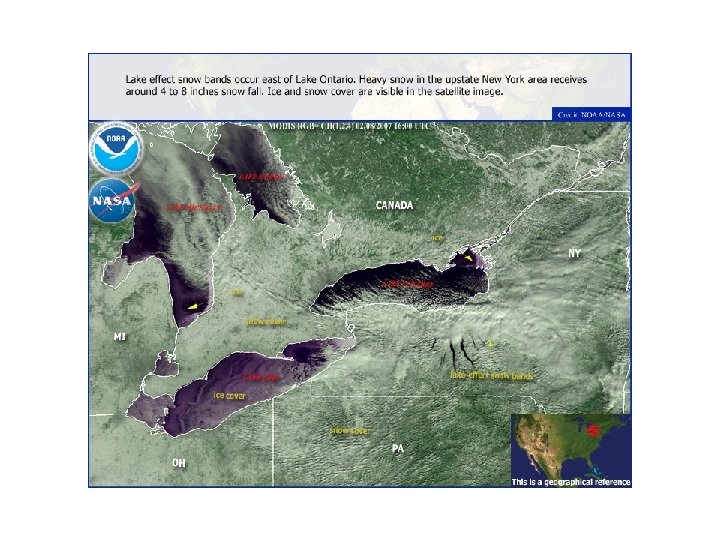
Visible Satellite Imagery • Advantages – Always located in the same place (homogeneous sampling) – View at an angle to give some information about vertical development of clouds – Can be used to monitor snow cover – High spatial resolution (GOES Vis: 1 km) • Disadvantages – Cannot be used at night – Views of the poles are limited due to the viewing angle – Not very useful for retrievals
Infrared Satellite Imagery • Displays the brightness temperature calculated based on the amount of sensed infrared radiation. • Useful for determining whether clouds are convective or stratiform. • Land surfaces appear warmer than cloud. • Land surface emissivity is very close to 1 in the infrared.
• http: //rammb. cira. colostate. edu/ramsdis/onlin e/goes-west_goes-east. asp
Infrared Satellite Imagery • Advantages – Can infer cloud heights by temperature – Can be used at night – Can be combined with visible imagery to infer cloud types – Can be color enhanced – Can be used in retrievals
• http: //rammb. cira. colostate. edu/ramsdis/onlin e/goes-west_goes-east. asp
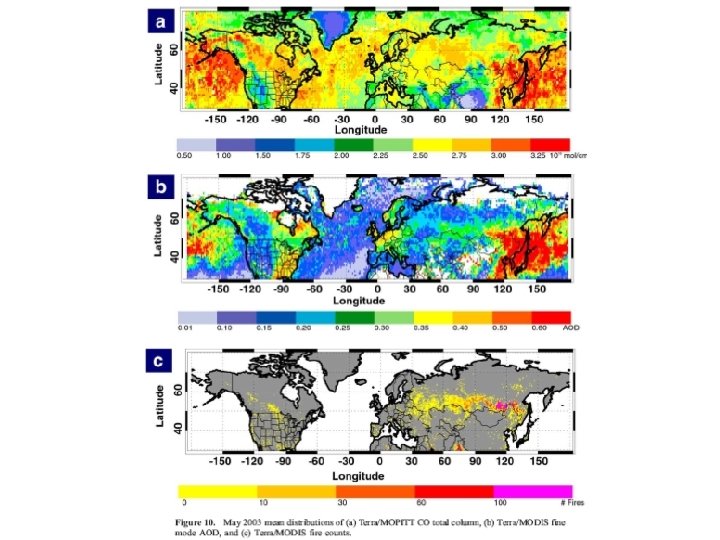
Some satellites using IR frequencies • MODIS (MODerate resolution Infrared Spectroradiometer) • AIRS (Atmospheric Infrared Sounder) • GOES (Geostationary Operational Environmental Satellite) • AVHRR (Advanced Very High Resolution Radiometer) • MOPITT (Measurements Of Pollution in The Troposphere)
Southwest Asian Dust Storm image from MODIS at 500 m resolution
AIRS Retrieved Temperature Isotherms over Southern Europe viewed from the west, September 8, 2002
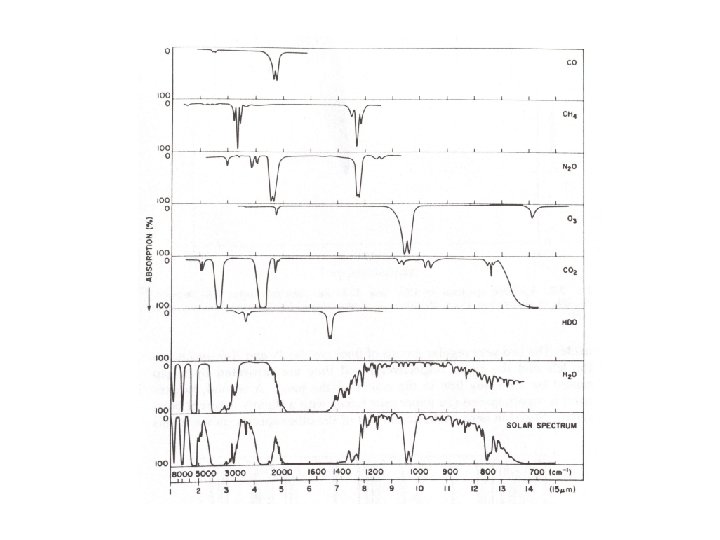
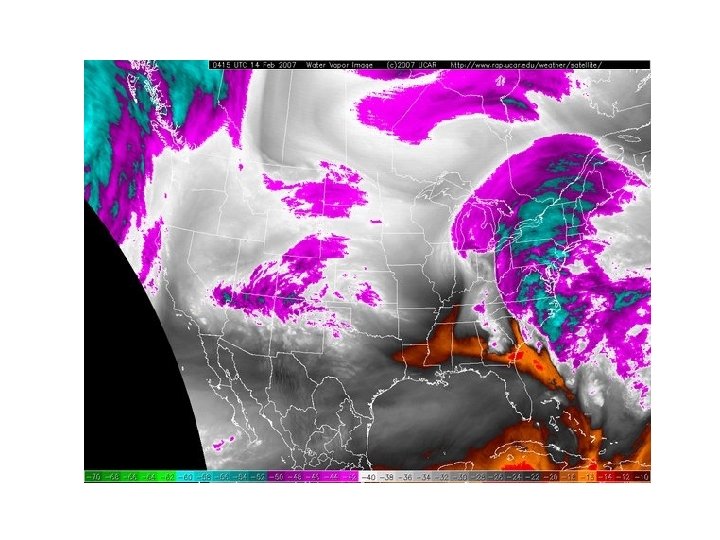
Water Vapor Imagery • Retrieved water vapor based on sensed emissivity • Shows where significant weather systems are located • Uses infrared wavelengths – Remember: water vapor is a strong absorber of IR radiation.
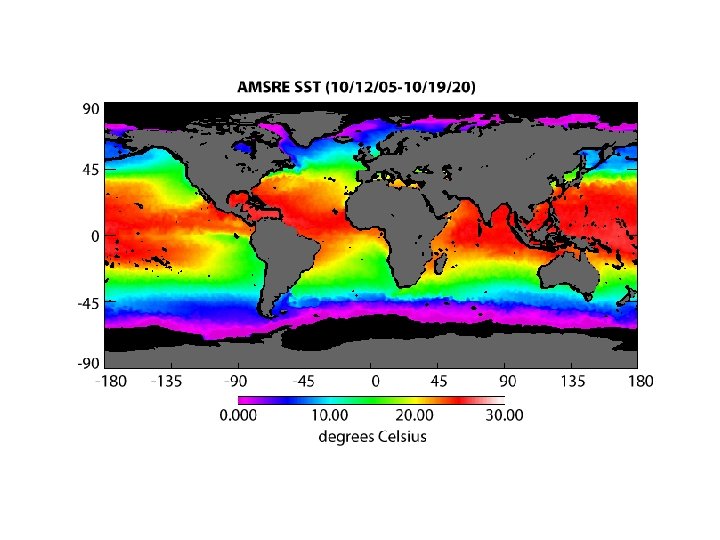
Microwave Satellite Imagery • Senses emitted radiation in the microwave frequencies • Also frequently used in retrievals. • Land surface emissivity in the microwave averages 0. 95. • Most microwave sensors carry radiometers in multiple frequencies – Allows for varying resolutions – Useful in retrievals • Atmospheric water vapor absorbs at ~22 GHz
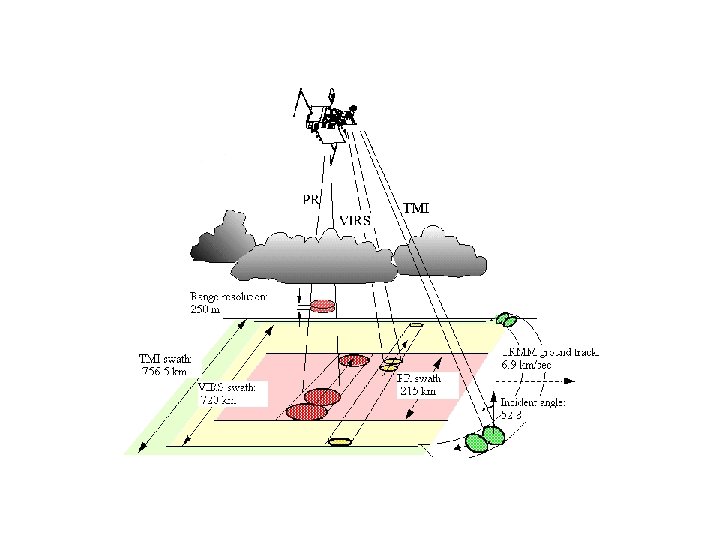
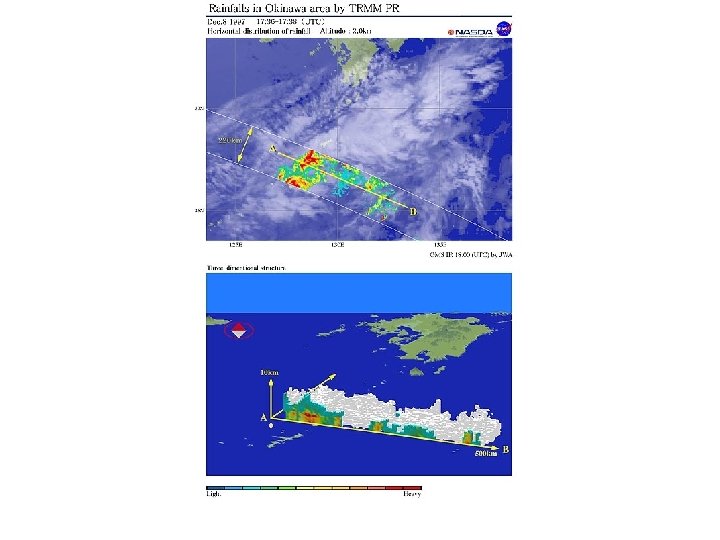
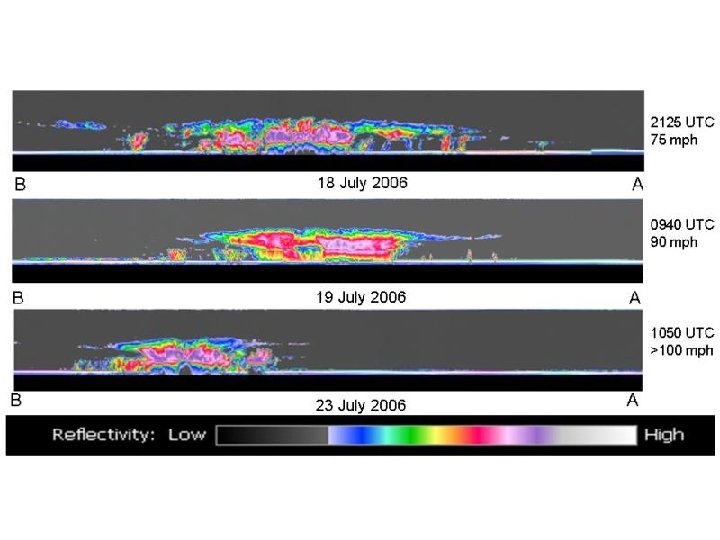
Microwave Sensors • AMSR-E (Advanced Microwave Scanning Radiometer for EOS) • TRMM (Tropical Rainfall Measuring Mission) – TMI (TRMM Microwave Imager) – TRMM-PR (Precipitation Radar) – VIRS (Visible and Infrared Satellite) • SSM/I – Special Sensor Microwave Imager • AMSU – Advanced Microwave Sounding Unit
Cloudsat • Cloud Profiling Radar • 94 GHZ • Measures the power backscattered by clouds as a function of distance from the radar
Where to find images • http: //virga. sfsu. edu/crws/archive/satimgs_month_ arch. html (archived GOES imagery) • http: //trmm. gsfc. nasa. gov/ (extreme events link at bottom of page) • http: //modis. gsfc. nasa. gov/gallery/ (MODIS image gallery) • http: //daac. gsfc. nasa. gov/AIRS/gallery. shtml (AIRS image gallery) • http: //www. eorc. jaxa. jp/en/imgdata/latest/index. ht ml (images from multiple sensors/events)