Atlas Copco Group Q 1 Results April 27
- Slides: 31
Atlas Copco Group Q 1 Results April 27, 2006 1 2020 -11 -10
Contents § Q 1 Business Highlights § Market Development § Business Areas § Financials § Outlook 2 2020 -11 -10
Q 1 - Highlights § Very strong start of 2006 § Strong growth in all Business Areas and regions – Good demand combined with improved market position § Record profit and margins for a first quarter § The divestment process of the equipment rental business is progressing according to plan 3 2020 -11 -10
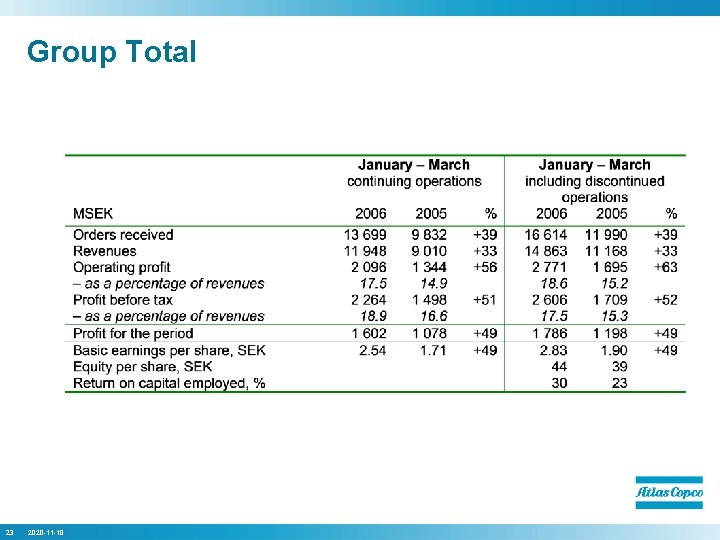
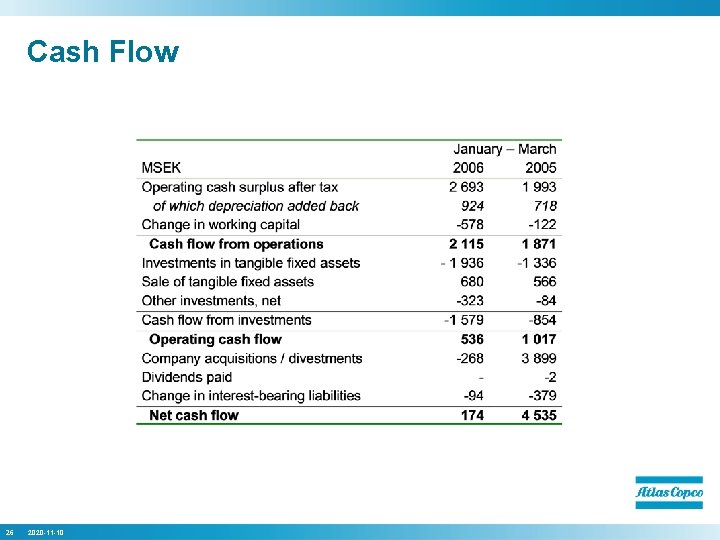
Q 1 - Figures in summary Including discontinued operations § Orders received up 39%, +22% in volume § Revenues up 33% to MSEK 14 863, up 17% in volume § Operating profit up 63% to MSEK 2 771, a margin of 18. 6% (15. 2) § Profit before tax at MSEK 2 606 (1 709), a margin of 17. 5% (15. 3) § Basic earnings per share were SEK 2. 83 (1. 90), up 49% § Operating cash flow totaled MSEK 536 (1 017) § ROCE at 30% 4 2020 -11 -10
Contents § Q 1 Business Highlights § Market Development § Business Areas § Financials § Outlook 5 2020 -11 -10
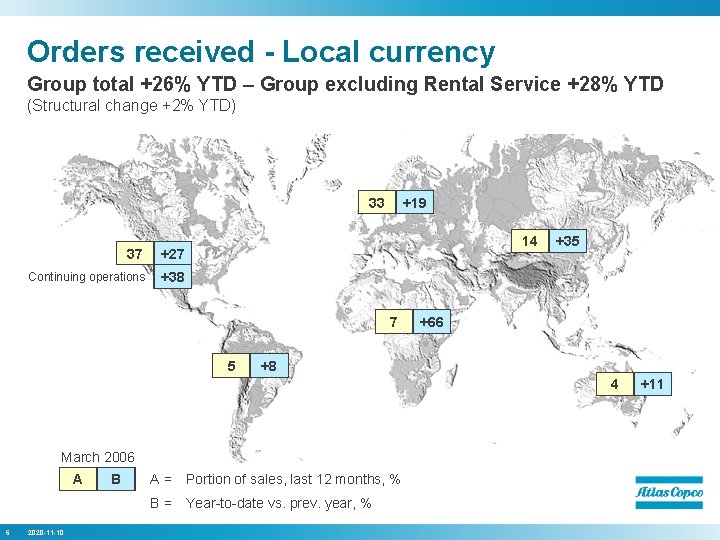
Orders received - Local currency Group total +26% YTD – Group excluding Rental Service +28% YTD (Structural change +2% YTD) 33 37 +27 Continuing operations +38 +19 14 7 5 +35 +66 +8 4 March 2006 A 6 2020 -11 -10 B A= Portion of sales, last 12 months, % B= Year-to-date vs. prev. year, % +11
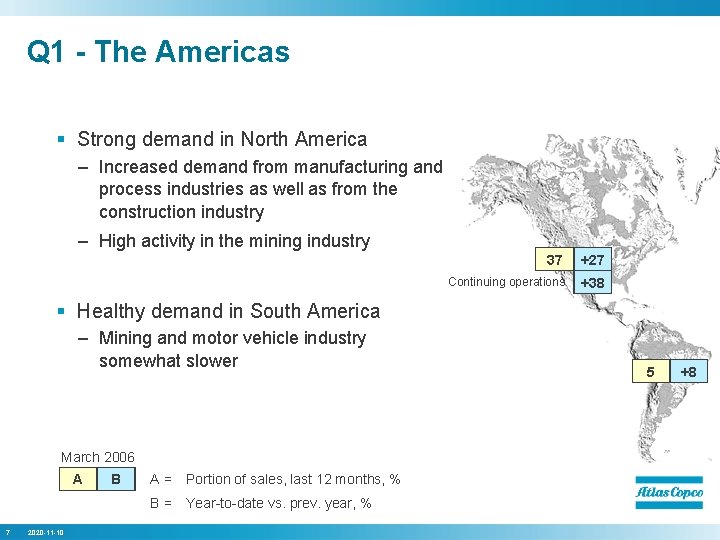
Q 1 - The Americas § Strong demand in North America – Increased demand from manufacturing and process industries as well as from the construction industry – High activity in the mining industry 37 +27 Continuing operations +38 § Healthy demand in South America – Mining and motor vehicle industry somewhat slower March 2006 A 7 2020 -11 -10 B A= Portion of sales, last 12 months, % B= Year-to-date vs. prev. year, % 5 +8
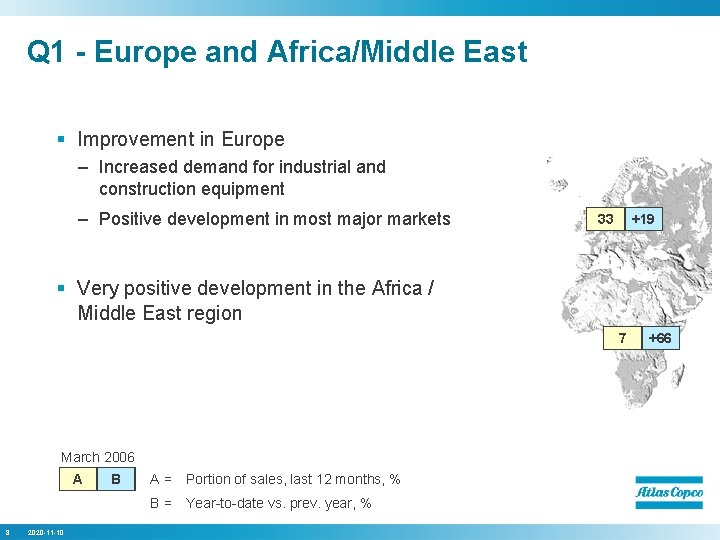
Q 1 - Europe and Africa/Middle East § Improvement in Europe – Increased demand for industrial and construction equipment – Positive development in most major markets 33 +19 § Very positive development in the Africa / Middle East region 7 March 2006 A 8 2020 -11 -10 B A= Portion of sales, last 12 months, % B= Year-to-date vs. prev. year, % +66
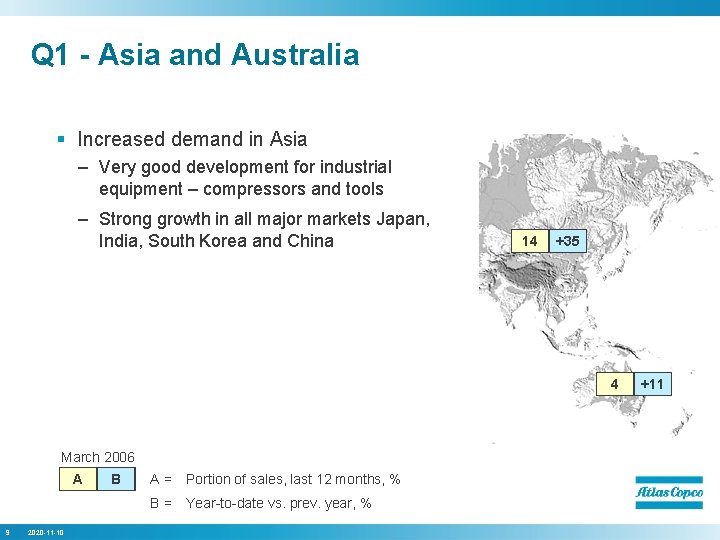
Q 1 - Asia and Australia § Increased demand in Asia – Very good development for industrial equipment – compressors and tools – Strong growth in all major markets Japan, India, South Korea and China 14 +35 4 March 2006 A 9 2020 -11 -10 B A= Portion of sales, last 12 months, % B= Year-to-date vs. prev. year, % +11
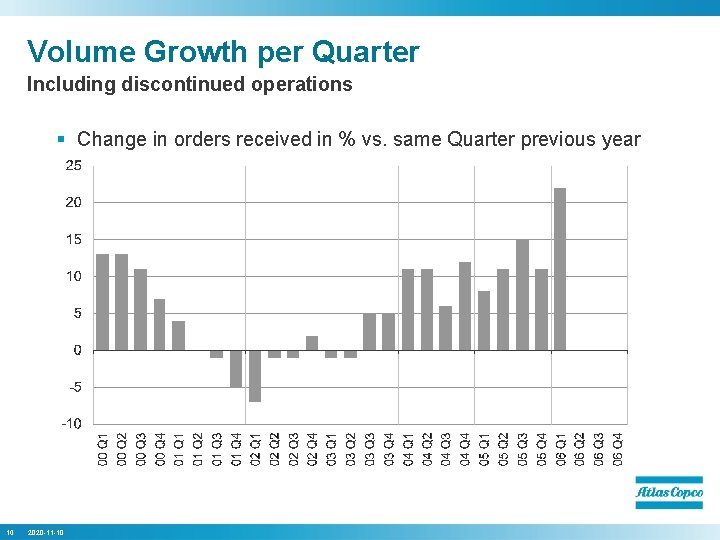
Volume Growth per Quarter Including discontinued operations § Change in orders received in % vs. same Quarter previous year 10 2020 -11 -10
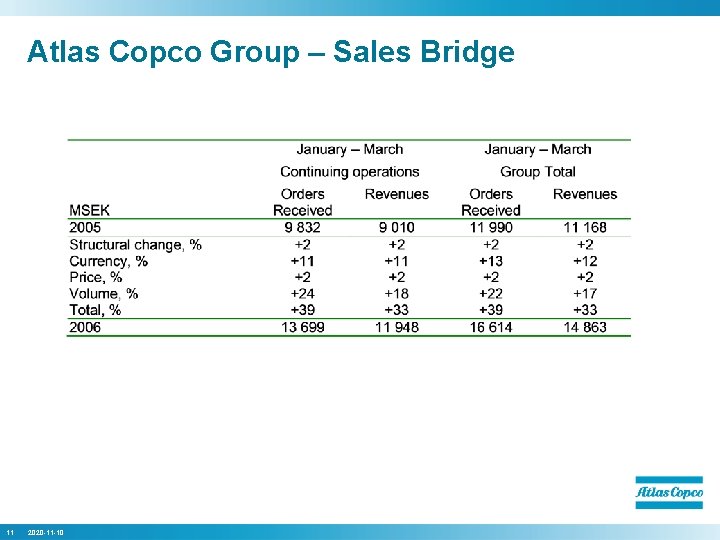
Atlas Copco Group – Sales Bridge 11 2020 -11 -10
Contents § Q 1 Business Highlights § Market Development § Business Areas § Financials § Outlook 12 2020 -11 -10
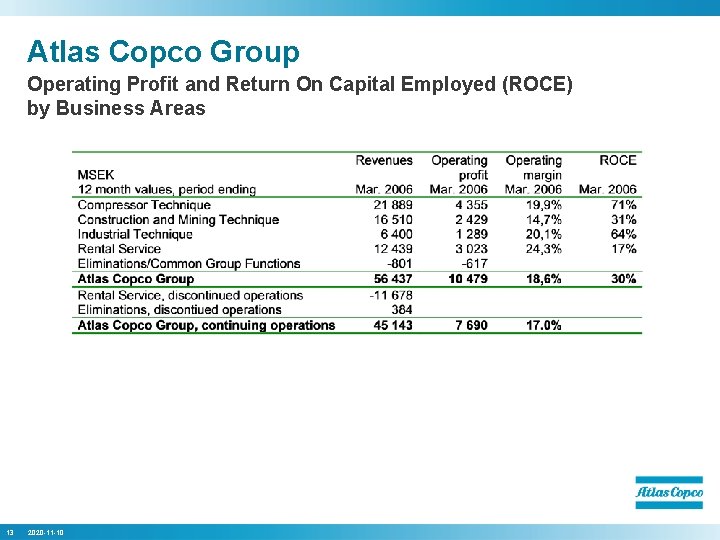
Atlas Copco Group Operating Profit and Return On Capital Employed (ROCE) by Business Areas 13 2020 -11 -10
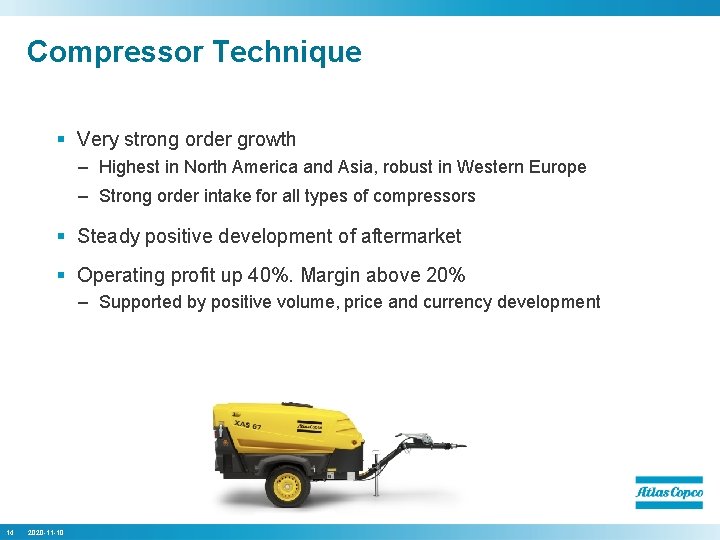
Compressor Technique § Very strong order growth – Highest in North America and Asia, robust in Western Europe – Strong order intake for all types of compressors § Steady positive development of aftermarket § Operating profit up 40%. Margin above 20% – Supported by positive volume, price and currency development 14 2020 -11 -10
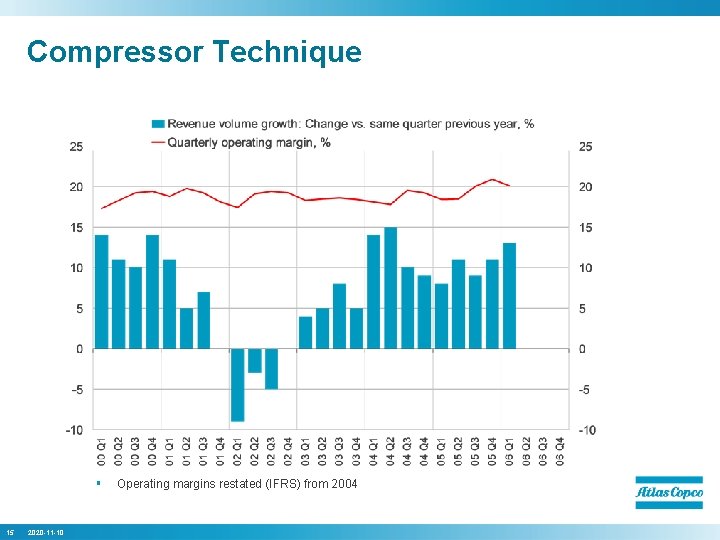
Compressor Technique § 15 2020 -11 -10 Operating margins restated (IFRS) from 2004
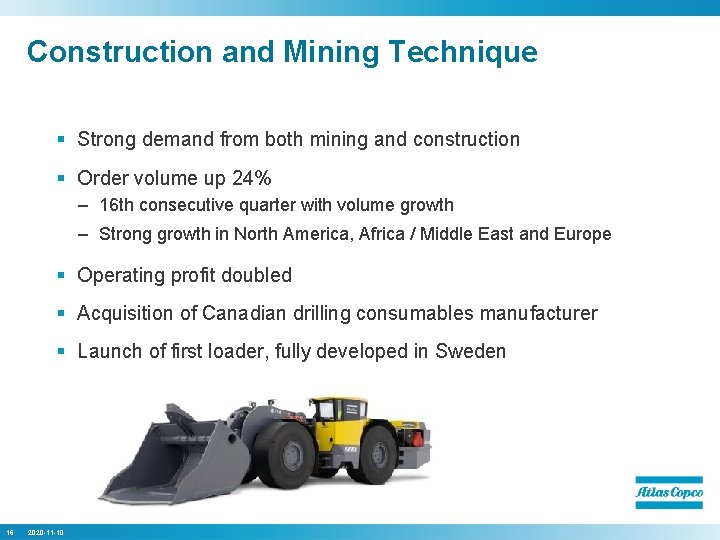
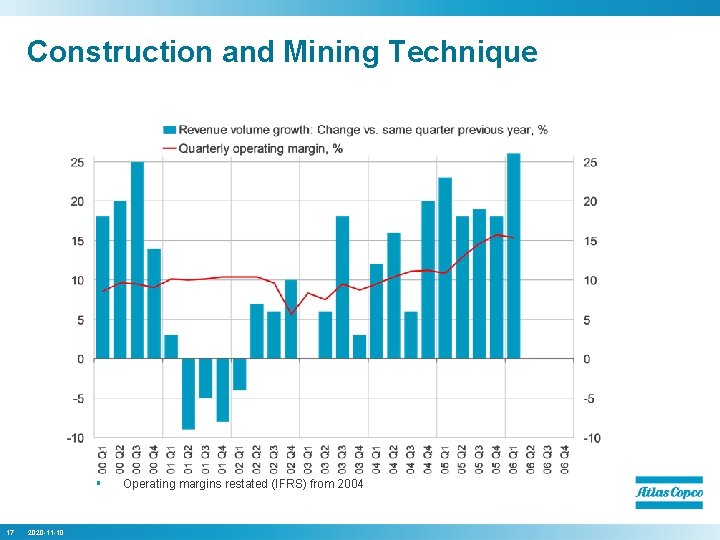
Construction and Mining Technique § Strong demand from both mining and construction § Order volume up 24% – 16 th consecutive quarter with volume growth – Strong growth in North America, Africa / Middle East and Europe § Operating profit doubled § Acquisition of Canadian drilling consumables manufacturer § Launch of first loader, fully developed in Sweden 16 2020 -11 -10
Construction and Mining Technique § 17 2020 -11 -10 Operating margins restated (IFRS) from 2004
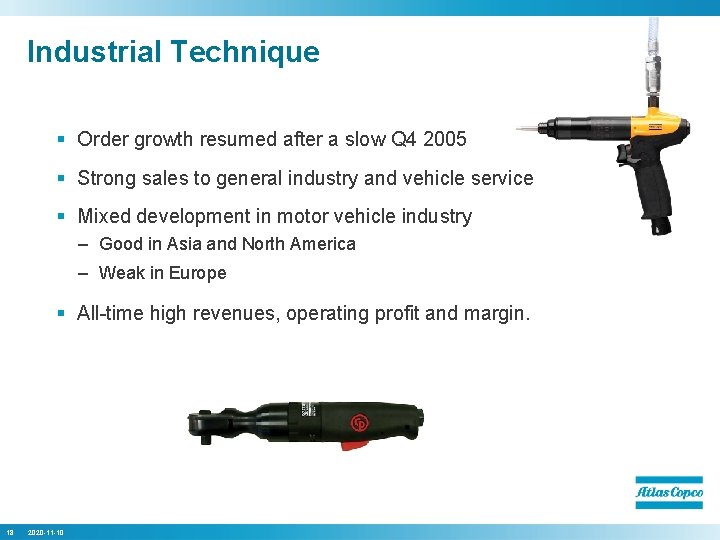
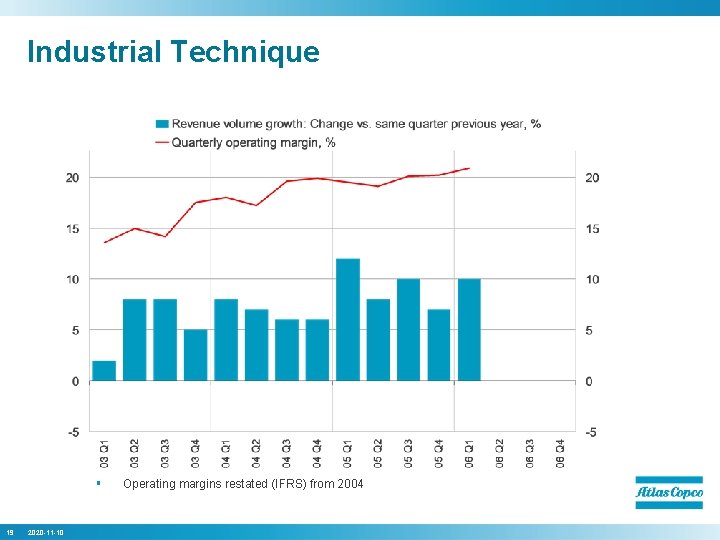
Industrial Technique § Order growth resumed after a slow Q 4 2005 § Strong sales to general industry and vehicle service § Mixed development in motor vehicle industry – Good in Asia and North America – Weak in Europe § All-time high revenues, operating profit and margin. 18 2020 -11 -10
Industrial Technique § 19 2020 -11 -10 Operating margins restated (IFRS) from 2004
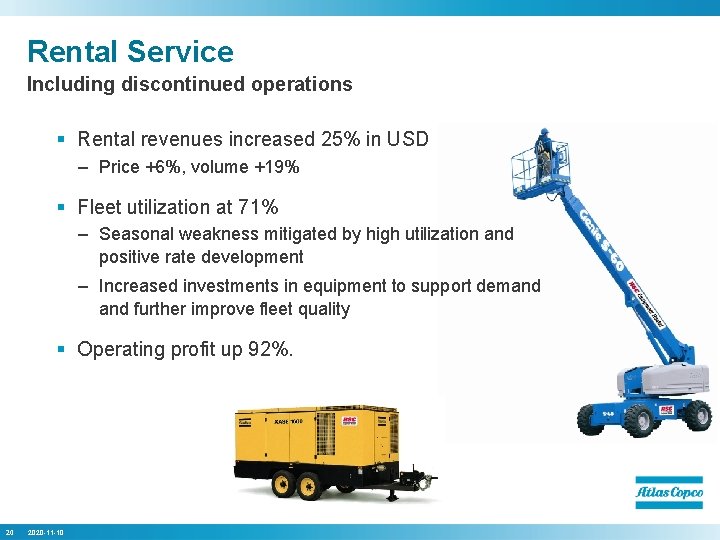
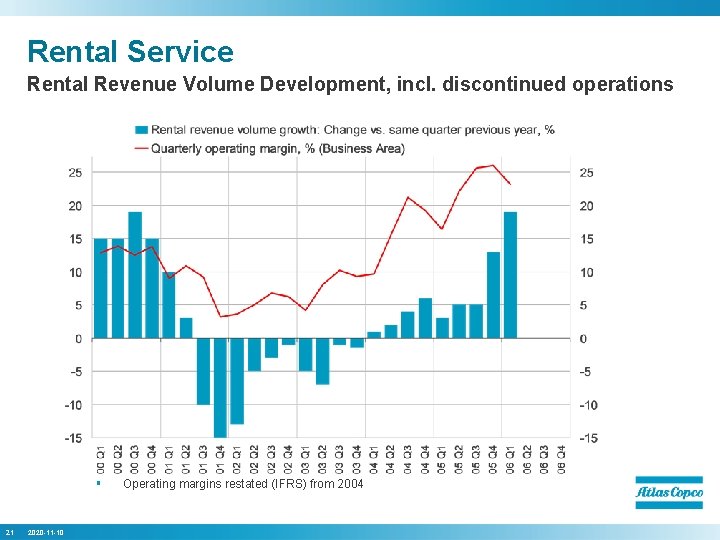
Rental Service Including discontinued operations § Rental revenues increased 25% in USD – Price +6%, volume +19% § Fleet utilization at 71% – Seasonal weakness mitigated by high utilization and positive rate development – Increased investments in equipment to support demand further improve fleet quality § Operating profit up 92%. 20 2020 -11 -10
Rental Service Rental Revenue Volume Development, incl. discontinued operations § 21 2020 -11 -10 Operating margins restated (IFRS) from 2004
Contents § Q 1 Business Highlights § Market Development § Business Areas § Financials § Outlook 22 2020 -11 -10
Group Total 23 2020 -11 -10
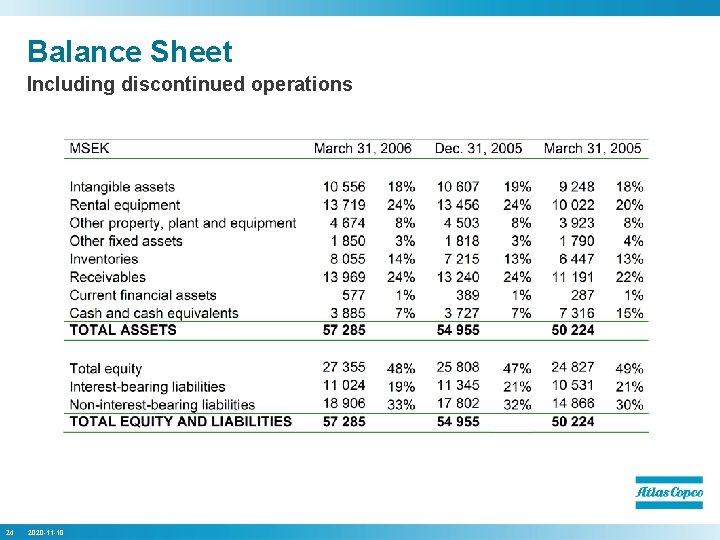
Balance Sheet Including discontinued operations 24 2020 -11 -10
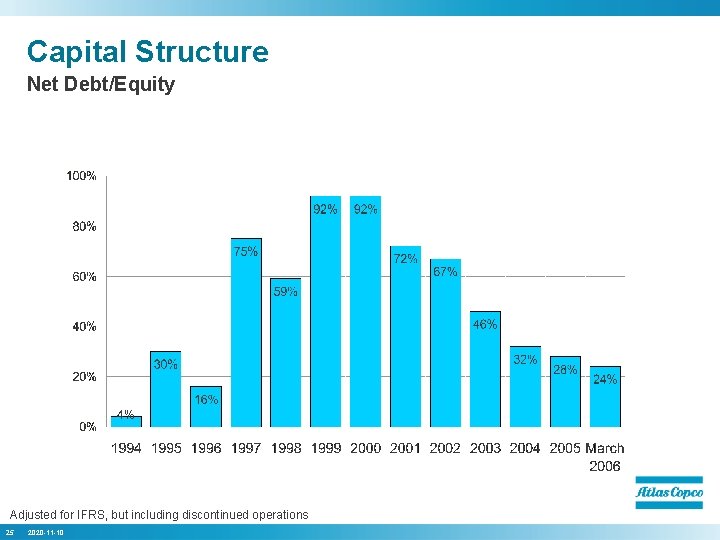
Capital Structure Net Debt/Equity Adjusted for IFRS, but including discontinued operations 25 2020 -11 -10
Cash Flow 26 2020 -11 -10
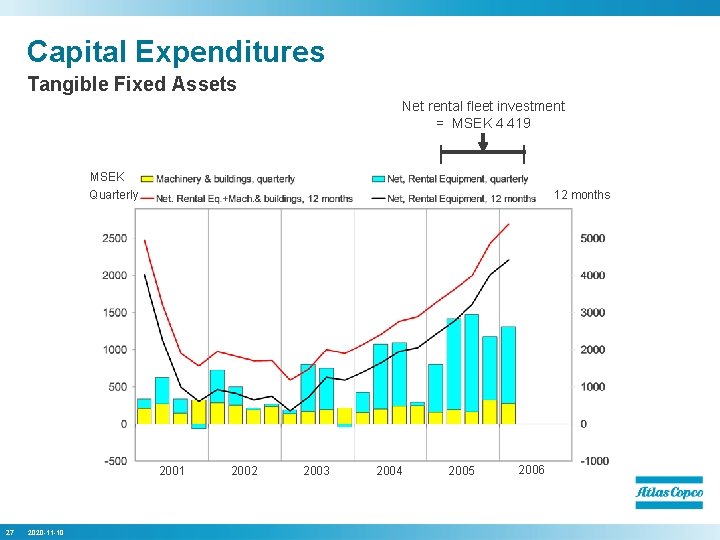
Capital Expenditures Tangible Fixed Assets Net rental fleet investment = MSEK 4 419 MSEK 12 months Quarterly 2001 27 2020 -11 -10 2002 2003 2004 2005 2006
Contents § Q 1 Business Highlights § Market Development § Business Areas § Financials § Outlook 28 2020 -11 -10
Near-term Outlook The demand for Atlas Copco’s products and services, from all major customer segments such as mining, infrastructure and other nonresidential construction, manufacturing and process industry, is expected to remain at the current high level. 29 2020 -11 -10
30 2020 -11 -10
Cautionary Statement “Some statements herein are forward-looking and the actual outcome could be materially different. In addition to the factors explicitly commented upon, the actual outcome could be materially effected by other factors like for example, the effect of economic conditions, exchange-rate and interest-rate movements, political risks, impact of competing products and their pricing, product development, commercialization and technological difficulties, supply disturbances, and the major customer credit losses. ” 31 2020 -11 -10