
Index Group Handout The face of interaction Atlas










- Slides: 54
• Index Group Handout The face of interaction Atlas Copco Group – June 30 th 2000
• Index Contents • Q 2 Highlights • Market Development • Business Areas • Financials • Outlook
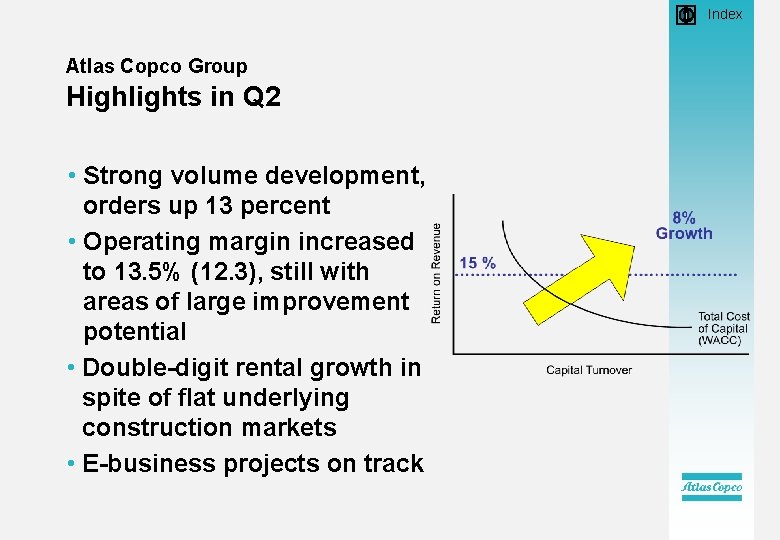
• Index Atlas Copco Group Highlights in Q 2 • Strong volume development, orders up 13 percent
• Index Atlas Copco Group Volume Growth per Quarter
• Index Atlas Copco Group Highlights in Q 2 • Strong volume development, orders up 13 percent • Operating margin increased to 13. 5% (12. 3), still with areas of large improvement potential • Double-digit rental growth in spite of flat underlying construction markets • E-business projects on track
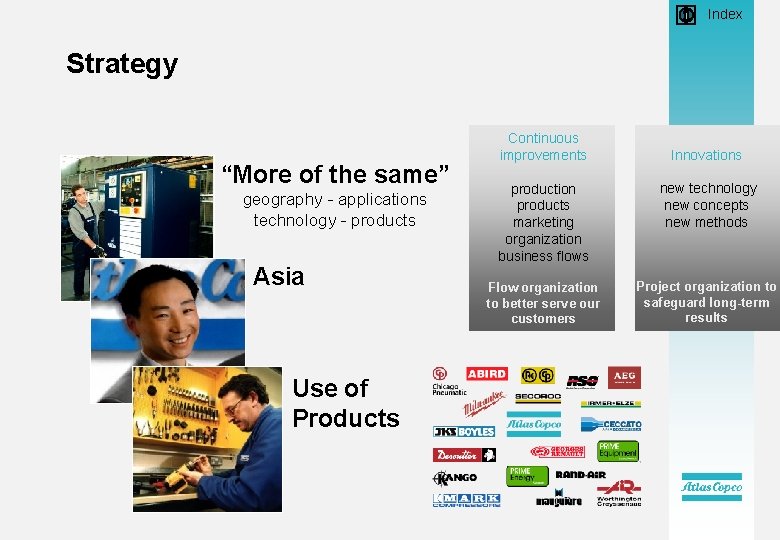
• Index Strategy “More of the same” geography - applications technology - products Asia Use of Products Continuous improvements Innovations production products marketing organization business flows new technology new concepts new methods Flow organization to better serve our customers Project organization to safeguard long-term results
• Index Strategic Moves • Growth – – Rapid expansion of production in China Rental Service completed 20 cold starts and acquired 20 stores in the quarter • Development – – VSD technology expand in range of compressors Internal service providers (ASAP + ISP) in operation Full e-trade functionality in Milwaukee web-site People
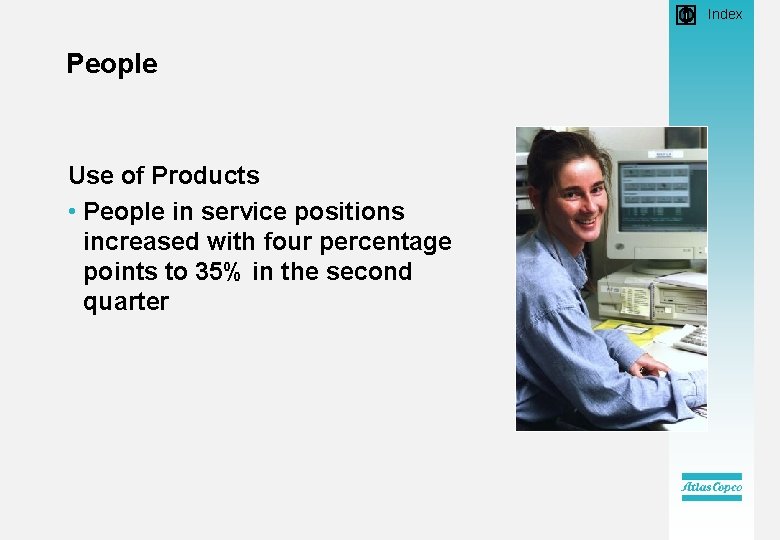
• Index People Use of Products • People in service positions increased with four percentage points to 35% in the second quarter
• Index Market Development
• Index Market Quotes
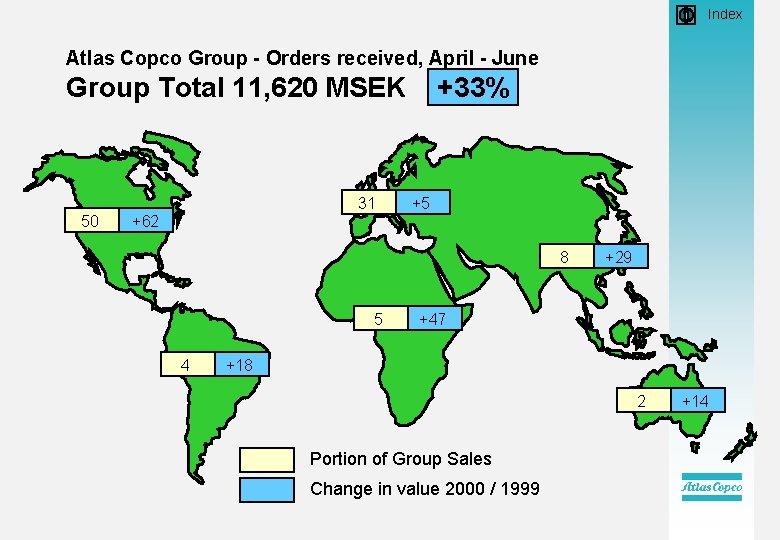
• Index Atlas Copco Group - Orders received, April - June Group Total 11, 620 MSEK 50 31 +62 +33% +5 8 5 4 +29 +47 +18 2 Portion of Group Sales Change in value 2000 / 1999 +14
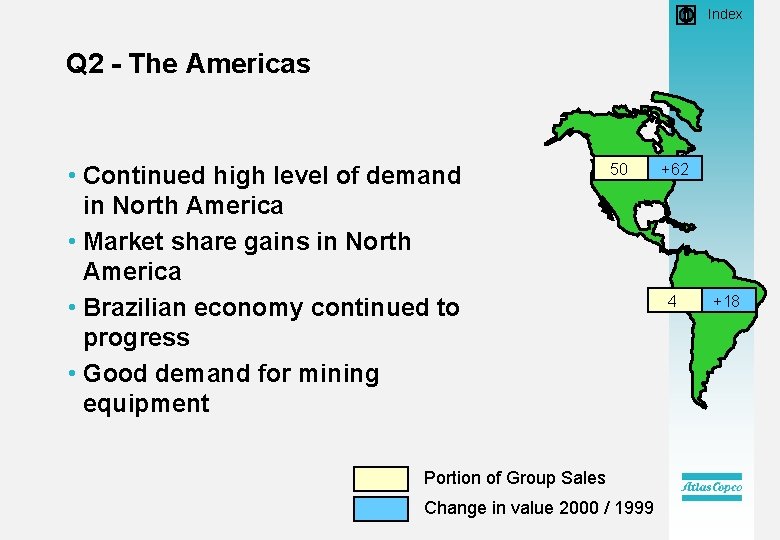
• Index Q 2 - The Americas • Continued high level of demand in North America • Market share gains in North America • Brazilian economy continued to progress • Good demand for mining equipment 50 Portion of Group Sales Change in value 2000 / 1999 +62 4 +18
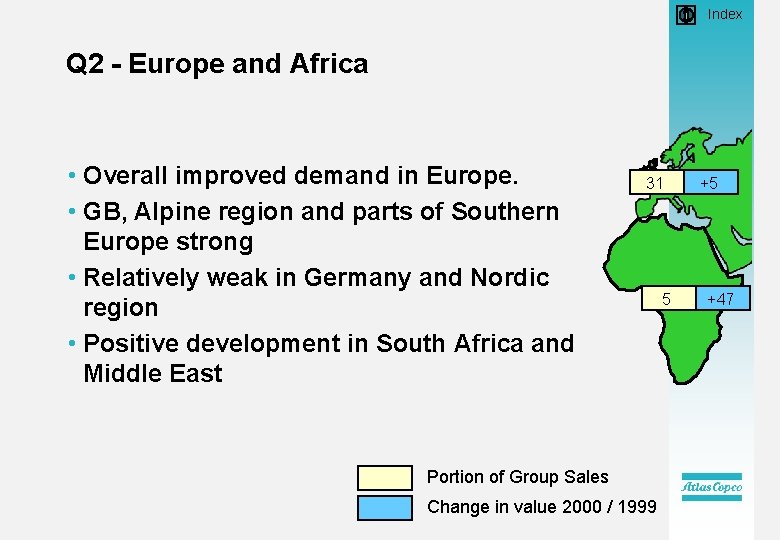
• Index Q 2 - Europe and Africa • Overall improved demand in Europe. • GB, Alpine region and parts of Southern Europe strong • Relatively weak in Germany and Nordic region • Positive development in South Africa and Middle East 31 Portion of Group Sales Change in value 2000 / 1999 5 +5 +47
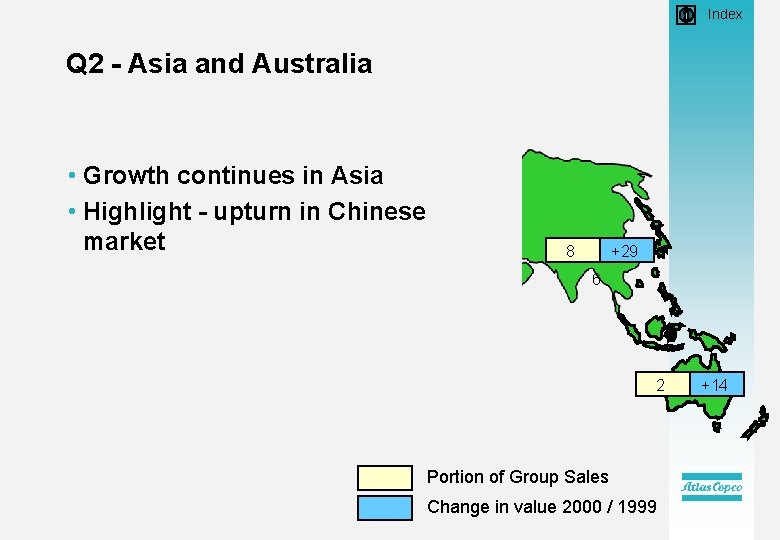
• Index Q 2 - Asia and Australia • Growth continues in Asia • Highlight - upturn in Chinese market 8 +29 6 2 Portion of Group Sales Change in value 2000 / 1999 +14
• Index Atlas Copco Group Total
• Index Business Areas
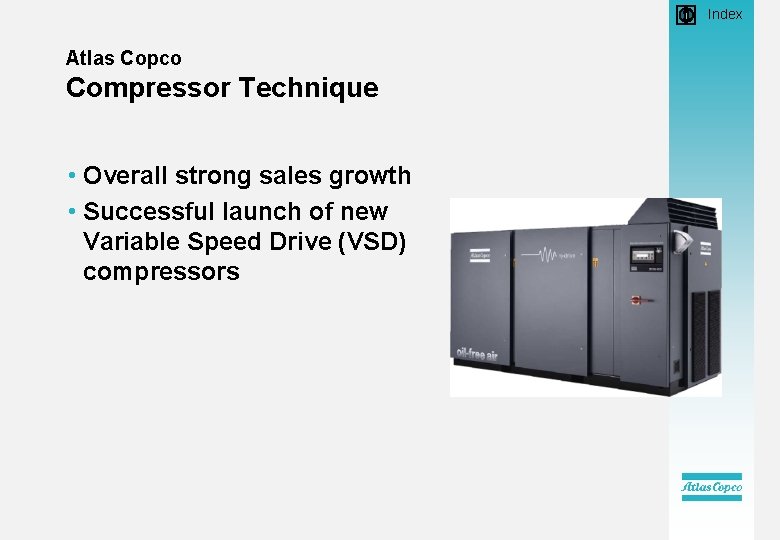
• Index Atlas Copco Compressor Technique • Overall strong sales growth • Successful launch of new Variable Speed Drive (VSD) compressors
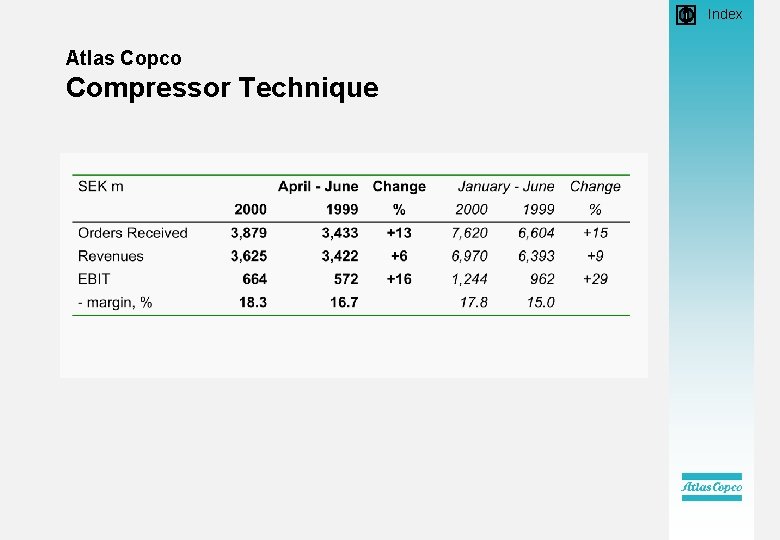
• Index Atlas Copco Compressor Technique
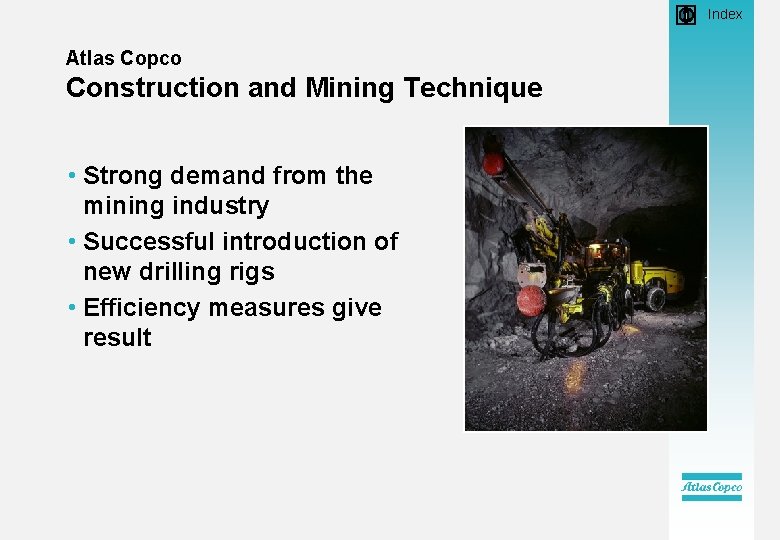
• Index Atlas Copco Construction and Mining Technique • Strong demand from the mining industry • Successful introduction of new drilling rigs • Efficiency measures give result
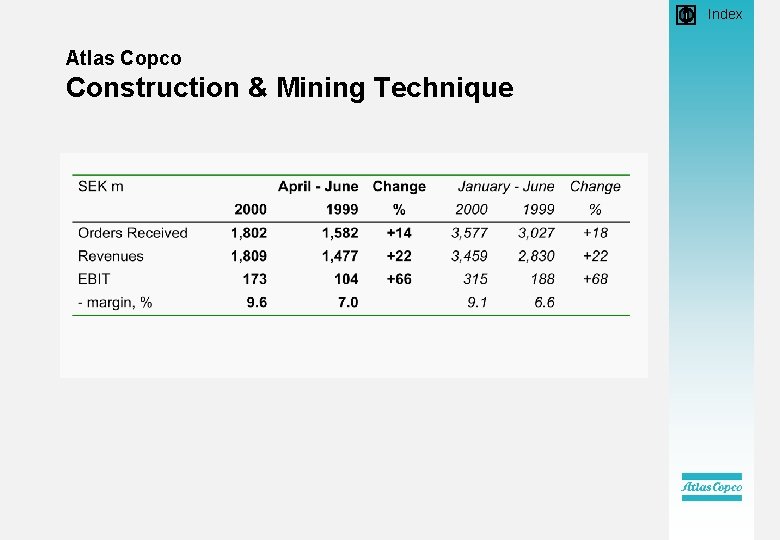
• Index Atlas Copco Construction & Mining Technique
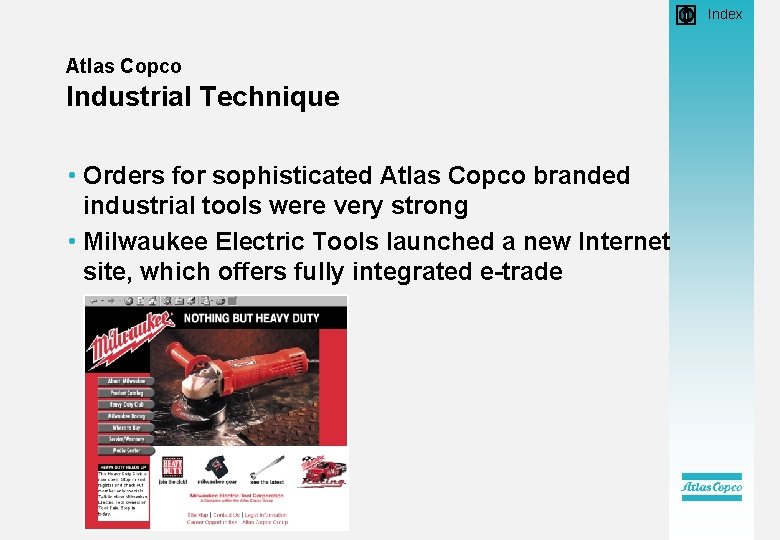
• Index Atlas Copco Industrial Technique • Orders for sophisticated Atlas Copco branded industrial tools were very strong • Milwaukee Electric Tools launched a new Internet site, which offers fully integrated e-trade
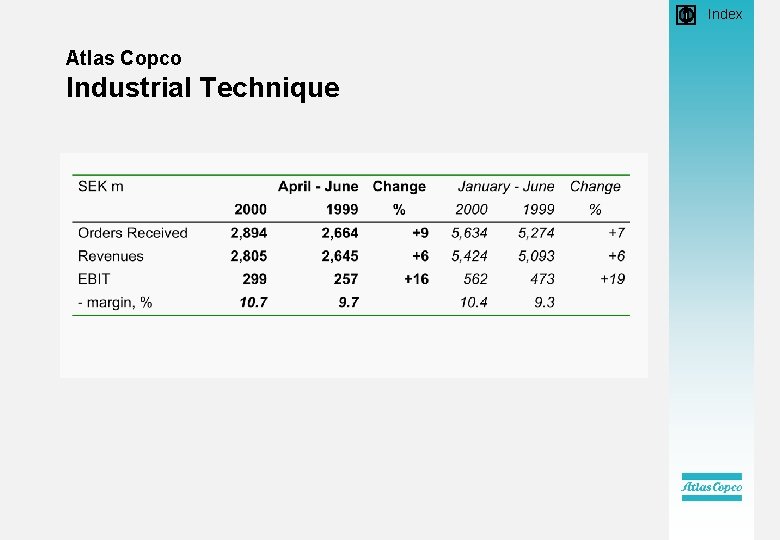
• Index Atlas Copco Industrial Technique
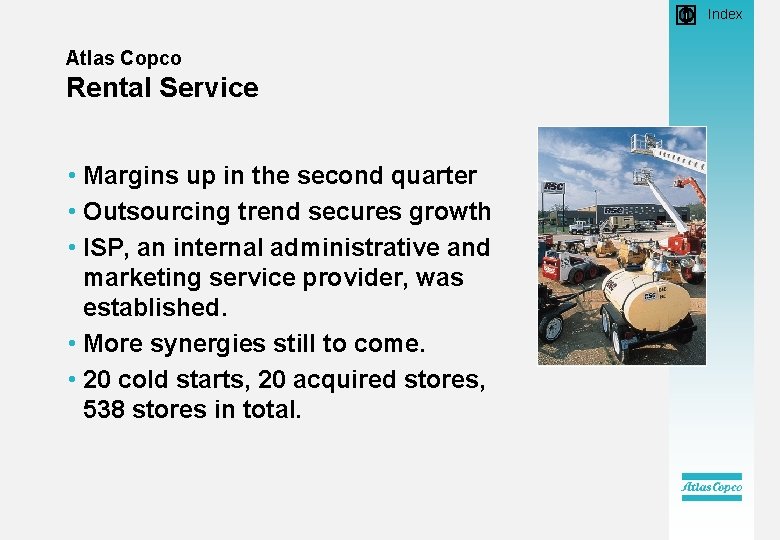
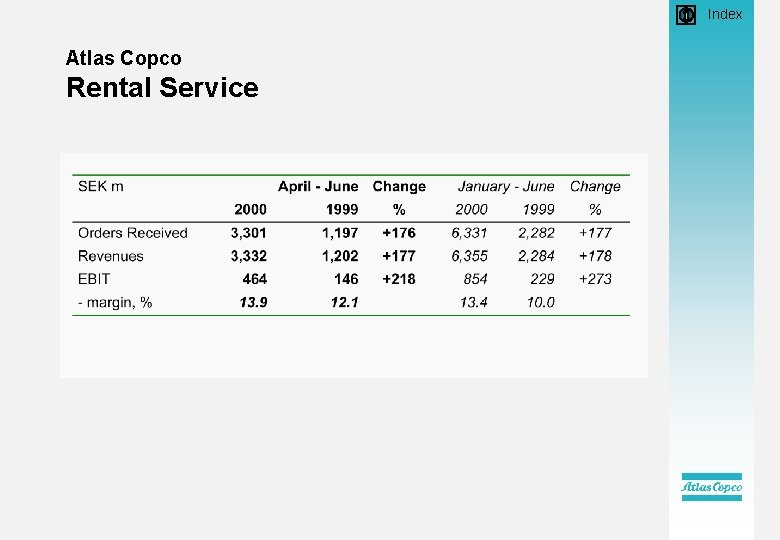
• Index Atlas Copco Rental Service • Margins up in the second quarter • Outsourcing trend secures growth • ISP, an internal administrative and marketing service provider, was established. • More synergies still to come. • 20 cold starts, 20 acquired stores, 538 stores in total.
• Index Atlas Copco Rental Service
• Index Financials
• Index Atlas Copco Group Cash Flow
• Index Atlas Copco Group Capital Expenditures in Tangible Fixed Assets SEK m 12 months Quarterly 1996 1997 1998 1999 2000 June
• Index Atlas Copco Group Balance Sheet, June 30
• Index Atlas Copco Group Income Statement
• Index Outlook
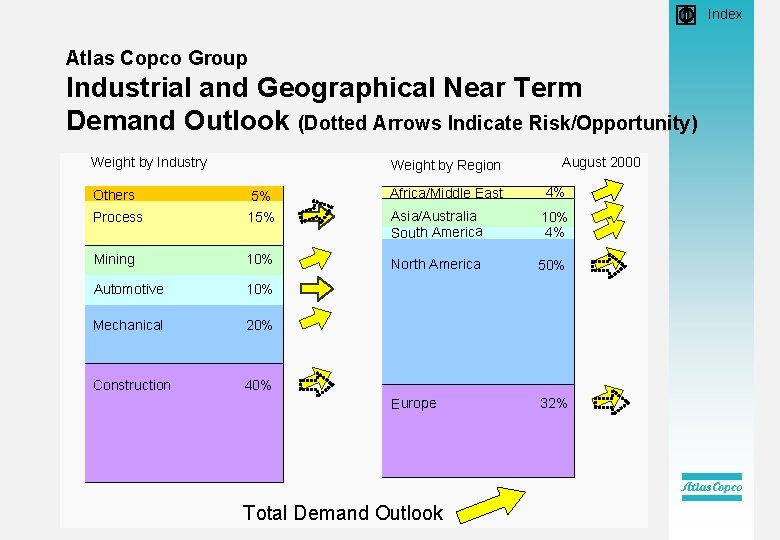
• Index Atlas Copco Group Industrial and Geographical Near Term Demand Outlook (Dotted Arrows Indicate Risk/Opportunity) Weight by Industry Weight by Region August 2000 4% Africa/Middle East Process 5% 15% Asia/Australia South America 10% 4% Mining 10% North America 50% Automotive 10% Mechanical 20% Construction 40% Europe 32% Others Total Demand Outlook
The face of interaction • Index
• Index The face of interaction End of Presentation
• Index Extra Information • New Group Website • Growth and Trends • Margins and Earnings • Taxes • Inventories, Customer Receivables and Net Rental Equipment • Cash and Interest Bearing Debt • Profit per Share • Demand Keys
• Index www. atlascopco-group. com • New Group Website – – – Group Press Investor Career etc. . . • Multibrand - each brand has own site – – – Atlas Copco Brand - www. atlascopco. com Prime - www. prime-equip. com etc. .
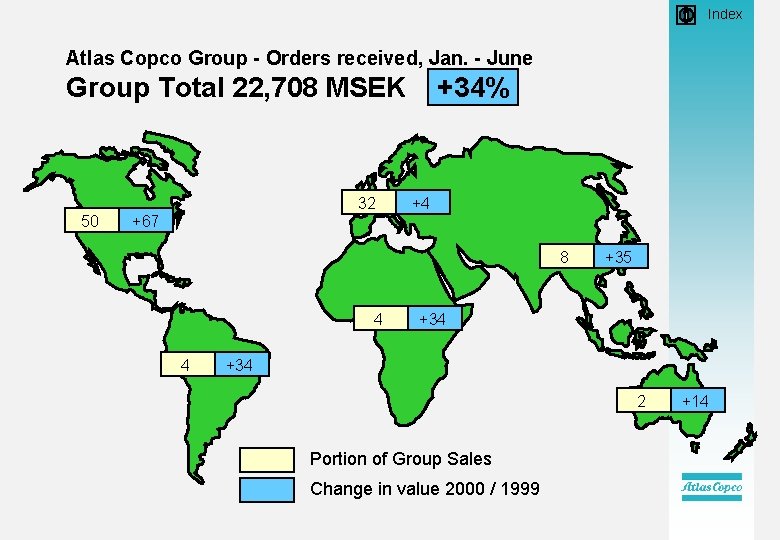
• Index Atlas Copco Group - Orders received, Jan. - June Group Total 22, 708 MSEK 50 32 +67 +34% +4 8 4 4 +35 +34 2 Portion of Group Sales Change in value 2000 / 1999 +14
• Index Atlas Copco Group Volume Growth per Quarter by Business Area
• Index Atlas Copco Group Long Term Trend
• Index Atlas Copco Compressor Technique
• Index Atlas Copco Construction & Mining Technique
• Index Atlas Copco Industrial Technique
• Index Atlas Copco Rental Service
• Index Atlas Copco Group Operating Margins per Quarter
• Index Atlas Copco Group Earnings by Business Area April - June
• Index Atlas Copco Group Earnings by Business Area January - June
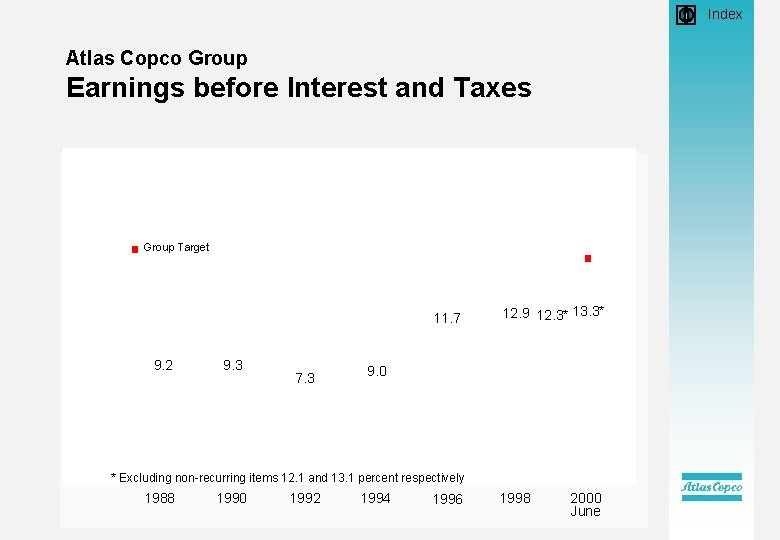
• Index Atlas Copco Group Earnings before Interest and Taxes 12 month values SEK m % of NIS Group Target 11. 7 9. 2 9. 3 7. 3 12. 9 12. 3* 13. 3* 9. 0 * Excluding non-recurring items 12. 1 and 13. 1 percent respectively 1988 1990 1992 1994 1996 1998 2000 June
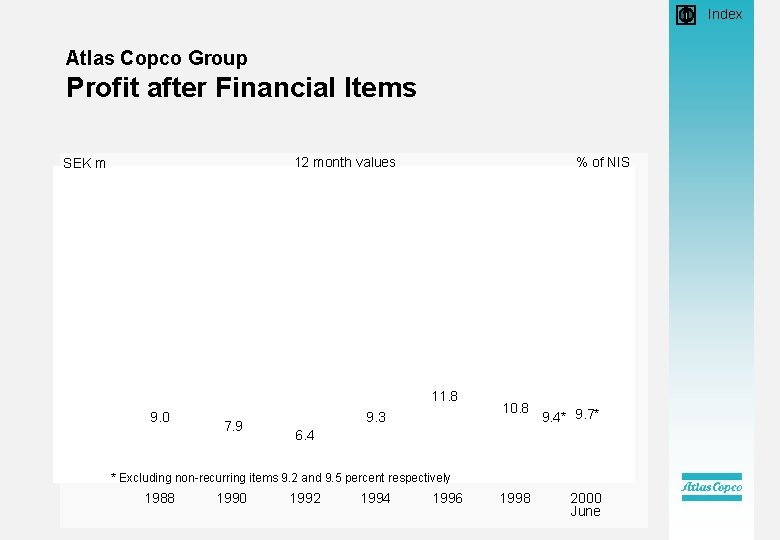
• Index Atlas Copco Group Profit after Financial Items 12 month values SEK m % of NIS 11. 8 9. 0 7. 9 9. 3 10. 8 9. 4* 9. 7* 1998 2000 June 6. 4 * Excluding non-recurring items 9. 2 and 9. 5 percent respectively 1988 1990 1992 1994 1996
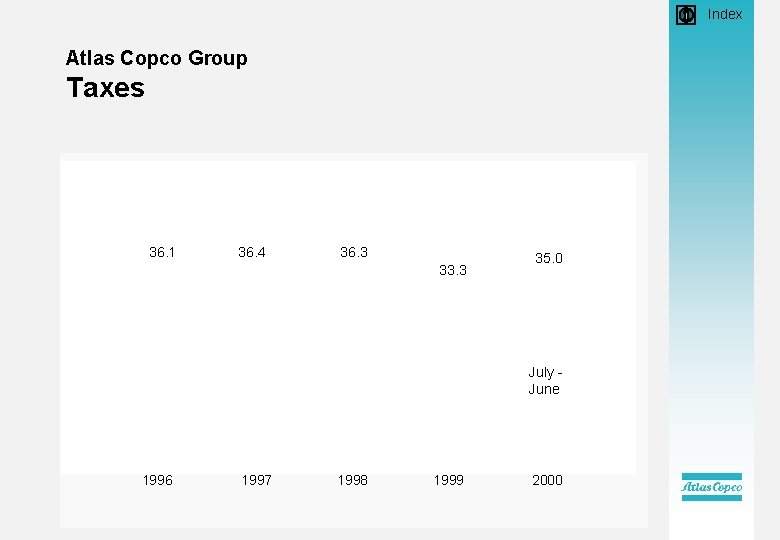
• Index Atlas Copco Group Taxes 36. 1 36. 4 36. 3 33. 3 35. 0 July June 1996 1997 1998 1999 2000
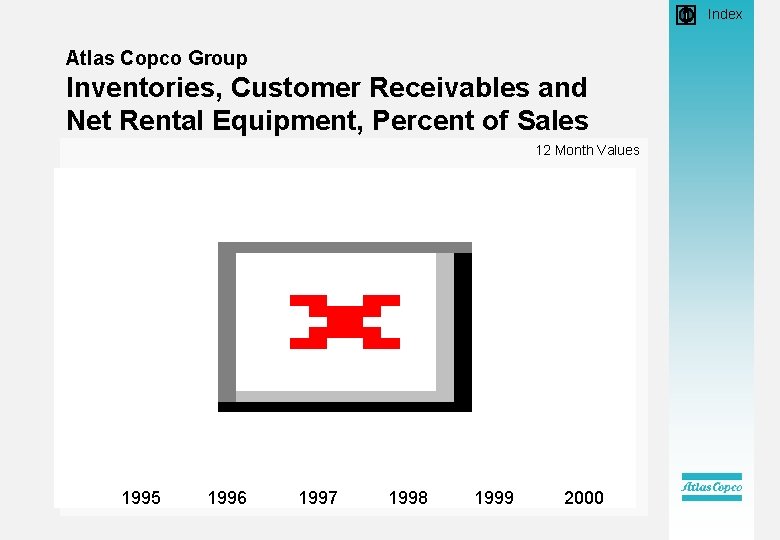
• Index Atlas Copco Group Inventories, Customer Receivables and Net Rental Equipment, Percent of Sales 12 Month Values 1995 1996 1997 1998 1999 2000
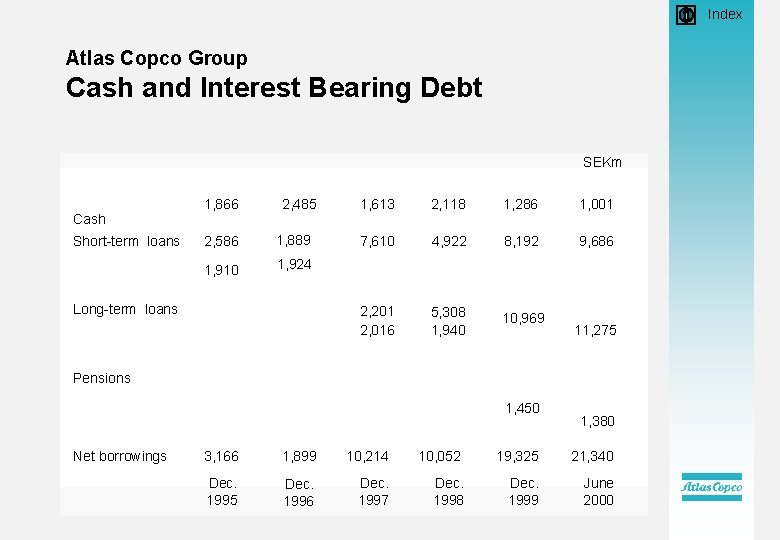
• Index Atlas Copco Group Cash and Interest Bearing Debt SEKm Cash Short-term loans 1, 866 2, 485 2, 586 1, 889 1, 910 1, 924 Long-term loans 1, 613 2, 118 1, 286 1, 001 7, 610 4, 922 8, 192 9, 686 2, 201 2, 016 5, 308 1, 940 10, 969 11, 275 Pensions 1, 450 Net borrowings 1, 380 3, 166 1, 899 10, 214 10, 052 19, 325 21, 340 Dec. 1995 Dec. 1996 Dec. 1997 Dec. 1998 Dec. 1999 June 2000
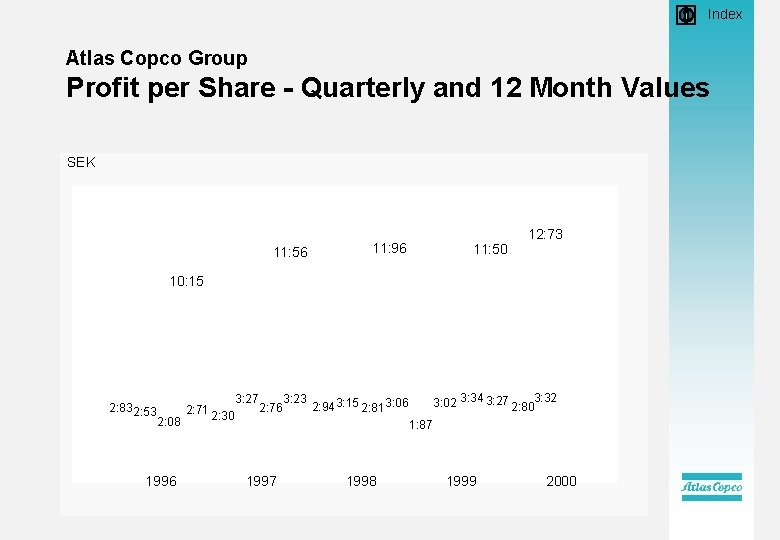
• Index Atlas Copco Group Profit per Share - Quarterly and 12 Month Values SEK 11: 56 11: 96 3: 23 2: 94 3: 15 2: 81 3: 06 11: 50 12: 73 10: 15 2: 83 2: 53 2: 08 1996 2: 71 2: 30 3: 27 2: 76 3: 02 3: 34 3: 27 2: 803: 32 1: 87 1998 1999 2000
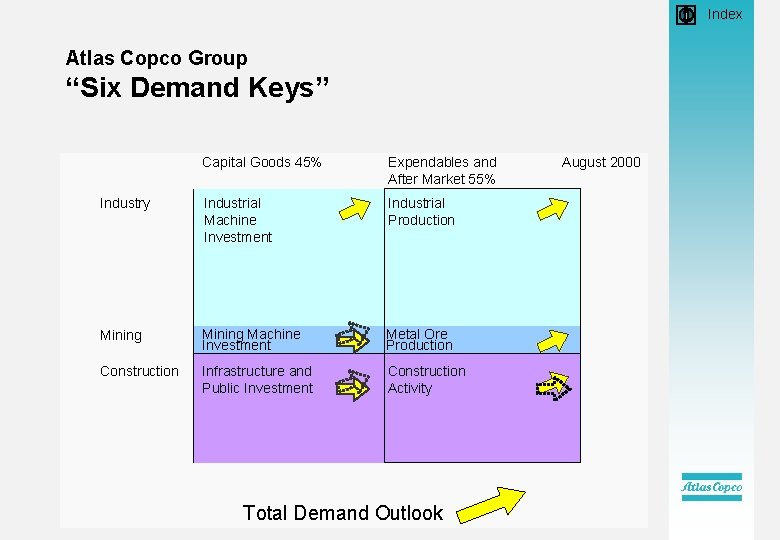
• Index Atlas Copco Group “Six Demand Keys” Capital Goods 45% Expendables and After Market 55% Industry Industrial Machine Investment Industrial Production Mining Machine Investment Metal Ore Production Construction Infrastructure and Public Investment Construction Activity Total Demand Outlook August 2000
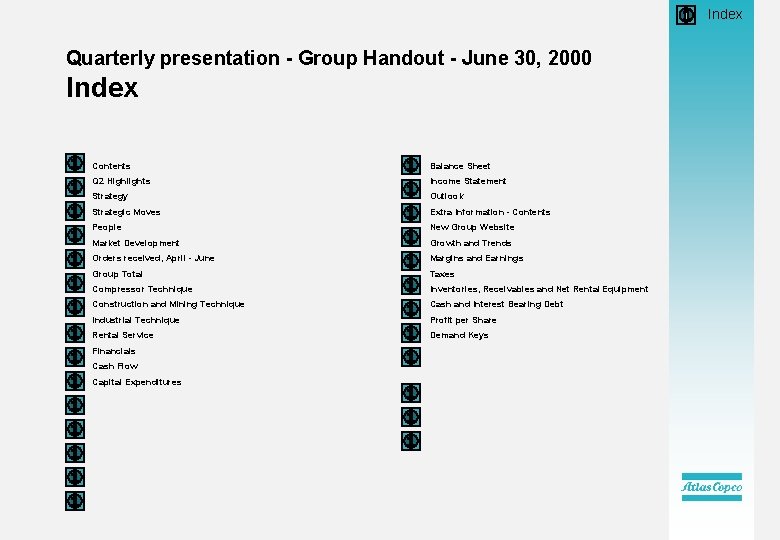
• Index Quarterly presentation - Group Handout - June 30, 2000 Index Contents Balance Sheet Q 2 Highlights Income Statement Strategy Outlook Strategic Moves Extra Information - Contents People New Group Website Market Development Growth and Trends Orders received, April - June Margins and Earnings Group Total Taxes Compressor Technique Inventories, Receivables and Net Rental Equipment Construction and Mining Technique Cash and Interest Bearing Debt Industrial Technique Profit per Share Rental Service Demand Keys Financials Cash Flow Capital Expenditures