ASSIGNING MALARIA TO THE PAST ETHIOPIAS NATIONAL RESPONSE


 malarious § 2/3 of")


 12 12")


 2000 1500")


- Slides: 35
ASSIGNING MALARIA TO THE PAST: ETHIOPIA’S NATIONAL RESPONSE TO MALARIA, ITS TREATMENT AND ELIMINATION IV Corporate Africa Business Coalition Partnerships for Prevention & Care, Africa Health conference , Addis Ababa, 7 -9 Feb 2011 By: Daddi Jima (MD, MPh) D/Director General, EHNRI
Global Malaria Epidemiology § Today approximately 40% of the world’s population is at risk of malaria § Malaria causes 300 - 500 million clinical cases and >1 million deaths per year, with about 90% of deaths and 60% of cases occurring in Africa, South of the Sahara. § It is responsible for 25%-45% of all outpatient clinic cases across Africa. 2
Global Malaria Epidemiology § Malaria accounts for one in five of all childhood deaths in Africa every year. § Malaria epidemic causes >12 million malaria episodes & up to 310, 000 deaths in Africa annually § Malaria transmission occurs in 109 countries and territories. § These areas between 45°N and 40°S latitude. These countries possess tropical or subtropical zones where optimal climatic condition favourable for the development of anopheline mosquito and parasites exists.
Malaria distribution and status of intervention 4
Africa Malaria Epidemiology § 615 million Africans at risk §Less stable malaria – vulnerable populations … approx 125 million at risk §More stable malaria – vulnerable populations are approx 490 million
Ethiopia Malaria Epidemiology § 75% of the land (<2000 m) malarious § 2/3 of the population at risk § Transmission - Major, September December, Minor, April - May
Ethiopia Malaria Epidemiology § Malaria is a major public health problem in Ethiopia § Every year it was the leading cause of out patient consultations, admissions and death § Recently, however, the rapid scale up of interventions has brought about significant decline in malaria burden
Important milestones in the control of malaria 1944 -45 First indoor spraying with DDT in Italy, Venezuela, Guyana 1955 Adoption of the principle of malaria eradication by the 14 th Word Health Assembly 1957 -69 Worldwide malaria eradication programme (WHO) 1969 Revision of the global strategy of malaria eradication: need for greater involvement of general health services 1973 -78 Marked resurgence of malaria in southern and southeastern Asia 1978 Reorientation of malaria control strategy, following the recommendations of the International Conference of Primary Health Care held at Alma Ata. 1992 Adoption of the Global Malaria Control Strategy (Amsterdam) 1998 Roll Back Malaria as priority project of WHO
Important milestones in the control of malaria in Ethiopia 1959 Malaria Eradication Service established One year after major malaria epidemic Main strategy was Indoor residual spray 1971 Vertical Malaria Control Program 1993 Integrated and decentralized Control P. Routine malaria control (including vector control) to be handed over to PHCUs
Main strategies Early diagnosis and prompt treatment Selective Vector control Epidemic prevention and control Supporting strategies Human resource development IEC HMIS Monitoring and Evaluation Operational research
ACHIEVEMENTS 11
RAPID SCALE UP OF INTERVENTIONS FOR IMPACT (QUANTITY, QUALITY & SPEED) 12 12
Key Malaria Control Goals and Targets Global RBM Partnership Plan To halve Malaria-associated mortality by 2010 and again by 2015. Millennium Development Goals Target 8: to have halted by 2015 and begun to reverse the incidence of Malaria and other major diseases. Indicator 21. Prevalence and death rates associated with Malaria (WHO). Indicator 22. Proportion of population in Malaria-risk areas using effective Malaria prevention and treatment measures (UNICEF/WHO).
Key Malaria Control Goals and Targets National goals and targets By 2015, achieve malaria elimination within specific geographical areas with historically low malaria transmission By 2015, achieve near zero malaria transmission in the remaining malarious areas of the country Objectives (see above) 14
Major Achievements: Diagnosis and Treatment Target: Universal coverage of fever treatment within 24 hours of onset in 2009 RDT procurement and distribution, Procurement and distribution of Coartem 12, 000 No of ACTs delivered as 1 st-line RDT procured and distributed 9, 000 6, 900, 000 6, 500, 000 5, 000 3, 200, 000 3, 000 2005 3, 500, 000 2006 2007 9, 300, 000 6, 000 4, 100, 000 2008 4, 500, 000 2009 2010 15
Source: WHO world malaria report 2009 16
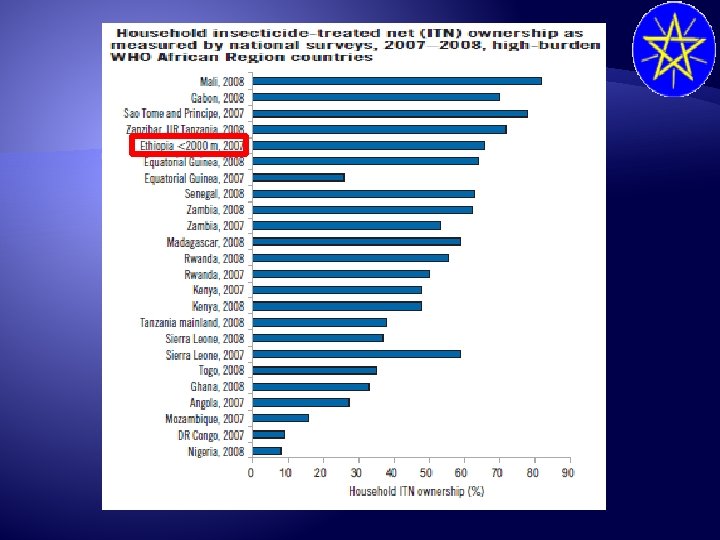
Major Achievements: LLINs Rapid scale up of ITNs in Ethiopia, 2000 - 2010 LLINs replaced Cumulative number of LLINs distributed Arrival of LLINs Support from GFATM Net with 6 -month treatments 17
Net ownership and percentage of HH that received IRS - MIS 2007 100 90 RBM Global Strategic plan targets 80 70 RBM Abuja targets 60 MIS 2007 - national MIS 2007 - <2000 m 50 40 30 20 10 0 %HH with at least one ITN % HH that received IRS % of HH protected by ITNs or IRS 18
Net utilization – Children - MIS 2007 100 90 RBM Global Strategic plan targets 80 70 DHS 2005 RBM Abuja targets 60 MIS 2007 national 50 40 MIS 2007 <2000 m 30 20 10 0 % children who slept under a net % children who slept under an ITN in HH with at least one ITN 19
Net utilization – Pregnant Mothers - MIS 2007 100 90 RBM Global Strategic plan targets 80 70 RBM Abuja targets 60 50 DHS 2005 MIS 2007 national MIS 2007 <2000 m 40 30 20 10 0 % pregnant women who slept under a net % pregnant women who slept under an ITN in HH with at least one ITN 20
Current Intervention Coverage Summary– MIS 2007 Indicators DHS 2005 MIS 2007 National Malarious % of HH with at least one net (any net) 5. 7% 10. 7% 55. 7% 69% % of HH with at least one ITN 3. 4% 6. 4% 53. 3% 66% 2. 3% 4. 3% 34. 7% 44%† 1. 5% 2. 8% 33. 1% 42%† 1. 6% 2. 5% 36. 7% 44%† % use of ITNs by pregnant women 1. 1% 1. 6% 35. 2% 43%† % of children who had a fever in the two weeks preceding the survey 18. 7% * 22. 3% 24% % of children with a fever who took an anti -malarial (within 24 hrs) 3% (0. 7%) * 9. 5% (3. 9%) 12% (5%) % use of nets (any nets) by children under five % use of ITNs by children under five % use of nets (any net) by pregnant women * “malarious areas” defined as areas <2000 meters elevation; 2005 DHS did not include this measure. † among those in HH with a net, net-use rates for children or pregnant women were 60% and 66% respectively
IMPACTS ON DISEASE BURDEN 23
MORBIDITY AND MORTALITY Malaria death rate per 100, 000 pop 8. 0 Rate per 100, 000 7. 0 6. 0 5. 0 4. 0 3. 0 2. 0 1. 0 - 2003 2004 2005 2006 2007 2008 24 2009 24
Malaria and non malaria admissions and deaths in Ethiopia, 2002– 2009 Source: World malaria report, WHO, 2010 25
Malaria and non malaria admissions and deaths in Ethiopia, 2002– 2009 Source: World malaria report, WHO, 2010 26
Malaria Epidemics Recorded, Ethiopia 2500 2, 368 (July 2000 – June 2008) 2000 1500 1000 775 500 765 681 441 80 0 10 3 July 00 - June 01 July 01 - June 02 July 02 - June 03 July 03 - June 04 July 04 - June 05 July 05 - June 06 July 06 - June 07 July 07 - June 08 Source: data collected from Regional Health Bureaus, FMOH
Malaria Burden Weighted mean of percentage decline of malaria admission, death, outpatient cases key malaria indicators in children under 5 year and >5 years, Ethiopia 2001 -2007. Age admission Death OPD malaria -confirmed Slide positivity rate > 5 years -55% -34% -48% -70% --- < 5 years -52% -56% -47% -61% --- All ages -54% -55% -48% -67% -38% Compared: Mean 2001 – 2004 as baseline Vs 2007 data Source: Global Malaria Program Department, WHO, Geneva
Future Direction
The Strategic Plan Name: NATIONAL STRATEGIC PLAN FOR MALARIA PREVENTION, CONTROL AND ELIMINATION IN ETHIOPIA Year covers: 2010 – 2015 30
1. Vision and Goals Vision: To eliminate malaria nationwide by 2020 Goals: By 2015, achieve malaria elimination within specific geographical areas with historically low malaria transmission By 2015, achieve near zero malaria transmission in the remaining malarious areas of the country 31
Framework GOALS • By 2015, achieve malaria elimination within specific geographical areas with historically low malaria transmission • By 2015, achieve near zero malaria transmission in the remaining malarious areas of the country OBJECTIVES Consolidate the achievements of the 2006 -2010 National Strategic Plan, and sustain its impacts STRATEGIES • Community empowerment and mobilization • Diagnosis and Case management, including active case detection • Prevention [LLINs distribution, IRS] • Active surveillance and epidemic control M O N I T O R I N g & E V A L U A T I O N Multi-program initiatives to strengthen the overall health system and capacity building 32
Why now? § Ethiopia has already scaled up all the malaria interventions 33
Malaria distribution and status of intervention 34
Why now? § § § There is significant reduction in burden There is global commitment to eliminate malaria There is high level commitment Ample opportunity of funding Extensive health expansion There are good intervention strategies 35