Analyzing p K data OverComplete Measurements and partialwave
Λ data: (Over)Complete Measurements and partial-wave analyses")


 amplitudes")


")


 Physical domain")


")
")


- Slides: 37
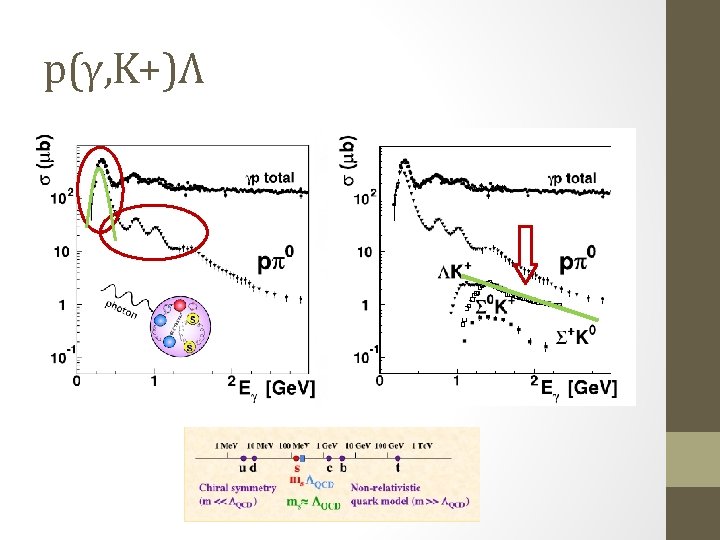
Analyzing p(γ, K+)Λ data: (Over)Complete Measurements and partial-wave analyses
4 topics •
The data
Data: visualized NEW CLAS
New data: visualized
CLAS overview
Experiments
Partial-wave analysis and amplitude extraction
Differential cross section
Multipoles
L_max and ambiguities
Chiang and Tabakin Single-(s, t) amplitudes
Case for real data: entropy
Real data AND models
Comparing data sets
More interesting: the future • Projects that are on my to-do list: • Tackle model-independent PWA in a Bayesian framework. (finished proof of principle) • Finite-energy Sum Rules in eta photoproduction. (main research) • Further down the road • Improving the Regge-plus-resonance model for electroproduction. • Extending the Vrancx-Ryckebusch models (above the resonance region).
Bayesian approach • Chi-square: point estimate of the parameters • What is the uncertainty of your results? • NOT (!!!) Minuit error bars (see Sandorfi plots) • You can do bootstrapping • Bayesian framework: works with distributions. • Has been applied to similar problems and is well-accepted. • You get a very (very!) good idea of what the errors are. • You can properly determine the L_max from your data (evidence).
Probability theory •
Observable level
No overfitting or unnecessary model dependence + NO STARTING VALUES!
VERY first results for P. O. C. 1. Identification of outliers 2. Identification of ambiguities 3. Allows for smooth connections (continuous distributions!) Violin plot for Lmax = 1, Re E 0+ These distributions can be projected to observables Results with Multi. Nest: Gives you ALL maxima
About yesterday Make cuts here and see which multipoles would be affected
Evidence chart
Observables (only maxima)
Pros and cons • Pros • Posterior samples from which one can calculate • Marginals • Probabilities with multipoles with evidence • Distributions for the observables • Not just ‘visual’ inspection of proper Lmax, but Occam’s razer naturally built in. • You have a better idea of how significant your results are than with a single Minuit minimization. • Cons • Computational time (limits to Lmax = 5 if no phases are fixed). • Maybe I did not consider the proper reaction for this.
Collaboration with V. Mathieu Finite-Energy Sum Rules Unphysical Regge Low-energy Models Im s Re s
Dispersive integral Nucleon pole Regge Unphysical domain (2) Physical domain
Continuation of the multipoles
Legendre polynomials
Legendre polynomials L=0 J = 1/2
Legendre polynomials
Legendre polynomials
2 CGLN amplitudes (t = -0, 5 Ge. V )
Invariant amplitudes (t = -0, 5 Ge. V 2)
Fin
Different than penalty terms Regularization or ‘ridge regression’