Honors Chemistry Chapter 2 Measurements and Calculations Important


 • Two ways to measure the volume of solids: 1. ) Regularly-shaped")


 How many centimeters are in 2. 5 miles (1")


 What are they? The minimum number of digits required to")
 Rule Example 1. ) Zeros appearing between non-zero digits a.")


- Slides: 46
Honors Chemistry Chapter 2 Measurements and Calculations
Important Terms • Chemistry – is the study of _______ and the changes it undergoes. • Matter – is anything that has ______ and takes up space. (______). • Mass – a measure of the amount of ________. • Weight – the measure of gravitational pull on matter. Weight _____ with the gravitational pull of objects. (Earth vs Moon)
Section 1 The Scientific Method
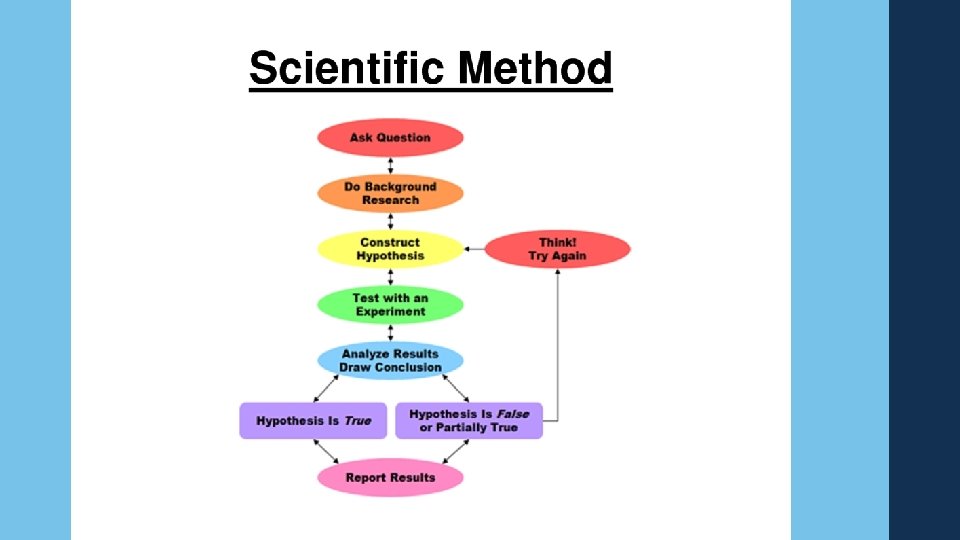
The Scientific Method What is it? ? A logical approach to solving problems. 5 Major Parts: Observing and Collecting Data Formulating a Hypothesis Testing the Hypothesis Formulating Theories Supported by Data Publish Results
Observing and Collecting Data Observing—using the sense to obtain information. Sight, Smell, Touch, Taste, Hear. Collecting Data—Two different ways Quantitatively—numerical. Example: Mass (30 grams) Qualitatively—information describes _______, _________, _______, or _______. Qualitatively is descriptive, non-numerical. Example: A reaction mixture changes from red to blue. Experimentation—carrying out a procedure under controlled conditions to collect data and make observations. A set of controlled observation that test the hypothesis. You must test ____ variable at a time. Qualitative and Quantitative worksheet
Variables • Independent variable – the variable _____ by scientists. • Dependent variable – the value changed in ______ to the ______ variable. • Control – a standard used for ________. • ** experiments are run hundreds of times to obtain accurate data.
Formulating a Hypothesis • Examine and compare data from experiments. • Find patterns and relationships in the data. • Use generalizations about the data to form a hypothesis, an educated guess. • Hypothesis is used as a prediction for further experiments.
Testing the Hypothesis • Further experimentation Controls—experimental conditions that remain constant Variable—experimental conditions that change, or vary. • Data from experiments either supports or refutes hypothesis Support--Hypothesis and data is combined to formulate a theory. Refute—Hypothesis is modified or discarded.
Formulating a Theory • Form an explanation for the question WHY? • Scientists use models—an explanation of how phenomena occur and how data and events are related. • Enough data to support the WHY claim can upgrade a model to a theory. Theory—a broad generalization that explains a body of facts. Considered successful if it can predict results of many new experiments.
Reporting results - graphing • Graphing is a visual display of data. • Pie graph – displays ______ of a whole • Bar graph – shows how a quantity varies with factors like _______, and ______. Quantity measured on the y-axis (______) independent • Variable on x-axis (______). • Line graph – most used in chemistry • Independent variable on _______. Dependent variable on _______. • Data is plotted with points that _______ on the graph • Line is drawn so as many points are ______ the line as are below (line of best fit). (Not all interconnected like dot to dot).
Representing data • Direct Relationship – as one value _____, the other value increases; dividing one value by the other gives a constant value • Indirect relationship or inverse relationship – as one value increases, the other value _____; the product of these two values is constant 12
Direct Relationship Indirect Relationship 13
Interpreting Graphs • Direct relationship – if line is ________ Slope = y 1 -y 2 = ∆y x 1 -x 2 ∆x • Positive slope – if line ______ to the right. • Negative slope- if line ______ to the right. • Inverse relationship – if the line is _______ Interpolation – reading data that falls ______ measured points. Extrapolation – extending the line beyond _____ points for information.
Organized Approach • Identify the independent and dependent _______ • Look at the range of _____ and identify ______ • Is the graph linear or non-linear • Find ______ if linear • If multiple lines, analyze one line at a time. • Example p. 44
Section 2 SI Measurements
Scientific notation • Scientific notation is a way to write very large or very small numbers Only one nonzero number can appear to the left of the decimal If you move the decimal to the left, the exponent is positive If you move the decimal to the right, the exponent is negative. Negative exponents represent the inverse of a number. Ex— 10 -3 = 1/1000 = 0. 001 17
Scientific notation practice • Write the following numbers in scientific notation 560, 000 __________ 33, 400 __________ 0. 0004120 __________ 101. 210 __________ 0. 301 __________ 6, 967, 000 __________ 32. 1 __________ 0. 000000432 __________ 18
Scientific Notation • Mass of a proton is: 1. 627 x 10 -27 kg • Mass of an electron: 9. 109 x 10 -31 kg • Adding and Subtracting – exponents must be the _____ before calculation is done. • Multiplying – multiply the numerical factors, then ____the exponents • Division – divide the numerical factors, ______ the exponent of the denominator from numerator. • Example p. 32 -33
Multiplying and Dividing • When multiplying numbers in scientific notation, multiply the numbers and add the exponents. (2. 15 × 1015)(5. 134× 1034) = __________ (1. 234 × 10 -4)(5. 134× 102) = __________ • Dividing—Divide numbers first, then subtract exponents 3. 12 × 109 / 4. 355 × 103 = __________ 9. 10 × 10 -7 / 5. 014 × 102 = __________
SI measurement • The international system of ______ in science. • A measurement must include a value and a unit. Example: 54. 3 grams (g) • Benefits: Everything goes by 10’s. Standard naming Calculations and conversions are easier to perform. 21
SI Base Units There are 7 base units that are independent of other units (can stand alone).
Prefixes • Prefixes are used to identify quantities that are much higher or much lower than the base units 23
Converting •
Practice • Complete the following conversions: 10. 5 g = _______ kg 1. 57 km = _______ m 1. 2 L = _______ m. L 78. 3 mg = ________ g 25
Derived SI Units Derived units are units that are obtained by a combination of base units.
Volume (V) • Two ways to measure the volume of solids: 1. ) Regularly-shaped _____ length, width, and height then multiply. 2. ) Irregularly-shaped Must measure using _____ of water. Units of measurement for volume: m 3, cm 3, m. L
Volume problems • 50 m. L of water was added to a 100 m. L beaker. A rock was added and the water level rose to 55. 5 m. L. What is the volume of the rock? • Calculate the volume of a dresser having a length of 1. 2 m, a height of 1. 98 m, and a depth of 0. 60 m. 28
Density •
Density problems 1. What is the density of a block of marble that occupies 310. cm 3 and has a mass of 853 g? 2. Diamond has a density of 3. 26 g/cm 3. What is the mass of a diamond that has a volume of 0. 351 cm 3? 1. What is the volume of a sample of liquid mercury that has a mass of 76. 2 g, given that the density of mercury is 13. 6 g/m. L? 30
Density problems cntd. 4. What is the density of an 84. 7 g sample of an unknown substance if the sample occupies 49. 6 cm 3? 5. What volume would be occupied by 7. 75 g of this same substance? 31
Temperature • Temperature – the quantity of the energy of _____ of the particles that make it up • Three scales °C, °F, K (no degrees sign for Kelvin) • Melting point for water: 0 °C, 32 °F, 273. 15 K • Boiling point for water: 100 °C, 212 °F, 373. 15 K • K = °C + 273. 15 • 0 K 32
Dimensional Analysis • What is it? A way to use units to solve mathematical problems involving measurements. Converting from one set of units into another set using a conversion factor. A conversion factor is a way of expressing the same quantity in different units. (always equals 1 we don’t want the quantity to change). Example: How many seconds are in 24 hours? 24 hr x 60 min x 60 sec = 86, 400 s You MUST cancel units!! 1 hr x 1 min Quantity sought = quantity given × conversion factor How many quarters are in 12 dollars? Example p. 34 -45
Dimensional Analysis Problems 1. ) How many centimeters are in 2. 5 miles (1 mile = 1. 61 km)? 2. ) How many seconds are in 3. 23 years? 3. ) How many nickels are in 56. 32 dollars? 34
Section 3 Using Scientific Measurements
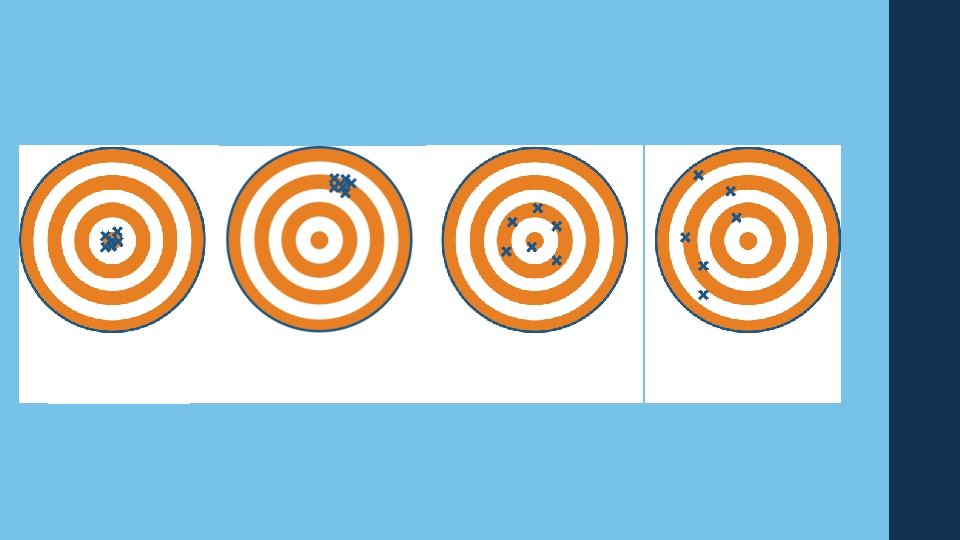
Accuracy and Precision Accuracy—how close a measurement is to the ____ value. Precision—how close together a ____ of measurements are. Precise measurements may not be accurate! (ex p. 37)
Percentage Error • Percent error is the ratio of an error to an accepted value. It does not matter whether the value is Larger or smaller than the accepted value. One the size of the error matters. Negative signs are Ignored.
Significant Figures (Sig Figs) What are they? The minimum number of digits required to report a value without loss of ____. SIG FIGS indicates the ____ of measurements. Includes all the known digits plus one estimated digit. Why are they useful? They tell us how good the data are that we are using. For example: If a scientist reports the mass of a compound, which is more accurate? 100 g 100. 3574 g? Reporting the correct # of sig figs = using the least accurate number to determine correct number.
Significant Figures (Sig Figs) Rule Example 1. ) Zeros appearing between non-zero digits a. 40. 7 has three sig figs. are significant. b. 56, 007 has five sig figs. 2. ) Zeros appearing in front of all nonzero digits are not significant. a. 0. 023154 has five sig figs. Convert to scientific notation to remove the b. 0. 00002 has one sig fig. 3. ) Zeros at the end of a number and to the right of the decimal place are significant. a. 85. 00 has four sig figs 4. ) Zeros used as placeholders are not significant. a. 2000 has one sig fig b. 34, 000 has two sig figs 5. ) A decimal point placed after zeros indicates that they are significant. a. 2000. has four sig figs b. 35, 000. has five sig figs placeholder zeros Non-zero numbers are always significant 92. 9 g (3 SF) Example p. 39
Significant figures examples • How many significant figures are in each of the following measurements? 28. 6 g 3440. cm 910 m 0. 04604 L 0. 0067000 kg • _________ _____ Suppose the value “seven thousand centimeters” is reported, how would you express the number to. . . 1 significant figures 4 significant figures 6 significant figures _______________ 41
Significant figures cntd. • Addition and subtraction – the answer must have the same number of digits to the right of the decimal as the number having the fewest number of digits to the right of the decimal Look to the right of the decimal Fewest number of decimal places wins. • Multiplication and division – the answer must have the same number of digits as the number having the fewest number of digits Look at the entire number Least number of digits wins 42
Examples • Carry out the following calculations. Express each answer to the correct number of significant figures. 5. 44 m – 2. 6103 m = 2. 4 m. L x 15. 82 m. L = 2. 099 g + 0. 05681 g = 87. 3 cm – 1. 655 cm = Calculate the area of a rectangle that measures 1. 34 mm by 0. 7488 mm. 43
All known plus one estimated 44
Rounding off Numbers • The last number of a sig fig is not significant. Rules: • If digit after last sig fig is less than 5, do not change 2. 532…. . 2. 53 • If digit after last sig fig is greater than 5, round up 2. 526…… 2. 54 Addition & Subtraction – must have the same number of digits to the right of the decimal as the value with the fewest digits to the right. Multiplication & Division – answer must have the same number of sig figs as the number with the fewest.
Summarize • What is the difference in quantitative and qualitative data? • What is the difference in independent and dependent variables? • What are the rules for scientific notation? • What is the general formula for a number to be in a scientific notation? • What is dimensional analysis? • What is the formula for density? How do you solve for volume? • What is the difference in accuracy and precision? • How do you solve for percent error? • What are rules for significant figures?