Analyze Data IQR and Outliers USE MEASURES OF


- Slides: 19
Analyze Data: IQR and Outliers USE MEASURES OF CENTRAL TENDENCY AND IQR MEAN & MEDIAN TO COMPARE THE CENTER OF DATA SETS. IDENTIFY OUTLIERS AND THEIR EFFECT ON DATA SETS.
Measure of Central Tendency Measures of central tendency are different ways to identify the “middle” / “center” of data sets. Mean, Median, Mode This measure attempts to describe the whole set of data with a single value that represents the middle or center of its distribution. Describing an entire data set with just one number is not always accurate, but all of the measures of central tendency have their own advantages
Measure of Central Tendency The mean is the average of all the numbers. To find the mean, you add up all of the numbers then divide by how many numbers are in the data set. Data can have only 1 mean Advantage: Can be used for both continuous and discrete numeric data. It is a preferred measure of center when the distribution is symmetrical. Limitations: Is influenced by outliers and skewed distribution.
Measure of Central Tendency The median is the middle number. To find the median, you put all the numbers in order from least to greatest (in numerical order) and select the center/middle number. If two numbers are split in the middle, average them together. Data can have only 1 median Advantage: Is less affected by outliers and skewed data. It is the preferred measure of center when the distribution is not symmetrical
Measure of Central Tendency The mode is the number that occurs with the most frequency. To find the mode, select the number that appears the most in the data set. Data can have several modes Generally not as useful as mean or median
5 Number Summary The Five Number Summary of a set of data consists of: Minimum Value Quartile 1 Median (which is also Q 2) Quartile 3 Maximum Value (which is also Q 4)
5 Number Summary Order the data from least to greatest. 2. Find the median 1. Use the given data 31, 23, 35, 26, 24, 31, 29 23 24 26 29 31 31 33 35 The median divides the data in half (pick the middle number or average the 2 middle numbers) Median = (29 + 31) ÷ 2 = 30 Find the median of the lower half. Q 1 = (24 + 26) ÷ 2 = 25 This is the 1 st Quartile (Q 1). Q 3 = (31 + 33) ÷ 2 = 32 4. Find the median of the upper half. This is the 3 rd Quartile (Q 3). 5. 5 number summary: 23 30 25 the lowest number _____, Q 1 _____, the median _____, 32 35 Q 3 _____ and the highest number _____. 3.
5 Number Summary Create a 5 Number Summary for the data in the table
The shape of data distributions. Symmetric: Left Skewed: Right Skewed: -Normal distribution -mound shaped -bell curve -mean and median are equal/nearly equal -outliers to left / being “pulled left” -more data grouped on the right -mean is less than the median -outliers to right / being “pulled right” -more data grouped on the left -mean is greater than the median
1. Symmetrical 2. Skewed Right 3. Skewed Left If you connected the top dot of each column, it would form a relatively symmetrical curve. There are few data points on the right, so the data is skewed right. There are fewer data points on the left, so the data is skewed left.
4. Bimodal The data has two areas where it peaks, so it is called Bimodal 5. Uniform The data is about the same for all numbers, so the graph is called Uniform.
Test your memory… The mean of a data set is 12 and the median is 12. What are the possible shapes for this data set? A. Mound B. Symmetric C. Skewed Right D. Skewed Left E. Both A & B The mean of a data set is 12 and the median is 10. What is the data shape? A. Octagonal B. Symmetric C. Skewed Right D. Skewed Left
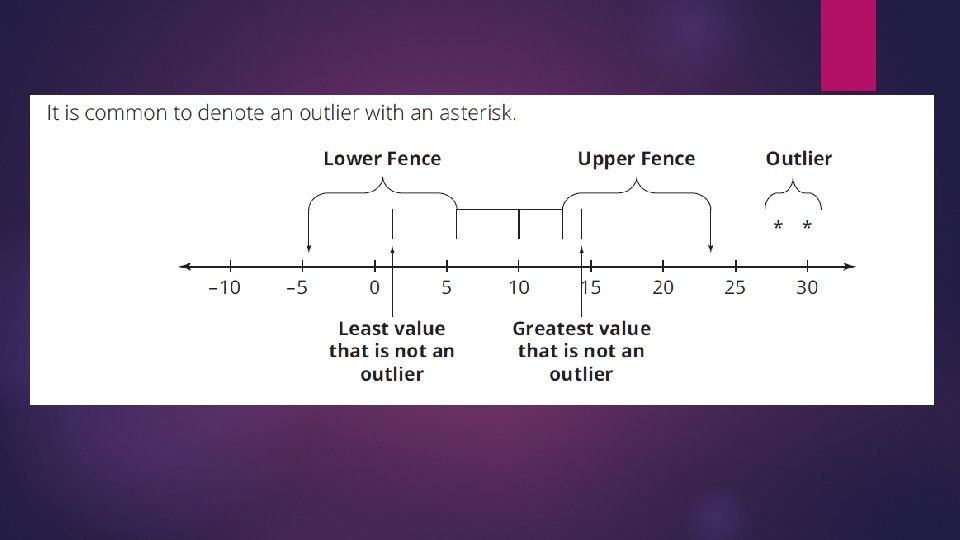
Using IQR and Outliers The shape of the data helps us find and identify outliers. An outlier is a data point that has an “extreme value” when compared with the rest of the data set (sticks out). IQR = Interquartile Range. Calculate by Q 3 – Q 1 Mathematically speaking, an outlier is defined as any point that falls 1. 5 times the IQR below the lower quartile (called “lower fence”) or 1. 5 times the IQR above the upper quartile (called “upper fence”) To calculate: Lower Fence = Q 1 – (1. 5· IQR) To calculate: Upper Fence = Q 3 + (1. 5· IQR)
Using IQR and Outliers Data: 37, 38, 40, 42, 42, 62 The median is: 40 Q 1: 38 Q 3: 42 IQR = Q 3 – Q 1= 42 – 38 = 4 The box plot looks like this: Find Lower Fence (lower limit on outliers) Q 1 – (1. 5)(IQR). 38 – (1. 5)(4) = 32 This means an outlier would be any number less than 32. The Upper Fence (upper limit on outliers) Q 3 + (1. 5)(IQR). 42 + (1. 5)(4) = 48 This means an outlier would be any number greater than 48.
Data: 37, 38, 40, 42, 42, 62 The outlier for this data set is 62. It surpasses the cut off of 48. When there is an outlier on one side of the data set, we can chop off the “whisker” at the limit and then record the outlier as data points. The final box plot would look like this. Calculate the mean of the data set. 41. 8 Calculate the mean of the data set without the outlier. 39. 6 Removing the outlier changes the mean significantly. Removing the outlier does not change the median significantly.
Going Fishing A fisherman records the length, in centimeters of 10 bass caught in a stream: 15 22 19 18 15 45 27 18 18 51 He wants to know the average length of a fish he can catch. Determine Mean: 248 ÷ 10 = 24. 8 cm Median: the mean and median of the data. 15 15 18 18 18 19 22 27 45 51 18. 5 cm
Going Fishing Are there any outliers? Divide 15 the data into quarters to find the IQR. 15 18 18 18 19 22 27 45 51 Q 3 IQR = 27 – 18 = 9 The lower fence on outliers is Q 1 – (1. 5)(IQR) 18 The – (1. 5)(9) = 4. 5 upper fence on outliers is Q 3 + (1. 5)(IQR) 27 + (1. 5)(9) = 40. 5 Any number less than 4. 5 or greater than 40. 5 are outliers. 45 and 51 are outliers.
Going Fishing Remove 15 the outliers and recalculate the mean and median. 15 18 18 18 19 22 27 Mean: 152 ÷ 8 = 19 cm Median: 18 cm With the outliers removed, the mean is now closer to the center of the data. The average length of a fish caught in this stream is ____.