Acid Deposition 1 Two Forms Wet Refers to


 ØSulfur in the atmosphere comes from burning bituminous coal,")
 ØMajor sources of nitrogen oxides include gasoline engines, power stations")

 (this is")
 and nitric acid")


- Slides: 38
Acid Deposition 1
Two Forms… Wet Refers to acid rain, fog, sleet, cloud vapor and snow. Dry Refers to acidic gases and particles.
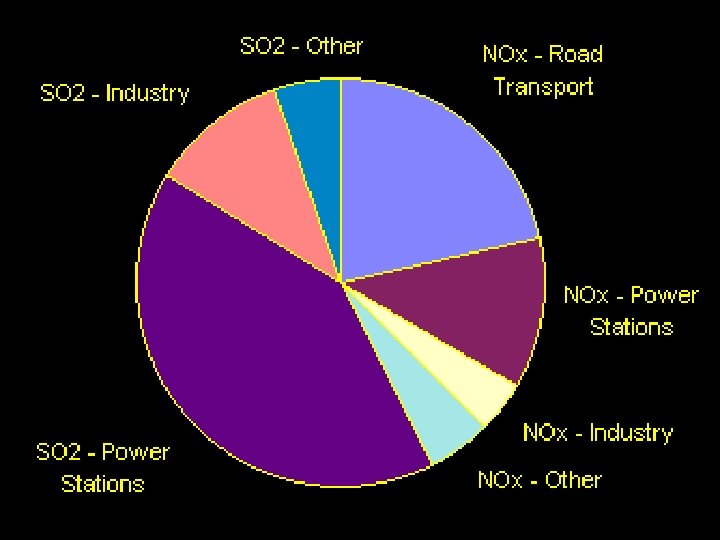
Two main contributors to acid deposition:
1. Sulfur Dioxide (SO 2) ØSulfur in the atmosphere comes from burning bituminous coal, smelting, and organic decay. Ø 90% is from human sources.
2. Nitrogen Oxides (NOx) ØMajor sources of nitrogen oxides include gasoline engines, power stations and industry.
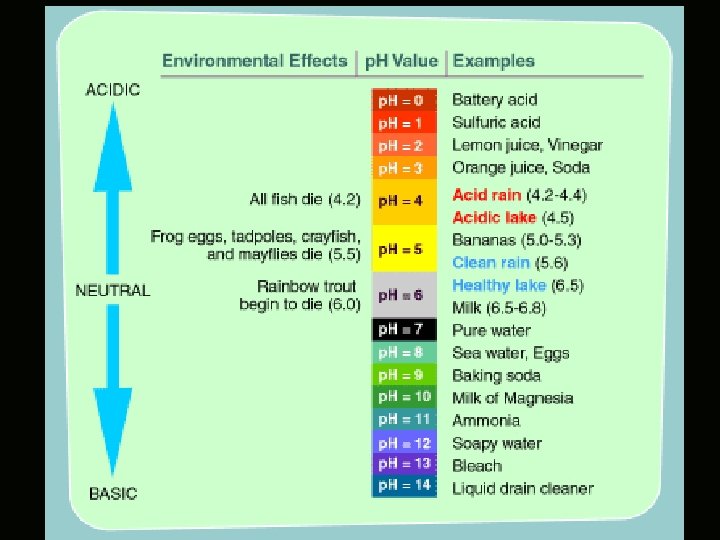
Acid Rain • • Normal rain is slightly acidic and has a p. H of about 5. 6 Any rainfall has a p. H value less than 5. 6 is defined as ACID RAIN
CO 2 + H 2 O H 2 CO 3 (carbonic acid) (this is why rain water is naturally slightly acidic) SO 2 + H 2 O H 2 SO 3 (sulfurous acid) NO 2 + H 2 O HNO 2 + HNO 3 (nitrous acid) (nitric acid) Chemical Rxns involved in the formation of acid rain.
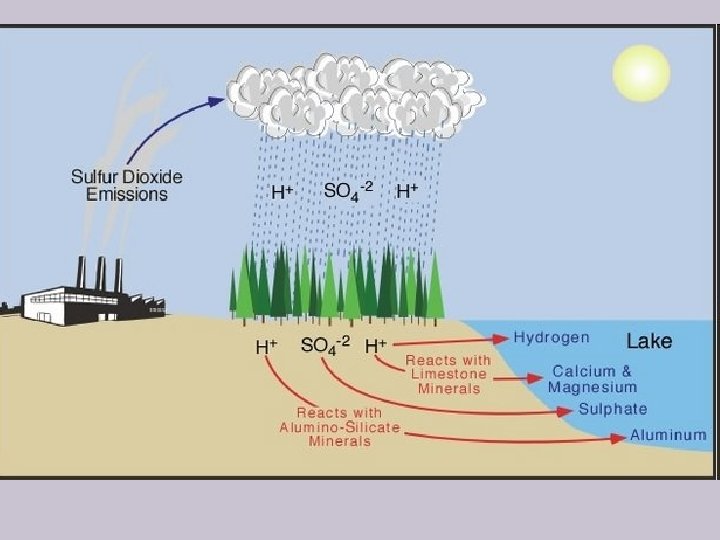
Acidic Precipitation Wind Transformation to sulfuric acid (H 2 SO 4) and nitric acid (HNO 3) Windborne ammonia gas and particles of cultivated soil partially neutralize acids and form dry sulfate and nitrate salts Sulfur dioxide (SO 2) Nitric oxide (NO) and NO Acid fog Ocean Dry acid deposition (sulfur dioxide gas and particles of sulfate and nitrate salts) Wet acid deposition (droplets of H 2 SO 4 and HNO 3 dissolved in rain and snow) Farm Lakes in deep soil high in limestone are buffered Lakes in shallow soil low in limestone become acidic
Effects on the Environment • Areas affected the most are where buffering capacity is low. Ex. Soils formed from granite Soils formed from limestone (Ca. CO 3) have a greater buffering capacity therefore acid rain does not have as large of an impact http: //cica. indiana. edu/projects/Biology/movies. html
Aquatic environments • In areas where buffering capacity is low, acid rain also releases aluminum from soils into lakes and streams Aluminum is highly toxic to many species of aquatic organisms. • At p. H 5, most fish eggs cannot hatch. Lower p. H levels can cause increased stress levels, lowering body weight and size. Some acid lakes have no fish. • • http: //cica. indiana. edu/projects/Biology/movies. html
Forests • • • Acid precipitation dissolves the nutrients and helpful minerals in the soil – washes them away before trees and other plants can use them to grow. Acid precipitation also causes the release of substances that are toxic to trees and plants, such as aluminum, into the soil. The leaves of plants are also damaged.
NC Mountains • Acid clouds greatly affect mountains in the eastern U. S. New England
Mongolia Germany
Flip through the next slides to see the progress that has been made
Manmade structures are also affected
Sulfate Ion Concentrations 1985 -2004 1985 1984 1986 http: //nadp. sws. uiuc. edu/amaps 2/ 19
Sulfate Ion Concentrations 1985 -2004 1986 20
Sulfate Ion Concentrations 1985 -2004 1986 1987 1988 21
Sulfate Ion Concentrations 1985 -2004 1987 1988 1989 22
Sulfate Ion Concentrations 1985 -2004 1988 1989 1990 23
Sulfate Ion Concentrations 1985 -2004 1989 1990 1991 24
Sulfate Ion Concentrations 1985 -2004 1990 1991 1992 25
Sulfate Ion Concentrations 1985 -2004 1991 1992 1993 26
Sulfate Ion Concentrations 1985 -2004 1992 1993 1994 27
Sulfate Ion Concentrations 1985 -2004 1993 1994 1995 28
Sulfate Ion Concentrations 1985 -2004 1995 1996 29
Sulfate Ion Concentrations 1985 -2004 1995 1996 1997 30
Sulfate Ion Concentrations 1985 -2004 1996 1997 1998 31
Sulfate Ion Concentrations 1985 -2004 1997 1998 1999 32
Sulfate Ion Concentrations 1985 -2004 1998 1999 2000 33
Sulfate Ion Concentrations 1985 -2004 1999 2000 2001 34
Sulfate Ion Concentrations 1985 -2004 2000 2001 2002 35
Sulfate Ion Concentrations 1985 -2004 2001 2002 2003 36
Sulfate Ion Concentrations 1985 -2004 2002 2003 2004 37
Sulfate Ion Concentrations 1985 -2004 2003 2004 2005 38