WHO 1998 TDI SCF 2001 TWI JECFA 2001


")
")
")

 8 7 2 1 M 2")
")

 calculation GCMS method Compound 1: concentration 1 Compound 2: concentration 2")
 EU-Limit")
 analyzed")
- Slides: 39
단위체중당 섭취허용량 비발암 영향 일일 섭취허용량으로 환산결과 WHO 1998 TDI SCF 2001 TWI JECFA 2001 PTMI 1 -4 14 70 pg/kg BW/day pg/kg BW/week pg/kg BW/month (1 -4) (2. 3) SCF: EC Scientific Committee on Food JECFA: WHO/FAO Joint Expert Committee on Food Additives 발암영향 USEPA 2000 추정 발암위해도: 1 x 10 -3 risk/pg TEQ/kg BW/day 1 x 10 -6 risk 10 -3 pg TEQ/kg BW/day
ak ov Sl h ze c C y ia ga r un H ro at C ay or w N lic ne kr ai U ub ep R d an ub lic ep R nl Fi ai n an y er m G Sp s rla nd 2002 WHO TEQ (pg/g fat) 1993 et he 1988 N 모유 중 다이옥신류의 변화 추세 WHO 인체모유연구 결과 40 30 20 10 0 Van Leeuwen & Malisch, DIOXIN 2002
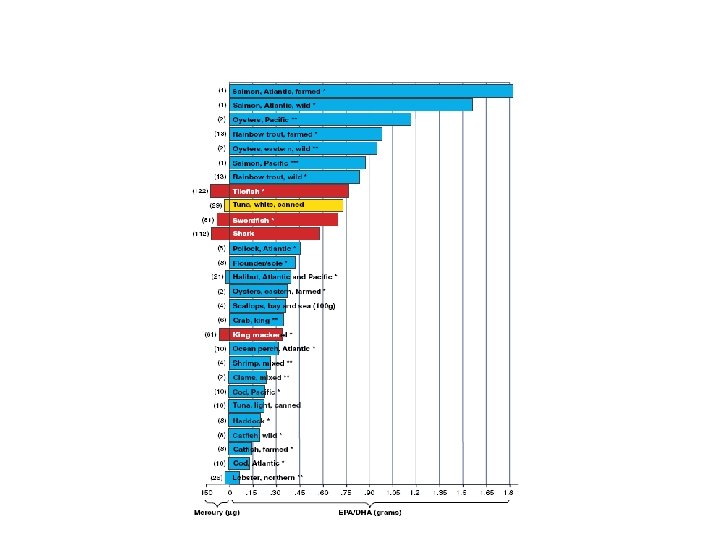
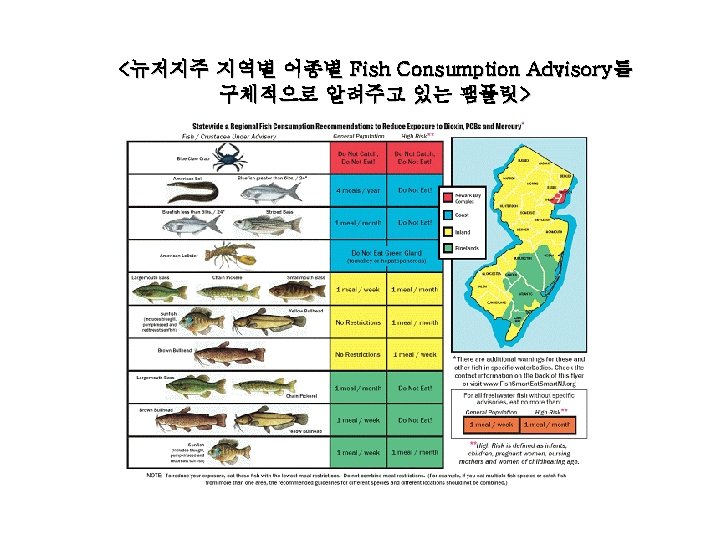
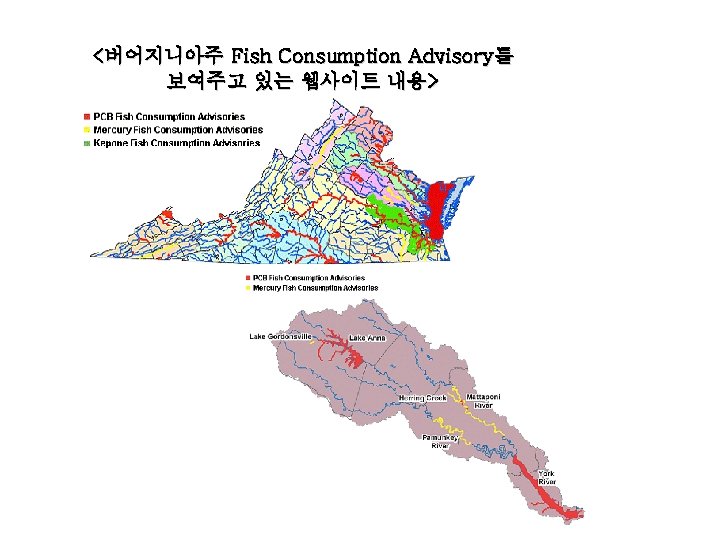
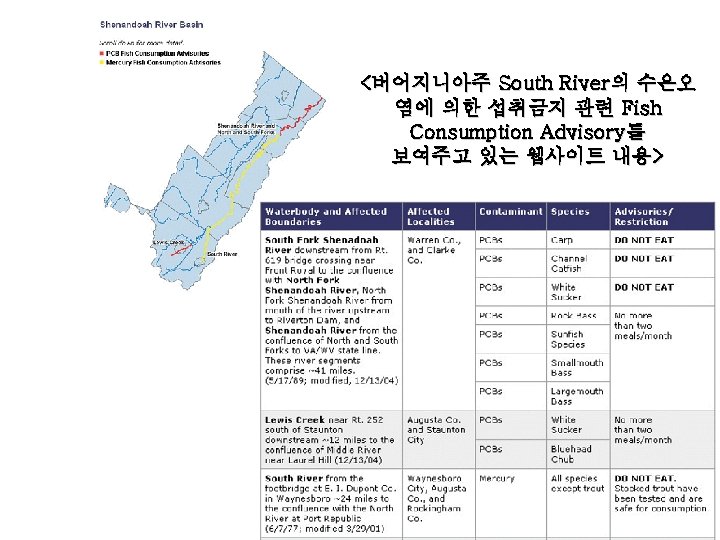
Fish Consumption Advisories for Mercury (USEPA, 2004)
Number of Safe Eating Guidelines by State (USEPA, 2004)
Trends of Number of Fish Consumption Advisories (USEPA, 2004)
Action limit Virtual limit Good relation total TEQ and CALUX-response
Ratio Bioassay/GC-MS Bioanalysis 간의 비교 (일본의 연구 사례) 8 7 2 1 M 2 M 3 M 4 M 5 M 6 Reporter Gene Assay Ah. R-Immunoassay Ah. R PCR Assay Ah. R-based Bioassay M 7 M 8 M 9 M 10 M 11 Dioxins-Immunoassay M 1 – M 5 만 스크리닝 목적에 적절함
다이옥신 분석을 위한 다양한 방법들간의 효율성 비교 구분 Reporter Gene Assay (Method 1 -4) Ah. R -based Bioassay Ah. R-Immunoassay (Mehtod 5) Ah. R PCR Assay (Method 6) Dioxin-Immunoassay (Method 7 -11) HR GC-MS method 시간 (day/sample) 비용 (원/시료) 3 -5 350, 000 – 600, 000 3 450, 000 1 400, 000 1 -3 360, 000 – 500, 000 10 - 20 2, 000
Procedure of DR-CALUX® dioxin screening
Toxic Equivalent (TEQ) calculation GCMS method Compound 1: concentration 1 Compound 2: concentration 2 Compound 3: concentration 3 concentration n Compound n: Total dioxin toxicity of mixture: x TEF 1 = x TEF 2 = x TEF 3 = x TEFn = CALUX® method Direct measurement of TEQ value of sample DR CALUX® method has been validated and complies fully with the regulatory requirements for dioxins and dioxinlike compounds in: - food, feed, and raw materials (EU 2001) - sediments river, marine (Dutch Government 2002) exhaust gas, fly ash, residue (Japanese Min. Environm. 2004) - river mud and lake sediment (Japanese MLIT 2004). TEQ 1 TEQ 2 TEQ 3 TEQn Sum. TEQ +
Performance of DR CALUX® for various food and feeding stuffs Foodstuffs Weight (g) EU-Limit TEQ pg/g lipid LOQ Repeatability (%) Reproducibility (%) Oils/fats plant origin 7. 0 0. 75 0. 14 18 32 Animal oils/fats 5. 0 1. 0 0. 20 16 13 Milk/Milk products 2 -50 3 0. 60 11 16 Egg 17 3 0. 60 10 21 Fish/Fishproducts 9 4 0. 11 13 25 Fish oil 3. 5 2 0. 28 26 14 Feed plant origin* 9 0. 75 0. 11 11 -19 13 -26 Feedingstuff for fish 9 2. 25 0. 11 14 27 Fish/Fish products 9 1. 25 0. 11 13 25 Fish oil 1 6 1. 0 26 14 Feedingstuffs * ng TEQ/kg
Distribution of DR CALUX® TEQ levels in food samples (n=490) analyzed