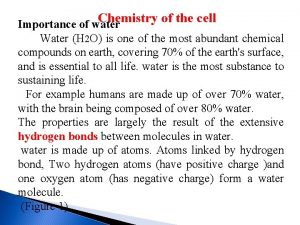
Water 1 Relations Outline Water functions 2 Water


- Slides: 51

@ Water @ 1. Relations. Outline. Water functions. @ 2. Water properties. @ 3. Water potential. @ 4. Water movement in the soil. @ 5. Water movement in the plant. @ 6. Precipitation. @ 7. Excessive water in the soil. @ 8. Water deficit.

1. Water Functions. @ Constituent: u 80 -90% fresh weight herbaceous plants. u >50% woody plants. @ Solvent/Transport. @ Substrate/environment for biochemical reactions. @ Hydration of organic molecules. @ Turgor pressure. @ Temperature regulation.

2. Water Properties. @ Attributed u Specific u Latent to Hydrogen bonding. Heat: 4. 184 J g-1 heat of vaporization: 2442 J g-1 at 20°C u Latent heat of fusion: 334 J g-1 u Cohesion. u Adhesion. u Surface tension. u Tensile strength. @ Transparency, incompressibility, density.

3. Water Potential. Definition. @ Essential to understand water flow in the system soil--plant--atmosphere. @ Useful for evaluating plant water status. @ Quantitative measure of effect of water stress. @ Definitions: u Energy: Capacity to do work. u Free energy: Portion of a system’s energy that can perform work when temperature is uniform throughout the system.

3. Water Potential. Definition. @ Water Potential ( w): A measure of the free energy of water: u Symbol: Greek letter psi ( ) u Units: bar or Pascal (1 bar = 0. 1 MPa). u w of pure water is zero (by definition). u Solutes and other forces decrease water potential ( w <0) u For living organisms, w will be negative.

3. Water Potential. -3 -2 -1 0 1 2 3

3. Water Potential. Magnitude. w = 0 MPa Pure Water w = 0 to -1 MPa Plant/Cell in good condition w = -1 to -2 MPa Plant/Cell under mild water stress w < -2 MPa Plant/Cell under water stress

3. Water Potential. Magnitude. @ Air at 99% RH = - 1. 4 MPa @ Air at 95% RH = - 7. 0 MPa @ Air at 80% RH = - 30 MPa @ Air at 10% RH = - 310. 8 MPa @ Sea water = @ Desert - 2. 2 MPa soils can get down to - 6 MPa

3. Water Potential. Flux. Water will flow from sites of high w (close to zero) to sites of low w (more negative): -0. 3 MPa -2 MPa -1 MPa -30 MPa Water moves from a wet soil, through the plant, and evaporates (via transpiration) into a dry atmosphere. Soil Root Stem Leaf Air

3. Water Potential. -3 -2 -1 0 1 2 3

3. Water Potential. Components. Potential ( m): Represents the effect of insoluble materials (colloids or cell walls). It is negative. @ Matric Potential ( s): Represents the effect of solutes. It is negative. @ Osmotic Potential ( p): Represents the effect of hydrostatic pressure. It is positive. @ Pressure Potential ( g): Represents the effect of gravity. It is negative. @ Gravitational

3. Water Potential. Components. w plant = s + p + m w soil = s + m

3. Water Potential. Example. w plant = s + p + m - 0. 8 MPa = - 0. 9 + 0. 3 - 0. 2 w soil = s + m - 0. 6 MPa = - 0. 2 - 0. 4

4. Water movement in the soil. @ Water content and rate of water movement in the soil depends mainly on the soil type. @ Processes: u Infiltration: Water penetration through the soil surface. (Runoff or evaporation affect). u Permeability: Water diffusion among soil particles. u Percolation: Movement of excess water deeper into the profile due to gravity.

4. Water movement in the soil. @ Classification u Hydration of water in the soil: water: That chemically bound to soil particles. Not available to plants. u Hygroscopic water: That tightly held by the soil (>3. 1 MPa of suction). Not available. u Capillary water: That filling soil micropores. Most of it is available. u Gravitational water: That moving in the soil by gravity through macropores. Available.

4. Water movement in the soil. @ Soil moisture constants: u Field Capacity: Moisture left in soil after gravity has drained macropores; micropores held water at 0. 03 MPa of suction. u Permanent Wilting Point: Moisture content at which a plant wilts and does not recover, even when under a humid environment. Water is being held at ca. 1. 5 MPa. u Easily Available Water: FC - PWP

4. Water movement in the soil. PWP Hygroscopic water SP FC Capillary MPa water Gravitational water 3. 1 1. 5 Non-available 0. 03 Available 0 Excess

5. Water movement in the plant. @ To the root surface: u Soil to root: Diffusion and bulk flow. u Roots growing into moist soil. @ Inside the plant: u Osmosis: Explains water movement across membranes. u Diffusion: Effective at cellular dimensions. u Bulk flow: Important for long distance transport via xylem.

5. Water movement in the plant.

5. Water movement in the plant. Water movement in the end is a result of differences in water potential.

5. Water movement in the plant. @ Transpiration: The loss of water from plants in the form of vapor. u Important for water flow, solute transport and cooling. u Occurs through stomata: F Subsidiary Cells. F Guard Cells. u Guard cells turgid then stoma is open. u Guard cells flaccid then stoma is closed.

5. Water movement in the plant.

5. Water movement in the plant. r. H O 2 = rs + r a

5. Water movement in the plant. w SOIL w ROOT w w LEAF (Slatyer, 1967)

5. Water movement in the plant. Safflower EVT (mm/d) 80% LAI Stern, 1965

Green LAI EVT/open pan evaporation 5. Water movement in the plant. Days after planting Shaw and Laing, 1966

5. Water movement in the plant. @ Factors determining plant water status: u Soil: F Texture/structure. F w in the soil (moisture content). u Plant: F Depth and spread of root system. F Root permeability. F Stomatal regulation. F Species (LAI, Ps. Syndrome, etc. )

5. Water movement in the plant. u Evaporative F Solar demand of the atmosphere: radiation. F Temperature. F Relative humidity. F Wind.

5. Water movement in the plant. Water Use Efficiency: Total dry matter produced by plants per unit of water used: WUE = D W Water Requirement: Amount of water used per unit of dry matter produced. WR = W D

5. Water movement in the plant. Monocotyledons Dicotyledons Species WR Sorghum 304 Pigweed 283 Corn 349 Thistle 314 Barley 518 Cotton 568 Wheat 557 Lambsquarter 658 Oats 583 Alfalfa 844 (Black et al. , 1969)

6. Precipitation. @ Types of rainfall: u Convective u Orographic u Cyclonic @ Characteristics: u Total annual rainfall u Distribution u Intensity u Relation with evapotranspiration

6. Precipitation. Ames (30 years).

7. Excess water in the soil. @ Reasons: u Heavy rains (high intensity). u Flooding. u Poor soil drainage. @ Effects: u On absorption and transport. u On oxygen availability, then respiration. F Aggravated by high T°

7. Excess water in the soil. u Activation of fermentation: F Pyruvate to ethanol or lactate. F 2 ATP vs. 36 ATP u Anoxia. u Growth is depressed. u Leaf senescence. u Yields are reduced. u Plant death is possible.

7. Excess water in the soil. @ Adaptations: u Fermentation. u Aerenchyma. u Overwintering.

8. Water deficit. Generalities. @ Drought: u. A meteorological phenomenon: deficiency of precipitation. Usually associated with: F High temperatures. F High irradiance. F Low relative humidity. @ Water Stress: Situation in which a process or reaction is slowed, relative to a control plant, due to a limitation of water.

8. Water deficit. Effects. Drought effects f(Duration, R. H. , T°, soil, genotype, stage)

-2 MPa -1 MPa 0 MPa Cell growth Protein synthesis Stomatal opening Photosynthesis Respiration Pro/sugar accum. Transport Hsiao and Acevedo, 1974

Photosynthesis Respiration Enlargement 75 50 25 -1. 6 -1. 2 -0. 8 -0. 4 Water Potential (MPa) % of maximum 8. Water deficit. Effects.

Drought resistance 8. Water deficit. Effects. Time Drought resistance expressed as a reduction in yield

Leaf Stem Root 0. 9 Silks 0. 6 0. 3 -1. 6 -1. 2 -0. 8 -0. 4 Water Potential (MPa) Rate of elongation (ums-1) 8. Water deficit. Effects. Westgate and Boyer (1985)

Grain yield (% of control) 100 75 50 25 JULY AUGUST Claassen and Shaw (1970)

% of control 100 75 50 25 Grain No. Grain Wt. JULY AUGUST Claassen and Shaw (1970)

Stalk dry weight (% of control) 100 75 50 25 Stalk JULY AUGUST Claassen and Shaw (1970)

100 (% of control) 80 60 40 20 Seed yield Pod No. JULY Seeds/pod Seed Wt. AUGUST Shaw and Laing (1966)

8. Water deficit. Responses. @ Momentary u Stop responses. or decrease shoot growth. u Expand roots. u Osmotic adjustment. u Stomatal closure. u Organ abscission. u Processes are affected during sequence.

8. Water deficit. Osmotic adjustment. @ Changes in the solute content of cells (not caused by water loss) by which w can be decreased without a decrease in turgor. u Under cell’s control. u Fast (3 -4 h). u s is decreased by 0. 2 to 0. 8 MPa. @ When? : u Under slow water stress development (some spp).

8. Water deficit. Osmotic adjustment. @ Why? : a high P in the cell. u Maintain enzymes functioning. u Keep @ How? u a) Accumulation of solutes (Glycerol, proline, mannitol). u b) Uptake inorganic solutes/salts; store in vacuole, use later. u c) Slow metabolism.

8. Water deficit. Osmotic adjustment. w plant = osmotic + pressure + matric - 1. 4 = - 2. 9 + 1. 5 w plant = osmotic + pressure + matric - 3. 1 = - 4. 6 + 1. 5

8. Water deficit. Adaptations. @ Evolutionary u Ephemeral adaptations: cycle. u Membrane thermoestability. u Brightness and reflective characteristics. u Decreased leaf area. u Large radical system. u Leaf movement. u Waxy, succulent leaves. u C 4, CAM.

Definitions. Specific Heat: Energy required to raise T° of a unit of mass by 1 °C from 14. 5 to 15. 5 °C @ Latent Heat of Vaporization: Energy required to move one molecule from the liquid to the vapor phase at a constant temperature. @ Latent Heat of Fusion: Energy required to melt 1 gram of ice at 0 °C @
 Employee relations in public relations
 Water and water and water water
 Topic sentence outline example
 Function rules examples
 Analyzing graphs of functions and relations
 Domain and range of tan function
 Relation vs relationship
 2-2 practice linearity and symmetry
 Inverse functions notes
 6-7 inverse relations and functions
 Unit 5 lesson 6 formalizing relations and functions
 4-2 inverses of relations and functions
 4-2 inverses of relations and functions
 1-2 analyzing graphs of functions and relations
 4-2 practice b inverses of relations and functions
 Characteristics of relations and functions
 1-2 analyzing graphs of functions and relations
 Find two functions defined implicitly by the given relation
 Relation vs function
 Lesson 4-6 formalizing relations and functions answers
 1-7 inverse relations and functions
 1-7 inverse relations and functions
 1-6 relations and functions answers
 Characteristics of relations and functions
 Topic 1 relations and functions
 Linear relations and functions
 Inverse relations and functions
 Water relations in plant cells worksheet answers
 Absolute value functions as piecewise functions
 How to solve evaluating functions
 Evaluating functions and operations on functions
 Derivational relations stage
 Visual spatial relations
 Mbti top
 Finlem
 Clients often criticize public relations firms for
 Action assembly theory public relations
 Object relations theory ppt
 Nadir of race relations
 Thyrohyoid membrane
 Federal service labor management relations statute
 Lethal bac levels
 Walt disney company investor relations
 Telenor investor relations
 Free energy
 Derivational relations stage
 Derivational relations stage
 Solve for a
 Linear homogeneous recurrence relation
 Social thinking and social influence in psychology
 Normal shock wave
 Semantic primes


