Using the SunyaevZeldovich Array in Detailed Studies of

, Tom Culverhouse, Chris Greer, Ryan")

")
 The ICM (cluster gas) is optically thin,")
 Effect image from L. Van Speybroeck. The SZ")

 We built an 8 -element interferometer in the Owens Valley,")


 Profile This is a generalization of the NFW profile,")


")
")


- Slides: 26
Using the Sunyaev-Zel'dovich Array in Detailed Studies of Galaxy Clusters 3 rd Biennial Leopoldina Conference Dark Energy 9 th October 2008 Tony Mroczkowski (Columbia / UPenn) with the Sunyaev-Zel'dovich Array (SZA) Collaboration and Daisuke Nagai (Yale)
The SZA Collaboration Chicago: John Carlstrom (P. I. ), Tom Culverhouse, Chris Greer, Ryan Hennessy, Dan Marrone, Erik Leitch, Mike Loh, Clem Pryke, Megan Roscioli, Matthew Sharp Columbia: Amber Miller, Tony Mroczkowski, Stephen Muchovej Caltech (OVRO): David Hawkins, James Lamb, David Woody NASA/MSFC: Marshall Joy U. Alabama: Esra Bulbul, Max Bonamente, Nicole Hasler
Overview Why we study galaxy clusters The tools we choose for studying cluster gas — SZ+X-ray observations The Sunyaev-Zel'dovich Array An improved SZ model to fit current SZ observations. Upcoming results to expect from the SZA
Why study galaxy clusters? Provide independent, complementary tests of cosmology. Large, statistically-complete samples (>100) can be used to measure the growth of structure. Smaller samples (~50) can be used to probe the expansion of the universe (e. g. recent gas fraction studies, such as the Xray only studies in Allen et al. 2007 and Vikhlinin et al. 2008). Small samples can also be used to determine the Hubble constant as a function of redshift by combining X-ray+SZ data (e. g. Bonamente et al. 2004), independent of CMB and SNe results. To maximize the utility of clusters, we must relate their observable properties of clusters to their total masses.
Tools to Probe the Intracluster Medium (ICM) The ICM (cluster gas) is optically thin, so we can simply perform the line of sight integral of the plasma's emission. X-ray surface brightness SX is strongly dependent on electron density, ne(r). The X-ray emissivity, �ee is weakly dependent on temperature (as above).
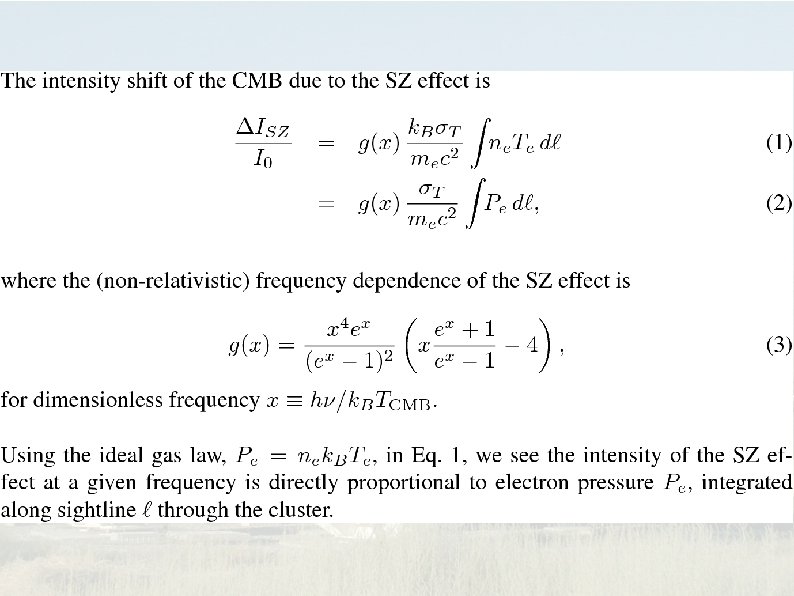
A complementary tool: The Sunyaev-Zel'dovich (SZ) Effect image from L. Van Speybroeck. The SZ effect is due to inverse Compton scattering of CMB photons by electrons in the ICM. ~1% of CMB photons are scattered to higher energies, leaving an intensity decrement at our observing frequencies, 30 and 90 GHz. The thermal SZ effect is a measure of electron pressure integrated along the line of sight (as shown in next slide).
Utility of SZ Cluster Studies The SZ effect can be measured from the ground, by relatively inexpensive radio telescopes. SZ intensity is redshift independent. The SZ effect provides a measurable quantity, Yint, which is the integral of line of sight Compton y within some radius on the sky. Yint scales robustly with cluster total mass (e. g. Motl et al. 2005, Nagai 2006, Reid & Spergel 2006). This is exactly what we want when performing cosmology with a large sample of clusters. A radio interferometer measures the Fourier transform of Compton y, which scales as Yint within each Fourier mode probed by a pair of antennae. This makes interferometers ideal instruments for constraining Yint.
The Sunyaev-Zel'dovich Array (SZA) We built an 8 -element interferometer in the Owens Valley, a desert in eastern California (USA). The SZA's compact configuration allows it to probe short u, vspacings, corresponding to ~1 -6' on the sky (where u and v are the Fourier conjugates of spatial coordinates x and y). Each antenna has a 26 -36 GHz (“ 30 GHz”) and an 85 -115 GHz (“ 90 GHz”) wideband receiver, selected by the tertiary mirror. Wide correlator (8 -GHz) bandwidth allows fast detection of clusters in targeted observations. The interferometric imaging capabilities of the SZA make it a good complement to current SZ survey experiments, such as the South Pole Telescope (SPT), the Atacama Cosmology Telescope (ACT), and the Atacama Pathfinder EXperiment (APEX).
SZA configuration 6 antennae form the 15 baselines of the compact inner array, probing large arcminute scales 2 antennae form 13 more long baselines, used to constrain the fluxes of unresolved radio sources in the cluster field (i. e. “point sources”).
SZA 30+90 GHz combined u, v-space coverage
Some photos of the SZA
Results to expect soon from the SZA Collaboration: The SZA has performed a cluster survey at 30 GHz, covering ~ 5. 5 deg 2. Look for results in S. Muchovej et al. in 1 -2 months. The SZA has also performed a 1 -5 arcminute-scale CMB angular power spectrum measurement (l ~ 4000, competitive with BIMA and CBI). Look for M. Sharp et al. later this year. Each of these measurements will place new and independent constraints on s 8. The SZA continues to perform detailed cluster studies, the goals of which I will describe.
Modeling the SZE signal With interferometric SZ data in hand, we fit models to it in order to extract meaningful, physical parameters. These models fill in information on the scales we do not probe. Since the SZ signal is directly proportional to electron pressure, we chose to model the cluster pressure profile. Most previous SZ+X-ray studies have relied on the isothermal �-model. However, we know clusters are not isothermal over a broad radial extent. We have recently demonstrated the utility of a new electron pressure profile in fitting SZ observations (see http: //arxiv. org/abs/0809. 5077). This profile, proposed by Nagai et al. 2007, is motivated by fits to the pressure profiles using detailed X-ray studies (from Vikhlinin et al. 2006) and high-resolution cluster simulations (Kravtsov et al. 2005).
The Nagai '07 (N 07) Profile This is a generalization of the NFW profile, a 2 -parameter profile used to fit DM halos of simulated clusters. g describes the inner slope, a describes intermediate slopes, and b describes the outer slope of the cluster pressure profile. N 07 found rs ~ r 500/C 500 for concentration factors 1. 3 -1. 8. We first used the fixed slopes (�, �, �)=(1. 3, 4. 3, 0. 7) from the original N 07 paper. We also tested (�, �, �)=(0. 9, 5. 0, 0. 4), the slopes in a new erratum to N 07, and found no significant change. P 0 and rs are the parameters we vary. This provides an extra degree of freedom over the isothermal b-model used in many previous SZ studies.
Combining the N 07 Pressure Profile for the SZ fit with X-ray imaging Assuming a popular LCDM cosmology (�M=0. 3, ��=0. 7, h=0. 7), we tested the joint-fit of SZ+X-ray imaging observations without using X-ray spectroscopic information. X-ray imaging is used here to determine density. The pressure fit is driven by SZ data. Temperature is derived from the simultaneously-fit density and pressure. We use a Markov chain Monte Carlo (MCMC) process to fit the SZ+X-ray data. This jointly maximizes the likelihood of the fit to both types of data, as well as exploring the probability density distribution of the model fits.
The X-ray density profile 30 -GHz SZA observations are sensitive to clusters on large scales. Typical (10 -20 ks) X-ray observations of intermediate and high redshift clusters lack the ability to constrain detailed core structure. We are interested in the bulk properties of clusters (e. g. at overdensities D=2500 and D=500, within which the average density is D times the critical density of the universe). We chose the density profile used by Vikhlinin et al. 2006, but stripped the components used in fitting the cluster cores. We call this the “Simplified Vikhlinin Model, ” or SVM:
Testing the N 07+SVM profiles We chose 3 clusters, well-studied in the X-ray, on which to test these profiles: Abell 1835 (z=0. 25), Abell 1914 (z=0. 17), and CL J 1226. 9+3332 (z=0. 89). All 3 clusters have exceptional Chandra X-ray data. We compared our results to independent, detailed X-ray analyses, performed by Ben Maughan, who fit the clusters using the Vikhlinin et al. '06 temperature and density profiles. The independent X-ray spectroscopic analysis of the highredshift cluster CL 1226 additionally used XMM-Newton data, yielding much tighter constraints than typically available for clusters at high redshift.
SZA cluster observations Contours are 2 -s. Integration times were 18. 5 and 11. 5 hours, respectively.
Figure from Mroczkowski et al. 2008 (http: //arxiv. org/abs/0809. 5077)
Derived Total Masses Figure from Mroczkowski et al. 2008 (http: //arxiv. org/abs/0809. 5077)
Conclusions The new pressure profile fits well. When combined with X-ray, it provides an independent measure cluster radial temperature profiles. Since the intensity of the SZ effect is redshift-independent, and high-significance X-ray spectra are difficult/expensive to obtain, this method could prove a valuable, complementary tool. Accurate modeling of cluster properties will reduce systematic biases in cosmological tests employing clusters. By include spectroscopic X-ray information, we can now use this model to constrain fgas(z) and H(z).
Ongoing projects utilizing these new models to fit targeted observations of clusters: The N 07 profile is being used to determine SZ cluster scaling relations (e. g. SZ flux versus Mtot from X-ray and gravitational lensing). Look for Marrone et al. in early 2009. Detailed joint SZ+X-ray fitting of targeted observations of clusters will lead to better determinations of the Hubble constant and the hot gas fraction (without assuming we know angular diameter distance to the cluster). Look for Hasler et al. in 2009. Constrain Helium sedimentation in the cores of clusters (ala Markevitch 2007, Peng & Nagai 2008). Look for Bulbul et al. in 2009.
end
Why should pressure follow a profile like the dark matter halo? Aside from clusters that have undergone recent mergers, they are usually close to hydrostatic equilibrium – the force of pressure equals the force of gravity. Dark matter dominates the gravitational potential, and resides in self-similar halos. Inhomogeneities in pressure propagate at the speed of sound, so they do not last long. The integral of pressure is thermal energy. Thermal energy closely tracks the potential energy of the cluster (to the extent that HSE is dominated by thermal pressure).
Modeling the SZE+X-ray data Fit the X-ray image in image space Fit the interferometric data in Fourier space The profiles we vary are the N 07 pressure and SVM density profiles. Te(r) is derived from the fit Pe(r) and ne(r), and is used to model the X-ray surface brightness. Compare these to independent Xray-only analysis, as well as joint fits of an isothermal �- model