Using color and shading Trevor A Branch tbranchuw

Using color and shading Trevor A. Branch tbranch@uw. edu Beautiful graphics in R, FISH 554 SAFS, University of Washington @Trevor. ABranch
")
Freshwater fisheries are a critical food source for many poor nations Holtgrieve GW (2020) Unpublished
 Nature 488: 615 -620; http: //www. oceanhealthindex. org/")
Halpern et al. (2012) Nature 488: 615 -620; http: //www. oceanhealthindex. org/

https: //www. businessinsider. com/where-most-threatened-mammals-live-map-2015 -4

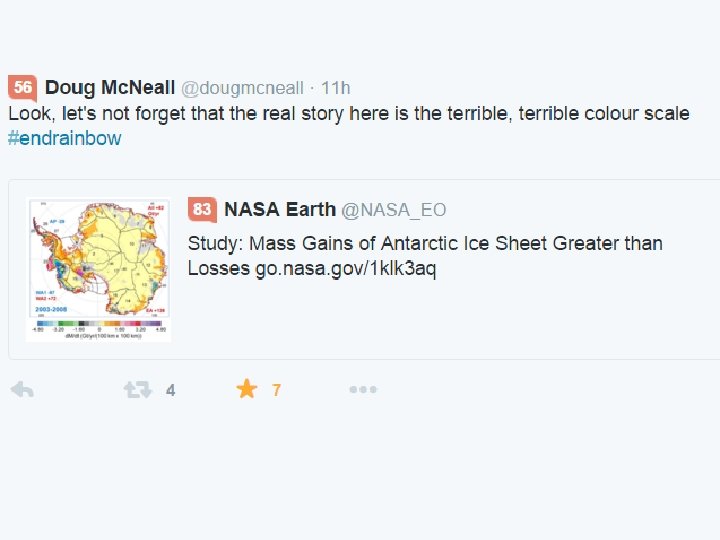
The ordering of colors has no meaning: you can order the gray scales on the left easily, but there is no inherent order to the colors on the right. Skau D (2012) Dear NASA: no more rainbow color scales, please. Blog post: https: //visual. ly/blog/rainbow-color-scales/

Readings • Cindy Brewer profile: background about the most popular inventor of color palettes • Clarkson 2010: in-depth guide to how colors work in R • Borland & Taylor 2007: rainbow colors are harmful • Few 2008: practical rules for colors • Stowers Institute Color. Chart: indispensable lookup guide when you want a particular color

Age structure of college enrollment Tufte: “this may well be the worst graphic ever to find its way into print” Tufte: “If a picture is composed of two or more large, enclosed areas in different colors, then the picture falls apart. Unity will be maintained, however, if the colors of one area are repeatedly intermingled in the other. . ” American Education magazine, 1970 s Tufte (2001) The visual display of quantitative information, p. 118

Tufte: “Don’t use up the entire color spectrum, or even all of a hue’s levels. Particularly avoid… the color spectrum of the rainbow… one needs to constantly remind oneself which color means high vs. low values. ” Tufte (1997) Visual explanations, p. 76 -77

Tufte: “Placing of bright colors mixed with white produces unpleasant effects. Instead use colors found in nature, especially those on the lighter side. ” Tufte (1997) Visual explanations, p. 76 -77
 Dear NASA: no")
Divisions between hues create edges where none exist Skau D (2012) Dear NASA: no more rainbow color scales, please. Blog post: https: //visual. ly/blog/rainbow-color-scales/ Borland D, Taylor III RM (2007) Rainbow color map (still) considered harmful. IEEE Computer Graphics and Applications March/April: 14 -17
 Dear NASA:")
Detail is actually harder to see in rainbow colors Skau D (2012) Dear NASA: no more rainbow color scales, please. Blog post: https: //visual. ly/blog/rainbow-color-scales/ Borland D, Taylor III RM (2007) Rainbow color map (still) considered harmful. IEEE Computer Graphics and Applications March/April: 14 -17

Original Revised Tufte “Three A’s are filled and seven are not, creating two distinct —and meaningless— visual clusters” The grids and outlines are at the same visual level… instead use the smallest effective difference to distinguish between background lines and foreground letters. Tufte (1997) Visual Explanations, p. 113

Tufte: “Color spots against a light gray or muted field highlight and italicize data” “Note the effectiveness and elegance of small spots of intense, saturated color for carrying information. ” Bathymetry and oceanographic fronts Branch et al. (2007) Mammal Review 37: 116 -175

Online survey by xkcd with randomly selected RGB colors, asking users to name the colors. http: //blog. xkcd. com/2010/05/03/ color-survey-results/

http: //thedoghousediaries. com/1406 http: //blog. xkcd. com/2010/05/03/color-survey-results/ People do differ greatly in color perception… but not much across genders

Color blindness: Ishihara test 25 is obvious Nothing Can see 56 but does not pop out http: //www. toledo-bend. com/colorblind/Ishihara. asp

Palettes that are red + green “red-green” Deuteranomaly = difficulty perceiving green Protanomaly = difficulty perceiving red Palettes that are blue and green “blue-yellow” Tritanomaly = difficulty perceiving blue (very rare) Prevalence 8% of males and 0. 5% of females have one of these conditions, almost all (99%) from red-green color blindness Wilke CO (2019) Fundamentals of data visualization. O’Reilly Press

Color. Brewer’s Pi. YG palette works for all vision types R library 'dichromat' has a function dichromat() that will display colors as seen by people with color blindness Wilke CO (2019) Fundamentals of data visualization. O’Reilly Press

No more rainbow color scales, please Color blind people cannot see them (protanopia is red-green color blindness) Skau D (2012) Dear NASA: no more rainbow color scales, please. Blog post: https: //visual. ly/blog/rainbow-color-scales/

Nike uniforms in the NFL https: //www. youtube. com/watch? v= jn 9 P 9 Gbdh. IY

Finding colors in R The 657 named colors in R are described in the Stowers Institute R color guide. Identical: colors()[9] 'aquamarine 1' '#7 FFFD 4' Also, gray(0) is black and gray(1) is white, with shades of gray between 0 and 1. http: //research. stowers-institute. org/efg/R/Color/Chart/Color. Chart. pdf
 heat. colors(50) terrain. colors(50) topo. colors(50) cm. colors(50) gray. colors(50) Create vectors")
Palettes rainbow(50) heat. colors(50) terrain. colors(50) topo. colors(50) cm. colors(50) gray. colors(50) Create vectors of 50 evenly spaced colors from the chosen palette

Cindy Brewer R package “RColor. Brewer”: sequential colors Photo: http: //www. wired. com/2014/10/cindy-brewer-map-design/ http: //colorbrewer 2. org/
")
Color. Brewer: qualitative color schemes (each object is different, no relation between objects)

Too many colors It is not possible to distinguish more than 5 – 9 colors Wilke CO (2019) Fundamentals of data visualization. O’Reilly Press

Qualitative color scheme Instead, simplify the plot into groupings, and label individual points that are outliers, or of interest to the reader Wilke CO (2019) Fundamentals of data visualization. O’Reilly Press
")
Color. Brewer: diverging color schemes (when negative and positive mean different things)

Diverging color scheme red = female, blue = male Branch TA & Monnahan CC (in prep. ) Sex ratios in blue whales
")
Color. Brewer: sequential color schemes (increasing numbers imply intensification)

Sequential color theme Tufte: “Using a single hue with variations in intensity allows instant interpretation” Chlorophyll concentrations Branch et al. (2007) Mammal Review 37: 116 -175

Change in ice mass in the Antarctic http: //climate. nasa. gov/news/2361/
 Coral microbiome")
Critique the colors used in this figure Osman EO et al. (2020) Coral microbiome composition along the northern Red Sea. Microbiome 8: 8 https: //doi. org/10. 1186/s 40168 -019 -0776 -5

R code demonstration

Exercise 1: overplotting Read in the data from the file 'bivariate. csv'. Create a default plot like the on the right. Then experiment with shape, size of points, and transparency (alpha) to find the hidden “Easter egg”. Also experiment with geom_hex() to find a good representation showing density. Data creation: Trevor Branch; idea for embedded data: Yihui Xie; picture: Maija Karala, assistance: Aji John

Exercise 2: Fairbanks weather Read in the data from 'Fairbanks. AK weather. csv'. Plot average annual high temperature against day of the year using geom_col(), and scale_fill_gradient 2() to create a divergent color scale with red bars for temperatures above 0°C and blue below 0°C.
 Use geom_col() to plot precipitation for the Olympic")
Exercise 3: Hoh rainforest rainfall (difficult) Use geom_col() to plot precipitation for the Olympic National Park from data in 'Hoh. Ranger. Station. csv' with data for rainfall in the Olympic National Park, WA. Use a qualitative Color. Brewer palette in scale_fill_brewer() to color bars by season, and then a sequential Color. Brewer palette and scale_fill_gradientn() to color bars by precipitation levels.
- Slides: 37