TOYOTA MOTOR CORPORATION TMC FY 2011 TMC group
 FY 2011")


 / Net revenues")
 / Net revenues")
 / shareholders’ equity")
 / Total assets")


- Slides: 32
TOYOTA MOTOR CORPORATION (TMC) FY 2011
TMC group companies are • • • Toyota Lexus Scion Daihatsu Hino Motors, Ltd DENSO Toyota Industries Fuji Heavy Industries (16. 5%) Toyota Financial Service
Overview • • • Founded: August 28, 1937 Headquarters: Toyota city Aichi, Japan One of the largest automobile manufacturers No. 1 global automaker 2010 8, 557, 351 Units sold in 2010 Held 11% share of the total global auto market
Headquarters, Toyota City
Consolidated Financial Statements
Liquidity analysis Liquidity ratios measure the company's ability to meet its short-term obligations. • Current ratio • Quick ratio • Cash ratio
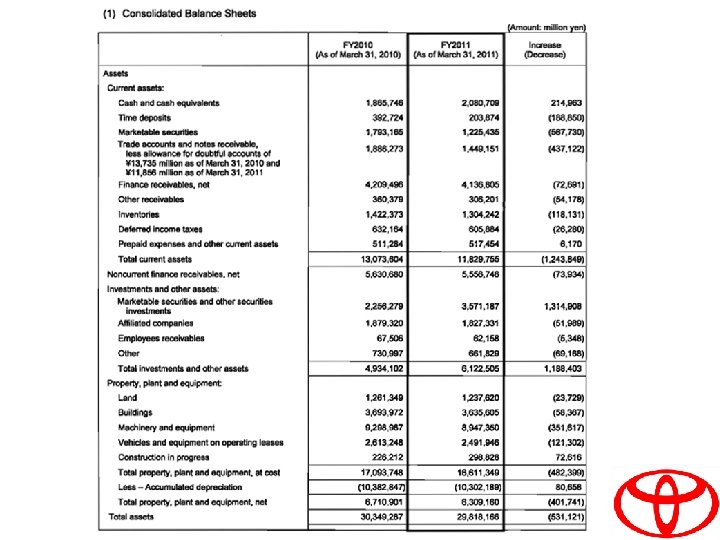
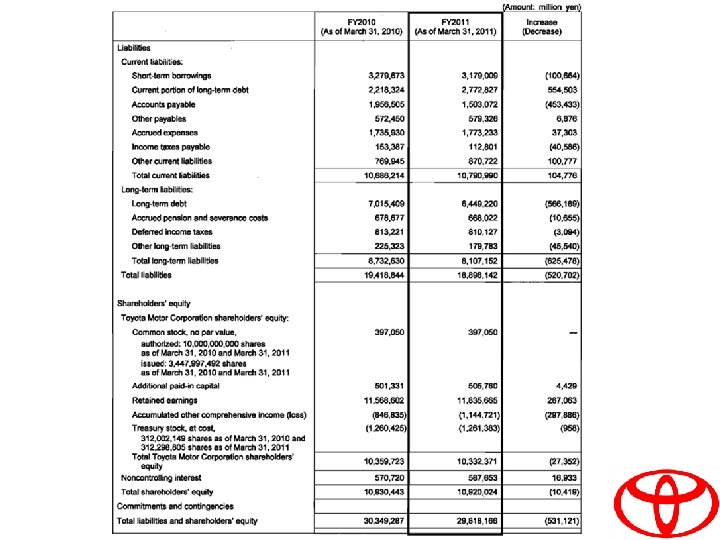
Current ratio 2011 2010 = Current assets / Current liabilities =11829755/10790990 =1. 10 = Current assets / Current liabilities =13073604/10686214 =1. 22
Quick ratio 2011 = Total quick assets / Current liabilities =9402175/10790990 =0. 871 2010 = Total quick assets / Current liabilities =10507783/10686214 =0. 98
Cash ratio 2011 = Total cash assets / Current liabilities =3510018/10790990 =0. 33 2010 = Total cash assets / Current liabilities =4051635/10686212 =0. 38
Net working capital 2011 2010 = Current assets - Current liabilities =11829755 - 10790990 =1038765 = Current assets - Current liabilities =13073604 - 10686214 =2387390
Activity Analysis Activity ratios measure how efficiently a company performs day-to-day tasks, such us the collection of receivables and management of inventory. • Inventory turnover in days • Debtors turnover ratio • Average collection period
• Creditors turnover ratio • Average payment period • Working capital turnover ratio
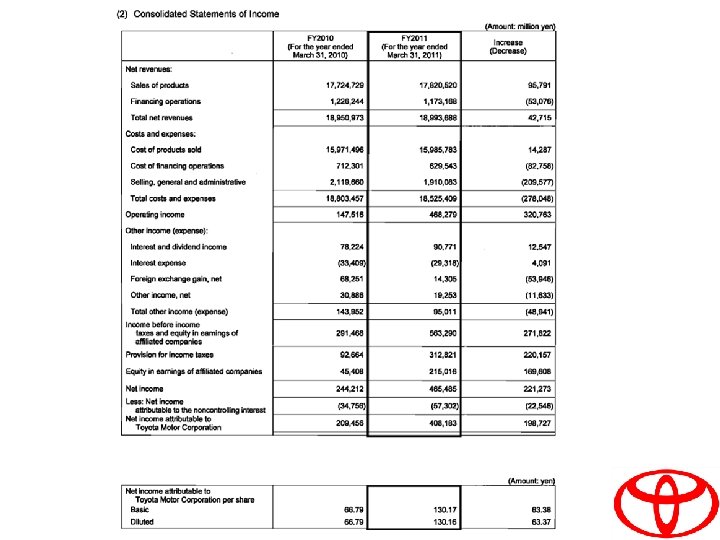
Inventory turnover ratio 2011 = Net revenues / Inventories =18993688/1304242 =14. 56 2010 = Net revenues / Inventories =18950973/1422373 =13. 32
Inventory turnover in days 2011 2010 = 365 / Inventory turnover =365/14. 56 =25 = 365 / Inventory turnover =365/13. 32 =27
Debtors turnover ratio 2011 2010 = Net revenues ÷ Trade accounts and notes receivable, less allowance for doubtful accounts =18993688/1449151 =13. 11 = Net revenues ÷ Trade accounts and notes receivable, less allowance for doubtful accounts =18950973/1886273 =10. 05
Average collection period 2011 = 365 / Debtors turnover =365/13. 11 =28 2010 = 365 / Debtors turnover =365/10. 05 =36
Creditors turnover ratio 2011 2010 = Net revenues / Accounts payable =18993688/1503072 =12. 64 = Net revenues / Accounts payable =18950973/1956505 =9. 69
Average payment period 2011 = 365 / Payables turnover =365/12. 64 =29 2010 = 365 / Payables turnover =365/9. 69 =38
Working capital turnover ratio 2011 = Net revenues / Net working capital =18993688/1038765 =18. 28 2010 = Net revenues / Net working capital =18950973/2387390 =7. 93
Profitability analysis Profitability ratios measure the company's ability to generate profitable sales from its resources (assets). • Gross Profit Margin • Operating Profit Margin • Net Profit Margin • Return on Equity (ROE) • Return on Assets (ROA)
Gross profit margin 2011 2010 = 100 × Gross profit / Net revenues = 100 x 3637448 / 18993688 = 19. 15% = 100 × Gross profit / Net revenues = 100 x 3691778 / 18950973 = 19. 48%
Operating profit margin 2011 2010 = 100 × Operating income (loss) / Net revenues = 100 x 468279 / 18993688 = 2. 46% = 100 × Operating income (loss) / Net revenues = 100 x 147516 / 18950973 =. 78%
Net profit margin 2011 2010 = 100 × Net income (loss) / Net revenues = 100 x 408183 / 18993688 = 2. 14% = 100 × Net income (loss) / Net revenues = 100 x 209456 / 18950973 = 1. 11%
Return on equity 2011 2010 = 100 × Net income (loss) / shareholders’ equity = 100 x 408183 / 10332371 = 3. 95% = 100 × Net income (loss) / shareholders’ equity = 100 x 209456 / 10359723 = 2. 02%
Return on assets 2011 2010 = 100 × Net income (loss) / Total assets = 100 x 408183 / 29818166 = 1. 37% = 100 × Net income (loss) / Total assets = 100 x 209456 / 30349287 = 0. 69%
The BIG THREE comparison
Comparison with major competitors Profitability analysis Toyota GM Volkswagen AG Gross Profit Margin 19. 15% 17. 2% 17. 11% Operating Profit Margin 2. 47% 8. 7% 11. 4% Net Profit Margin 2. 15% 7. 2% 10. 7% Return on Equity 3. 95% 28. 7% 32. 10% Return on Assets 1. 37% 6. 6% 3. 08%
Comparison with major competitors Activity analysis Toyota GM Volkswagen 14. 56 8. 7 5. 6 25 xx xx 13. 11 15. 5 12. 4 Average Collection Period 28 xx xx Creditors Turnover Ratio 12. 64 xx xx Average Payment Period 29 xx xx Working Capital Turnover Ratio 15. 19 18. 0 5. 77 Inventory Turnover in Days Debtors Turnover Ratio
Comparison with major competitors Liquidity Analysis Toyota GM Volkswagen Current Ratio 1. 10 1. 3 1. 2 Quick Ratio 0. 87 0. 8 0. 9 Cash Ratio 0. 33 xx xx