Tools 3 Analysis of Relationships Vanda Altarelli July


 l Four-cell analysis can be used to identify the most")


 FCA…. varieties with specific adaptations traits (such as cultivars adapted to swampy")


- Slides: 34
Tools 3 – Analysis of Relationships Vanda Altarelli July 2016 Master in Human Development and Food Security
Impact Flow Diagram l To understand the contributing causes or reasons for a particular issue or to identify effects or impacts of a particular change. This tool can help to broaden insights about impacts to include positive and negative, expected and unexpected and direct and indirect impacts. It can also help identify general effects that form the basis for indicators that are tracked more systematically or quantitatively with other methods.
How to 1. Start by putting the topic – with a symbol, photograph or in words – in the centre of a group (on the ground or a large flip chart). To work well, the topic must be specific, not as broad as “environmental degradation” but for example “declining number of banana trees”. The broader the topic, the longer the discussion will be. The topic can be a project activity, an event, a trend or a phenomenon such as “declining number of banana trees”. l 2. Ask what happened as a result of that activity (or trend/event). l
How to… The answers, both positive and negative, are the consequences of that activity (trend/event) and are noted as symbols or with words. They are placed in the diagram to show cause and effects are linked with arrows or lines. Try also to probe for indirect consequences or, if someone mentions something that is an indirect consequence, ask them to explain what caused this more directly. This helps the diagram develop in a series of cause and effects chains. l 3. If quantitative information is needed, then questions can be asked about the amount related to each impact that has been identified. l
How to… For example, if the persons say “we have noticed decreased production of bananas”, they may be able to estimate or measure how much that decrease is worth or how many people no longer collect banana bunches. l 4. You can also ask if the impact has been the same for everyone and symbolise that on the map with different groups having their own symbols. For example, if controlling banana weevil with a non chemical alternative requires more labour input, show who has provided that input (women, children) and what the impact has been for the women, children involved. l
How to… 5. Repeat the exercise with an agreed frequency. You can use past diagrams for comparison to generate a discussion on why changes might be occurring and how the rate of change is progressing. l If several flow diagrams are made with different groups and aggregation is required, they can be compiled into a single diagram, which then forms the basis of discussion. By aggregating effects into one flow diagram, you may lose the precision of knowing which groups identified which effect. You can prevent this by colour coding the effects. l
Tips on use l In these diagrams, linkages are presented by lines or arrows. If you use the latter, make sure that everybody understands the meaning of arrows l Flow diagrams provide an overview of change from the perspective of the people who are involved in the discussion. Do a crosscheck with other people and other methods. l These diagrams can also be used to identify areas for potential improvement. Be careful not to include too much detail in one diagram as it can become too dense to analyse well.
웃Children Crying Poorer Health ♂ ♀웃 Less Food Problem: Lack of Water Poverty ♂ ♀웃 Death ☠ ♀웃♂ Sadness ♂ Fewer Animals + Deforestat & Draught Less Agricul Less Livestock
Make Your Own Impact Flow Diagram
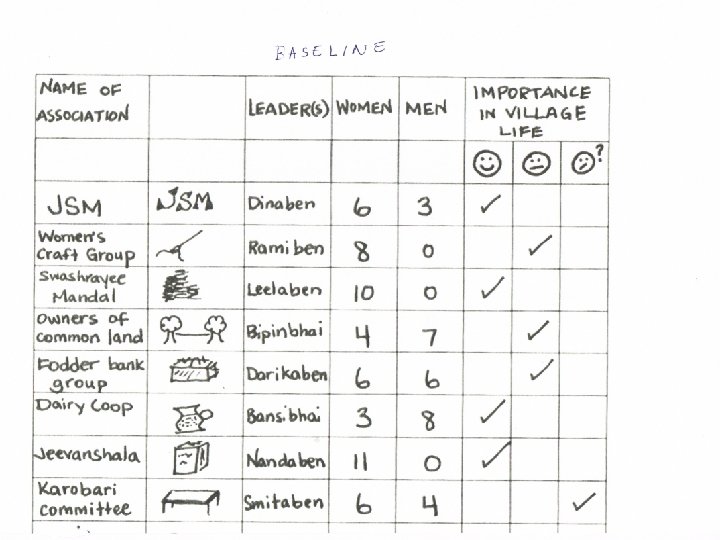
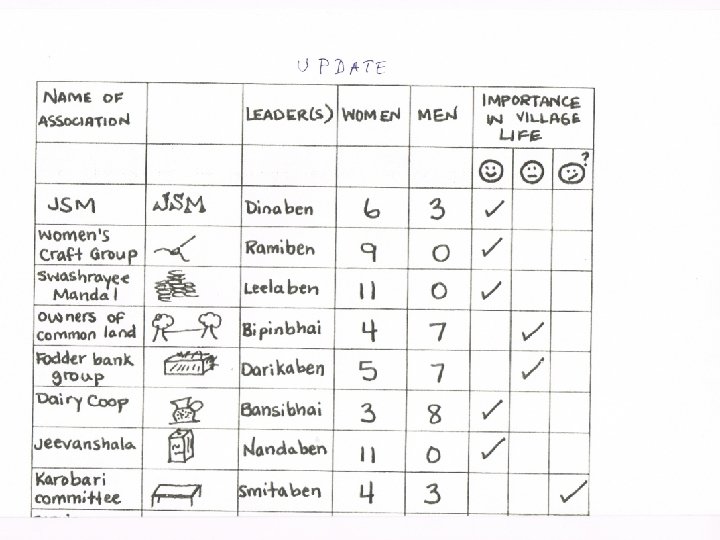
Association Importance Chart l An association’s main activities may change. Leadership within an association may change. The importance that villagers place on an association may increase or decrease. All of these changes can tell us something about the organizing capacity within the village. If the number of associations or the scope of their work increases, we can infer that the organizing capacity within the village has also increased.
Association Importance Chart l Using a simple chart, a group of villagers can easily list all the village level associations, their leaders, the numbers of male and female members and the activities that each are engaged in. The group can also assign a level of importance to each association using a symbol decided upon by the group. In the following chart there are six village level associations listed. Each has one or two leaders and a number of men and women (three are women only).
Association… l Using the information from the chart, the group can then construct a Venn (chapati) diagram, illustrating the relative sizes and relative importance of associations in their lives. In the diagram, this same information is shown in a more visual form: l The larger “chapatis” represent associations with larger membership. “Chapatis” close to the centre represent associations with a prominent role in overall village life.
Spider Web Diagram l The Spider Web Diagram, also called cobweb diagram, is a highly visual method for analysing the relative importance of, or progress on, different aspects of an intervention. Each aspect is represented by one arm of the frame of the web, and is graded from 1– 10. It is also possible to rank programme/village/group/individual l performance during (monitoring) or at the end (evaluation) of a programme.
Steps in SWD l 1. Discuss the purpose of the exercise with the participants, and reach a common decision on the aspects to be rated by them, depending on the exercise. These could be the performance of the project against its objectives, the various activities of the project, the extent of developments in different villages, etc. l 2. Ask the participants to write these aspects on cards or represent them by drawings.
Steps in SWD Take a large paper and arrange the cards radially, away from the centre. Join the centre to the card with a straight line. (See diagram). This line represents a scale from 1– 10. l 3. Ask the participants to score each of the aspects based on the performance and ask them to mark the score on the axes of the circle. This can be done either by asking each individual to present her/his ideas and mark the score, and further discuss to reach consensus on a collective score; or by discussing first and then marking the collective score accordingly l
Framework for a SD
Spiderweb Diagram l 4. Join the score on each of the axes, with a line as shown in the diagram below. l 5. Discuss the scores and the underlying causes/reasons. l 6. Document the exercise and take notes of the reasons stated by the participants. These results, once repeated after 1 or 2 years can then be used for monitoring and evaluation
Criteria to depict change
Spider Web Diagram l In the example above, the spider web indicated the impact of a programme in three tribal villages in Tamil Nadu. The important and noteworthy change is that all children are going to school. Participants tried to quantify some of the other changes. They estimated that about 50% of the farmers were practicing intercropping. Yield levels had improved from 4 bags to 7 bags per acre. Apart from all this, they had introduced groundnut for cultivation; this was not grown earlier.
Spider Web Diagram l Employment generation on the farm had doubled from 3 months to 6 months. Income level was also reported to have more than doubled, from the land holdings. Besides, the 100 per cent loan repayment by the tribal peoples had resulted in improved linkages with the banks. l This tool is relatively quick and easy for impact assessment, providing a visual result to which participants can readily relate. However, it is not very suitable for quantitative estimates.
Four Cell Analysis (FCA) l Four-cell analysis can be used to identify the most important assets that play a role in the livelihoods of local people (in the example these are biological assets); to facilitate systematic analysis of farmers logic of extent and distribution of local crop diversity; and to identify common, unique and rare plant genetic resources so that the community and professionals can develop diversified livelihood options and conservation plans. It was developed in Nepal by a team of Bioversity.
FCA…. l. A matrix is drawn on the ground (or on a large sheet of paper). SMALL AREA A B MANY HH FEW HH C D LARGE AREA
l Before FCA… starting the exercise, the researchers, with the assistance of local people (both men and women), prepare a list of the varieties (both traditional and modern) of a selected crop. l To achieve this they’ll undertake a transect walk with key informants (men and women). This list will then be validated with the focussed group that will provide the other answers.
l Villagers FCA… in the focussed group will be asked to define what they consider a large area and a small area. If there is difficulty defining the area, ask if the variety is grown in a large area or small area ofthe household. How much is large or small, if necessary, it should be determined by questioning the participants about their total cultivable land the proportion that is occupied by a specific variety. Then they define what they consider grown by many households and grown by few.
l The FCA… facilitators will call out the name of each variety from the list and let farmers have a discussion about where it should be placed in the quadrants. l Focussed group participants are then asked the following questions: l. What are the crops that are grown in large areas by many households? l What are the crops that are grown in large areas by few households? l
FCA… l What are the crops that are grown in small areas by many households? l What are the crops that are grown in small areas by few households? l This exercise will be conducted for all the varieties listed in the inventory.
FCA After completion, farmers are asked why they have placed each specific plant/crop/variety in cell A, B, C or D. The reasons are recorded after a group discussion and consensus is reached in the group. l • Now the facilitator should discuss with participants and elicit reasons for placing landraces in a large area or small area. l Document the use values of each landrace falling into each category in four cells in order to understand farmers’ rationale in greater depth. l
l Validate FCA the rationale of managing cultivars at household levels. Varieties which fall into four different cells have one of the following rationales; a) varieties grown for food security or for the market or with multiple use values tend to be cultivated l in large areas by many households; b) landraces cultivated for socio-cultural (traditions, religious rituals, food culture) purposes are grown in small areas by many households;
l c) FCA…. varieties with specific adaptations traits (such as cultivars adapted to swampy lands, poor soil fertility, drought, shade etc) are grown in large areas by few households and d) varieties with specific uses or limited use value to particular families are grown in small areas by a few households. l This common pattern is generally found to be consistent with economic rationales and there are some variations guided by specific household circumstances as well.
l This FCA…. information can be used for diversifying livelihood options and conservation actions by communities l It helps to identify common and rare types of diversity within the community and facilitate both developmental as well as conservation action plans. l It helps to discuss the results with the community and ask how they wish to maintain rare varieties.
FCA… l This methodology requires adjustment when it deals with fruit tree species in home gardens. For perennial species, it was found to be more appropriate to use the number of trees instead of area under the variety. With local adjustments, FCA can be a powerful tool for outsiders for understanding reasons why some farmers do what they do and how best outsiders could help them in diversifying and enhancing livelihood options.