Tips2 l XY gnuplot set xrange 15 15
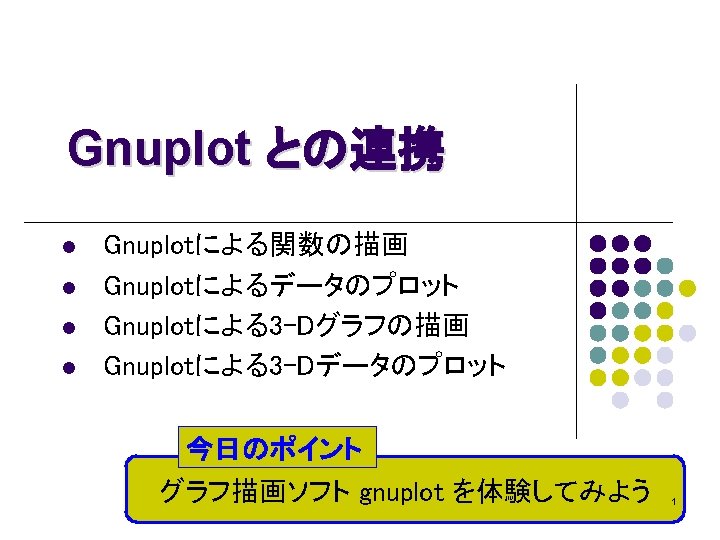


![グラフ描画のためのTips(2) l X軸範囲、Y軸範囲の指定は gnuplot> set xrange [-15: 15] gnuplot> set yrange [-2000: 2000] gnuplot>](https://slidetodoc.com/presentation_image/59a4479c8c1d8fb8201e41ed3f3ca677/image-7.jpg "グラフ描画のためのTips(2) l X軸範囲、Y軸範囲の指定は gnuplot> set xrange [-15: 15] gnuplot> set yrange [-2000: 2000] gnuplot>")
 gnuplot> set logscale xy gnuplot> set xrange [0.")
 = (sin px/px)2 オプ sinc 2(x)の対数グラフ gnuplot> sinc(x) = sin(pi*x)/(pi*x)")
, sin(7*t) gnuplot> set trange")


=sqrt(x*x+y*y) gnuplot> gauss(x, y)=exp(-R(x, y)**2) gnuplot> splot gauss(x, y)")
=sqrt(x*x+y*y) gnuplot> gauss(x, y)=exp(-R(x, y)**2) gnuplot> splot gauss(x, y) gnuplot>")

 = exp( -R(x, y) ) *")
 #include <stdio. h> #include <math. h> int main(void) { int")


- Slides: 26
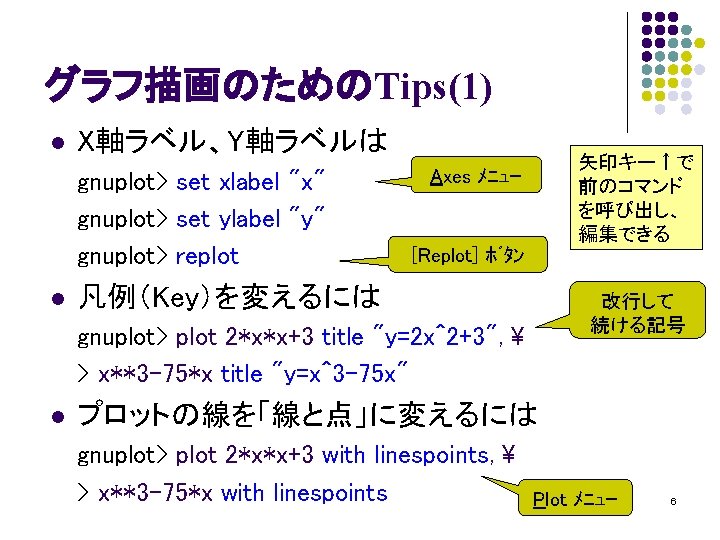
グラフ描画のためのTips(2) l X軸範囲、Y軸範囲の指定は gnuplot> set xrange [-15: 15] gnuplot> set yrange [-2000: 2000] gnuplot> replot l 目盛線をつけるには gnuplot> set grid l Chart メニュー → Grid on 対数グラフにするには gnuplot> set logscale xy l Axes メニュー → Logscale xyz set コマンドを解除するには gnuplot> unset grid Chart メニュー → Grid off 7
練習 2 対数グラフを描いてみよう Lorentz関数 gnuplot> plot 1/(1+x*x) gnuplot> set logscale xy gnuplot> set xrange [0. 1: 100] gnuplot> set yrange [0. 0001: 1] gnuplot> set xlabel "x" gnuplot> set ylabel "y" gnuplot> set grid gnuplot> replot 8
ン ショ sinc 2(x) = (sin px/px)2 オプ sinc 2(x)の対数グラフ gnuplot> sinc(x) = sin(pi*x)/(pi*x) gnuplot> plot sinc(x)**2 gnuplot> set logscale xy gnuplot> set xrange [0. 1: 100] gnuplot> set yrange [0. 0001: 1] gnuplot> set xlabel "x" gnuplot> set ylabel "y" gnuplot> set grid gnuplot> replot 関数定義 9
ョン シ オプ リサージュ図形 gnuplot> set parametric gnuplot> plot cos(5*t), sin(7*t) gnuplot> set trange [-pi: pi] gnuplot> set grid gnuplot> unset key gnuplot> replot 媒介変数 t 凡例なし (No Key) 10
練習 3 データのプロット gnuplot> plot 'Z: nyumon 2q 14. csv' with lines n 凡例を書き換える場合 gnuplot> plot 'Z: nyumon 2q 14. csv' > title "y=2 x^2+3" with lines n さらに線を「線と点」にかえる gnuplot> plot 'Z: nyumon 2q 14. csv' > title "y=2 x^2+3" with linespoints 11
ョン シ プ オ 複数データのプロット gnuplot> plot 'Z: nyumon 2q 14_s. csv' with lines, > 'Z: nyumon 2q 14_s. csv' using 1: 3 with lines n凡例を書き換える場合 1列目と 3列目 でプロット gnuplot> plot 'Z: nyumon 2q 14_s. csv' > title "2 x^2+3" with lines, > 'Z: nyumon 2q 14_s. csv' using 1: 3 > title "x^3 -75 x" with lines 12
練習 4 3 -Dグラフの描画 gnuplot> R(x, y)=sqrt(x*x+y*y) gnuplot> gauss(x, y)=exp(-R(x, y)**2) gnuplot> splot gauss(x, y) gnuplot> set xrange [-2: 2] gnuplot> set yrange [-2: 2] gnuplot> set isosample 40, 40 gnuplot> set xlabel "x" gnuplot> set ylabel "y" gnuplot> replot 関数定義 default の 10 では足りない 13
練習 5 等高線の描画 gnuplot> R(x, y)=sqrt(x*x+y*y) gnuplot> gauss(x, y)=exp(-R(x, y)**2) gnuplot> splot gauss(x, y) gnuplot> set xrange [-2: 2] gnuplot> set yrange [-2: 2] gnuplot> set contour base gnuplot> unset surface gnuplot> set view 0, 0 gnuplot> set cntrparam levels 10 gnuplot> set xlabel "x" gnuplot> set ylabel "y" gnuplot> replot 14
3 -D/等高線グラフのためのTips l 陰線処理 gnuplot> set hidden 3 d カラーマップ表示 gnuplot> set pm 3 d l カラーパレットの指定 gnuplot> set palette gray gnuplot> set palette color l 15
ョン シ プ オ Milk drop Milkdrop(x, y) = exp( -R(x, y) ) * ( exp( cos( R(x, y) )**20 ) + 8*sin( R(x, y) )**20 + 2*sin( 2*R(x, y) )**8 ) ) 16
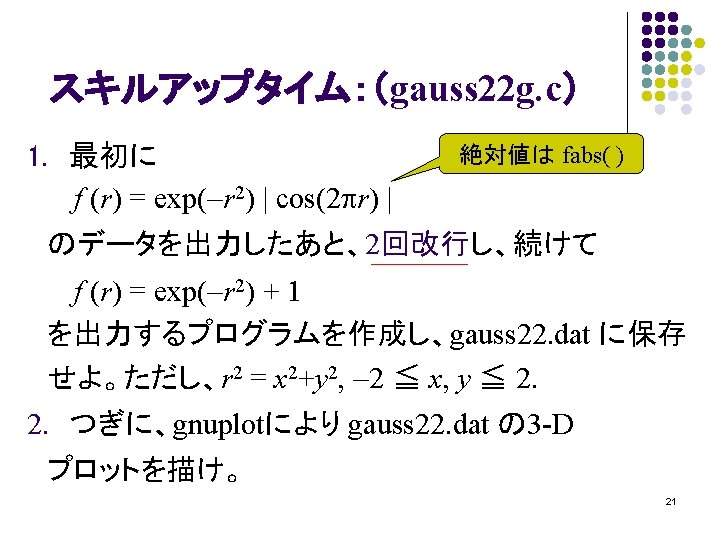
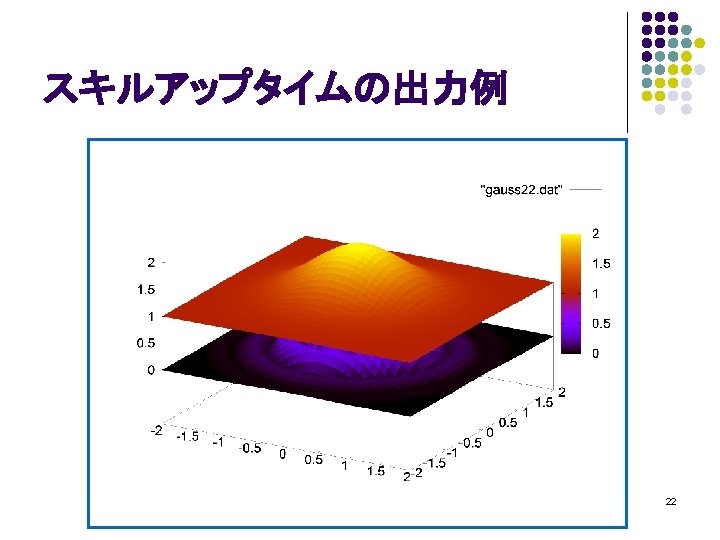
プログラム例 (gauss 2 g. c) #include <stdio. h> #include <math. h> int main(void) { int i, j, n=20; double x, y, z; for (j = -n; j <= n; j++) { y = 0. 1*j; for (i = -n; i < n; i++) { x = 0. 1*i; z = exp(-(x*x+y*y)); printf("%. 2 f, %. 3 fn", x, y, z); } printf("n"); } return 0; } 19
実行手順 Z: nyumon 2>cl gauss 2 g. c. . . Z: nyumon 2>gauss 2 g > gauss 2. dat このあと、gnuplot を起動し、 gnuplot> splot 'Z: nyumon 2gauss 2. dat' > with lines 20
ョン シ プ オ faceg. dat の表示 gnuplot> gnuplot> gnuplot> set view 180, 0 l 真下から見る unset surface l メッシュを非表示 unset xtics l 軸も非表示 unset ytics l 正方形にセット unset ztics l グレイスケールで表示 set size square l gnuplot 用にデータを並べ替 set pm 3 d えた faceg. dat を3 D表示 set palette gray splot 'Z: nyumon 2faceg. dat' 24
ョン シ プ オ face. dat → faceg. dat の変換 #include <stdio. h> face 4 g. c #include <string. h> int main(void) { int i; char *p, s[520]; while (fgets(s, 520, stdin)!=NULL) { p=strtok(s, " "); if (p && (*p!=' ')) printf("%sn", p); for (i=1; i<128; i++) { p=strtok(NULL, " "); if (p && (*p!=' ')) printf("%sn", p); } printf("n"); } return 0; } 25
ョン シ プ オ face. dat → faceg. dat の変換 Z: nyumon 2>cl face 4 g. c Z: nyumon 2>face 4 g < face. dat > faceg. dat 26