The average deviation from the mean value of

. The")


 signals that")
- Slides: 36
The average deviation from the mean value of a signal. AC (Alternating current). The average value of a signal. DC (direct current) value.
Histogram The histogram displays the number of samples there are in the signal that have each of these 256 possible values. For a 8 bit ADC, 256 possibilities (0 -255), M is the number of possible values that each sample can take on. H 50 is the number of samples that have a value of 50. N number of samples. The histogram can be used to efficiently calculate the mean and standard deviation of very large data sets.
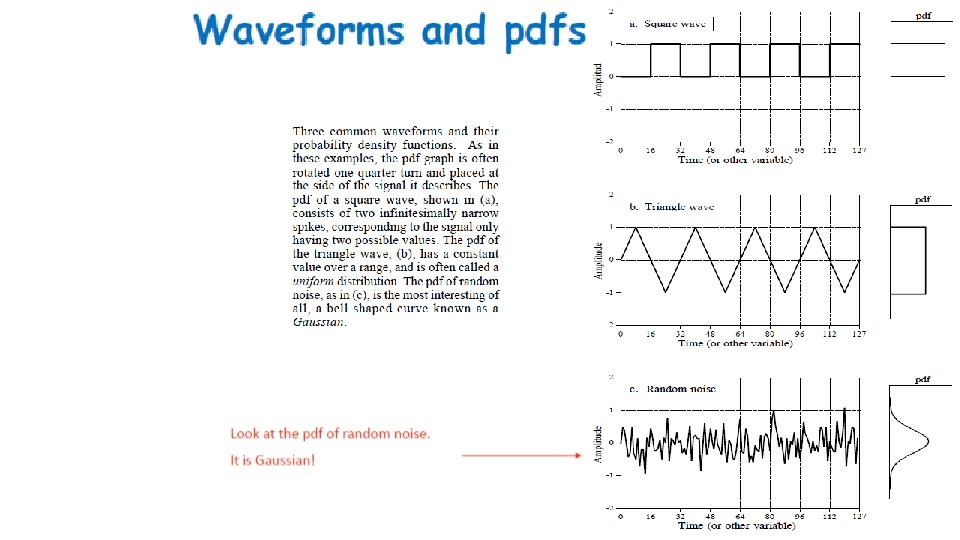
Histogram, pmf, pdf - The histogram is what is formed from an acquired signal. (finite number of samples) Look at the values along y-axis - The corresponding curve for the underlying process is called the probability mass function (pmf). (Fractional basis -> sum=1), describes the probability that a certain value will be generated. For example. Discrete - The probability density function (pdf) is to continuous signals. what the probability mass function is to discrete signals. The relationship between (a) the histogram, (b) the probability mass function (pmf), and (c) the probability density function (pdf). The histogram is calculated from a finite number of samples. The pmf describes the probabilities of the underlying process. The pdf is similar to the pmf, but is used with continuous rather than discrete signals. Even though the vertical axis of (b) and (c) have the same values (0 to 0. 06), this is only a coincidence of this example. The amplitude of these three curves is determined by: (a) the sum of the values in the histogram being equal to the number of samples in the signal; (b) the sum of the values in the pmf being equal to one, and (c) the area under the pdf curve being equal to one. Continuous
with floating point data there are billions of possible levels that would have to be taken into account. The solution to these problems is a technique called binning (length of the histogram to be some convenient Number called bins).
Signals formed from random processes usually have a bell shaped pdf. This is called a normal distribution, a Gauss distribution German mathematician, Karl Friedrich Gauss 1777 -1855).
A common need in DSP is to generate (using random number generator) signals that resemble various types of random noise. This is required to test the performance of algorithms that must work in the presence of noise. To create a normally distributed noise signal: For each sample in the signal: (1) add twelve random numbers, (2) subtract six to make the mean equal to zero, (3) multiply by the standard deviation desired, and (4) add the desired mean.