Average Arithmetic and Average Quadratic Deviation Average Arithmetic


 H 0: μ=0 α 1 -α μ")


 is the hypothesis to be tested----hypothesis of no")
 n Computed")


 H 0: μ=0 α 1 -α μ")


")


- Slides: 63
Average Arithmetic and Average Quadratic Deviation
Average Arithmetic and Average Quadratic Deviation n The average values, which give the generalized quantitative description of certain characteristic in statistical totality at the certain terms of place and time, are the most widespread form of statistical indices. They represent the typical lines of variation characteristic of the explored phenomena.
Average Arithmetic and Average Quadratic Deviation n Because of that quantitative description of characteristic is related to its high-quality side, it follows to examine average values only in light of terms of high-quality analysis. Except of summarizing estimation of certain characteristic the necessity of determination of changeable quantitative average values for the totality arises up also, when two groups which high-quality differ one from other are compared.
The use of averages in health protection n for description of work organization of health protection establishments (middle employment of bed, term of stay in permanent establishment, amount of visits on one habitant and other);
The use of averages in health protection n for description of work organization of health protection establishments (middle employment of bed, term of stay in permanent establishment, amount of visits on one habitant and other);
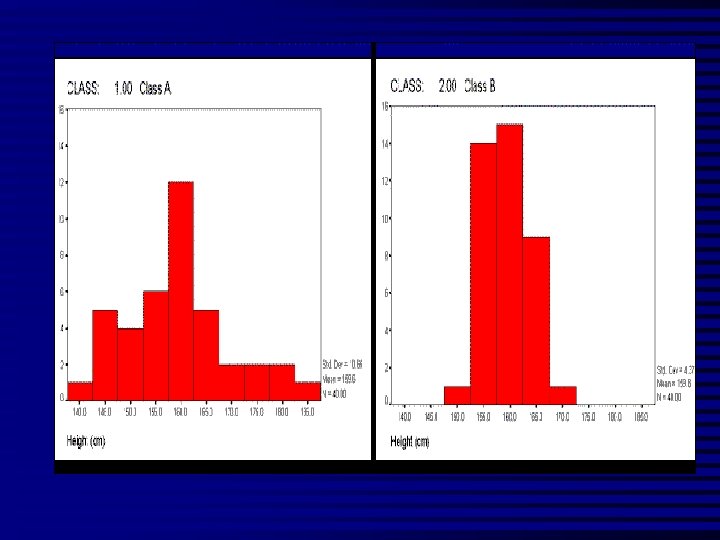
The use of averages in health protection n for description of indices of physical development (length, mass of body, circumference of head of new-born and other);
Introduction n The purpose of HYPOTHESIS TESTING is to aid the clinician, researcher, or administrator in reaching a conclusion concerning a POPULATION by examining a SAMPLE from that population sample inference
inference parameter statistics sample
Hypothesis is…. A statement about one or more populations. e. g. n The average length of stay of patients admitted to the hospital is 5 days; n A certain drug will be effective in 90 percent of the cases for which it is used.
Estimation: approximate a characteristic of the population with a statistic computed from the sample m = population mean x = sample mean x is our estimate of m
Types of hypotheses n n Research hypothesis The research hypothesis is the conjecture or supposition that motivates the research. Statistical hypothesis Statistical hypotheses are hypotheses that are stated in such a way that they be evaluated by appropriate statistical techniques.
Example Twenty patients with a certain disease were randomly selected. The mean of enythrocyte sedimentation (ES) is 9. 15 with standard deviation of 2. 13. However, references reported mean of ES of this type of patients is 10. 50. n Question: Does the mean of ES of this sample differ from 10. 50? n
Types of errors Condition of null hypothesis Possible action P>0. 05 P<0. 05 Fail to reject H 0 Reject H 0 True False Correct action Type II error β Type I error α Correct action
Type I and II error (one tailed) H 0: μ=0 α 1 -α μ H 1: μ=μ 0>0 β μ 1 -β Uα (critical value) μ+δ
Decision making α/2=0. 025 Rejectio -1. 96 Non rejection 0 region 1. 96 n region
The use of averages in health protection n for description of indices of physical development (length, mass of body, circumference of head of new-born and other);
The use of averages in health protection n for determination of medical-physiology indices of organism (frequency of pulse, breathing, level of arterial pressure and other);
The use of averages in health protection n for estimation of these medical-social and sanitary-hygienic researches (middle number of laboratory researches, middle norms of food ration, level of radiation contamination and others).
Averages n Averages are widely used for comparison in time, that allows to characterize the major conformities to the law of development of the phenomenon. So, for example, conformity to the law of growth increase of certain age children finds the expression in the generalized indices of physical development. Conformities to the law of dynamics (increase or diminishment) of pulse rate, breathing, clinical parameters at the certain diseases find the display in statistical indices which represent the physiology parameters of organism and other.
Chi-square distribution 3. 84
Distribution rule To reject the H 0 if the value of the test statistic that we compute from our sample is one of the values in the rejection region ; To not reject the H 0 if the computed value of the test statistic is one of the values in the non-rejection region.
Significance level The decision as to which values go into the rejection region and which ones go into the non-rejection region is made on the basis of the desired level of significance, designated by α; The test statistic that falls in the rejection region is said to be significant.
Hypothesis testing steps 1. 2. 3. 4. 5. Data ----the nature of data ---test methods Assumption ---e. g. normality of population distribution, equality of variance, and independence of samples-makes it possible to use certain mathematic models to reach an estimation of the sample. Statistical Hypothesis and αlevel Statistic computation Decision making
Hypothesis The NULL HYPOTHESIS (H 0) is the hypothesis to be tested----hypothesis of no difference between mean of sample and mean of population n The ALTERNATIVE HYPOTHESIS (H 1) is a statement of what we will believe is true if our sample data cause us to reject the null hypothesis.
Test statistic Decision maker (reject or not to reject the H 0) n Computed from the data of the sample. n Compare the computed statistics from our sample to the corresponding CRITICAL VALUE, make decision n
General Formula for Test Statistic Test statistic =
Distribution of test statistic Sample distribution is the key to statistical inference. t distribution or standard normal distribution n For example; S t= n Follows the standard normal distribution if the hypothesis is true and the assumptions are met.
t distribution and u distribution
Decision making α/2=0. 025 Rejectio -1. 96 Non rejection 0 region 1. 96 n region
Chi-square distribution 3. 84
Type I and II error (one tailed) H 0: μ=0 α 1 -α μ H 1: μ=μ 0>0 β μ 1 -β Uα (critical value) μ+δ
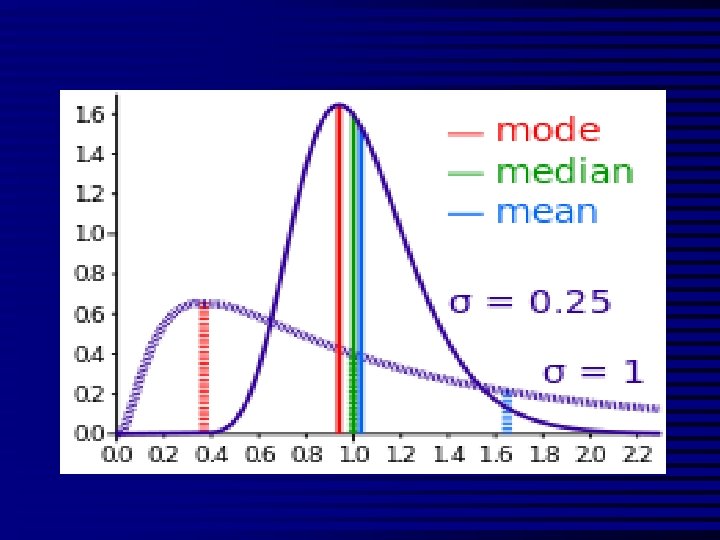
Average Values n n n n Mean: the average of the data sensitive to outlying data Median: the middle of the data not sensitive to outlying data Mode: most commonly occurring value Range: the difference between the largest observation and the smallest Interquartile range: the spread of the data commonly used for skewed data Standard deviation: a single number which measures how much the observations vary around the mean Symmetrical data: data that follows normal distribution (mean=median=mode) report mean & standard deviation & n Skewed data: not normally distributed (mean median mode) report median & IQ Range
Average Values n Limit is the meaning of edge variant in a variation row lim = Vmin Vmax
Average Values n Amplitude is the difference of edge variant of variation row Am = Vmax - Vmin
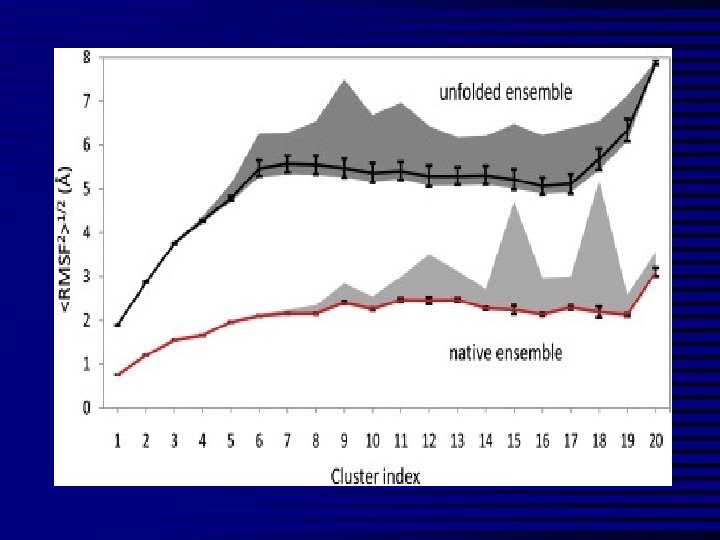
Average Values n Average quadratic deviation characterizes dispersion of the variants around an ordinary value (inside structure of totalities).
Average quadratic deviation σ= simple arithmetical method
Average quadratic deviation d=V-M genuine declination of variants from the true middle arithmetic
Average quadratic deviation σ=i method of moments
Average quadratic deviation is needed for: 1. Estimations of typicalness of the middle arithmetic (М is typical for this row, if σ is less than 1/3 of average) value. 2. Getting the error of average value. 3. Determination of average norm of the phenomenon, which is studied (М± 1σ), sub norm (М± 2σ) and edge deviations (М± 3σ). 4. For construction of sigmal net at the estimation of physical development of an individual.
Average quadratic deviation This dispersion a variant around of average characterizes an average quadratic deviation ( )
n Coefficient of variation is the relative measure of variety; it is a percent correlation of standard deviation and arithmetic average.
Terms Used To Describe The Quality Of Measurements Reliability is variability between subjects divided by inter-subject variability plus measurement error. n Validity refers to the extent to which a test or surrogate is measuring what we think it is measuring. n
Measures Of Diagnostic Test Accuracy n n Sensitivity is defined as the ability of the test to identify correctly those who have the disease. Specificity is defined as the ability of the test to identify correctly those who do not have the disease. Predictive values are important for assessing how useful a test will be in the clinical setting at the individual patient level. The positive predictive value is the probability of disease in a patient with a positive test. Conversely, the negative predictive value is the probability that the patient does not have disease if he has a negative test result. Likelihood ratio indicates how much a given diagnostic test result will raise or lower the odds of having a disease relative to the prior probability of disease.
Measures Of Diagnostic Test Accuracy
Expressions Used When Making Inferences About Data n Confidence Intervals - The results of any study sample are an estimate of the true value in the entire population. The true value may actually be greater or less than what is observed. n n n Type I error (alpha) is the probability of incorrectly concluding there is a statistically significant difference in the population when none exists. Type II error (beta) is the probability of incorrectly concluding that there is no statistically significant difference in a population when one exists. Power is a measure of the ability of a study to detect a true difference.
Multivariable Regression Methods n n Multiple linear regression is used when the outcome data is a continuous variable such as weight. For example, one could estimate the effect of a diet on weight after adjusting for the effect of confounders such as smoking status. Logistic regression is used when the outcome data is binary such as cure or no cure. Logistic regression can be used to estimate the effect of an exposure on a binary outcome after adjusting for confounders.
Survival Analysis n n Kaplan-Meier analysis measures the ratio of surviving subjects (or those without an event) divided by the total number of subjects at risk for the event. Every time a subject has an event, the ratio is recalculated. These ratios are then used to generate a curve to graphically depict the probability of survival. Cox proportional hazards analysis is similar to the logistic regression method described above with the added advantage that it accounts for time to a binary event in the outcome variable. Thus, one can account for variation in follow-up time among subjects.
Kaplan-Meier Survival Curves
Why Use Statistics?
Descriptive Statistics Identifies patterns in the data n Identifies outliers n Guides choice of statistical test n
Percentage of Specimens Testing Positive for RSV (respiratory syncytial virus)
Descriptive Statistics
Distribution of Course Grades
Describing the Data with Numbers Measures of Dispersion • • • RANGE STANDARD DEVIATION SKEWNESS
Measures of Dispersion • RANGE highest to lowest values STANDARD DEVIATION • how closely do values cluster around the mean value SKEWNESS • refers to symmetry of curve • • •
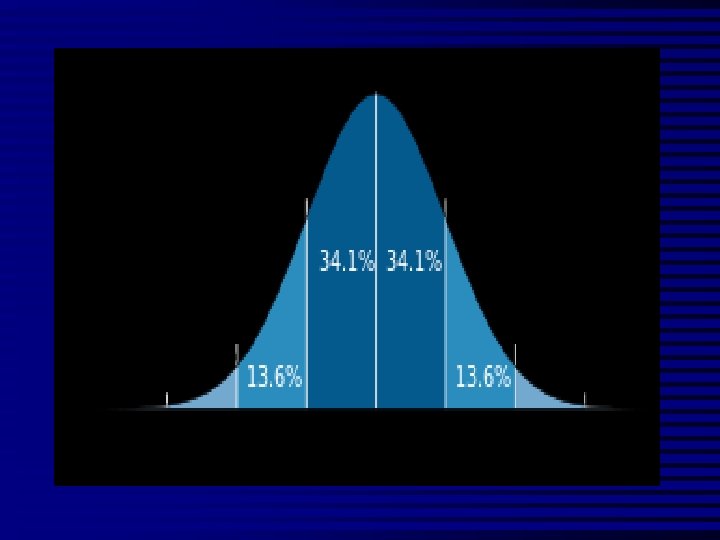
The Normal Distribution n n Mean = median = mode Skew is zero 68% of values fall between 1 SD 95% of values fall between 2 SDs Mean, Median, Mode . 1 2