Teacher Quality Quality Teaching and Student Outcomes Measuring


- Slides: 33

Teacher Quality, Quality Teaching, and Student Outcomes: Measuring the Relationships Heather C. Hill Deborah Ball, Hyman Bass, Merrie. Blunk, Katie Brach, Charalambos. Charalambous, Carolyn Dean, Séan Delaney, Imani Masters Goffney, Jennifer Lewis, Geoffrey Phelps, Laurie Sleep, Mark Thames, Deborah Zopf

Measuring teachers and teaching n Traditionally done at entry to profession (e. g. , PRAXIS) and later ‘informally’ by principals n Increasing push to measure teachers and teaching for specific purposes: Paying bonuses to high-performing teachers n Letting go of under-performing (pre-tenure) teachers n Identifying specific teachers for professional development n Identifying instructional leaders, coaches, etc. n

Methods for identification n Value-added scores Average of teachers’ students’ performance this year differenced from same group of students’ performance last year n In a super-fancy statistical model n Typically used for pay-for-performance schemes n Problems n Self-report / teacher-initiated n Typically used for leadership positions, professional dev. n However, poor correlation with mathematical knowledge n

Identification: Alternative Methods n Teacher characteristics n NCLB’s definition of “highly qualified” n More direct measures n Educational production function literature n Direct measures of instruction n CLASS (UVA)—general pedagogy n Danielson, Saphier, TFA—ditto n But what about mathematics-specific practices?

Purpose of talk n To discuss two related efforts at measuring mathematics teachers and mathematics instruction n To highlight the potential uses of these instruments Research n Policy? n

Begin With Practice n Clips from two lessons on the same content – subtracting integers What do you notice about the instruction in each mathematics classroom? n How would you develop a rubric for capturing differences in the instruction? n What kind of knowledge would a teacher need to deliver this instruction? How would you measure that knowledge? n

Bianca n Teaching material for the first time (Connected Mathematics) n Began day by solving 5 -7 with chips n Red chips are a negative unit; blue chips are positive n Now moved to 5 – (-7) n Set up problem, asked students to used chips n Given student work time

Question n What seems mathematically salient about this instruction? n What mathematical knowledge is needed to support this instruction?

Mercedes n Early in teaching career n Also working on integer subtraction with chips from CMP n Mercedes started this lesson previous day, returns to it again

Find the missing part for this chip problem. What would be a number sentence for this problem? Start With Rule Add 5 Subtract 3 End With

Questions n What seems salient about this instruction? n What mathematical knowledge is needed to support this instruction?

What is the same about the instruction? n Both teachers can correctly solve the problems with chips n Both teachers have well-controlled classrooms n Both teachers ask students to think about problem and try to solve it for themselves

What is different? n Mathematical knowledge n Instruction

Observing practice… n Led to the genesis of “mathematical knowledge for teaching” n Led to “mathematical quality of instruction”

Mathematical Knowledge for Teaching Source: Ball, Thames & Phelps, JTE 2008

MKT Items n 2001 -2008 created an item bank of for K-8 mathematics in specific areas (see www. sitemaker. umich. edu/lmt) (Thanks NSF) n About 300 items n Items mainly capture subject matter knowledge side of the egg n Provide items to field to measure professional growth of teachers n NOT for hiring, merit pay, etc.

MKT Findings n Cognitive validation, face validity, content validity n Have successfully shown growth as a result of prof’l development n Connections to student achievement - SII n n Questionnaire consisting of 30 items (scale reliability. 88) Model: Student Terra Nova gains predicted by: n n n Student descriptors (family SES, absence rate) Teacher characteristics (math methods/content, content knowledge) Teacher MKT significant n n Small effect (< 1/10 standard deviation): 2 - 3 weeks of instruction But student SES is also about the same size effect on achievement (Hill, Rowan, and Ball, AERJ, 2005) n What’s connection to mathematical quality of

History of Mathematical Quality of Instruction (MQI) n Originally designed to validate our mathematical knowledge for teaching (MKT) assessments n Initial focus: How is teachers’ mathematical knowledge visible in classroom instruction? n Transitioning to: What constitutes quality in mathematics instruction? n Disciplinary focus n Two-year initial development cycle (2003 -05) n Two versions since then

MQI: Sample Domains and Codes n Richness of the mathematics n e. g. , Presence of multiple (linked) representations, explanation, justification, multiple solution methods n Mathematical errors or imprecisions n e. g. , Computational, misstatement of mathematical ideas, lack of clarity n Responding to students n e. g. , Able to understand unusual student-generated solution methods; noting and building upon students’ mathematical contributions n Cognitive level of student work n Mode of instruction

Initial study: Elementary validation n Questions: n Do higher MKT scores correspond with higherquality mathematics in instruction? n n NOT about “reform” vs. “traditional” instruction Instead, interested in the mathematics that appears

Method n 10 K-6 teachers took our MKT survey n Videotaped 9 lessons per teacher n 3 lessons each in May, October, May n Associated post-lesson interviews, clinical interviews, general interviews

Elementary validation study n Coded tapes blind to teacher MKT score n Coded at each code n Every 5 minutes n Two coders per tape n Also generated an “overall” code for each lesson – low, medium, high knowledge use in teaching n Also ranked teachers prior to uncovering MKT scores

Projected Versus Actual Rankings of Teachers Projected ranking of teachers: Correlation of. 79 (p <. 01) Actual ranking of teachers (using MKT scores): Hill, H. C. et al. , (2008) Cognition and Instruction

Correlations of Video Code Constructs to Teacher Survey Scores *significant at the. 05 level Construct (Scale) Correlation to MKT scores Responds to students 0. 65* Errors total -0. 83* Richness of mathematics 0. 53

Validation Study II: Middle School n Recruited 4 schools by value-added scores n High (2), Medium, Low n Recruited every math teacher in the school n All but two participated for a total of 24 n Data collection n n Student scores (“value-added”) Teacher MKT/survey Interviews Six classroom observations n Four required to generalize MQI; used 6 to be sure

Validation study II: Coding n Revised instrument contained many of same constructs Rich mathematics n Errors n Responding to students n n Lesson-based guess at MKT for each lesson (averaged) n Overall MQI for each lesson (averaged to teacher) n G-study reliability: 0. 90

Validation Study II: Value-added scores n All district middle school teachers (n=222) used model with random teacher effects, no school effects Thus teachers are normed vis-à-vis performance of the average student in the district n Scores analogous to ranks n n Ran additional models; similar results* n Our study teachers’ value-added scores extracted from this larger dataset

Results MKT MQI Lesson-based MKT Value-added score* 1. 0 0. 53** 0. 72** 0. 41* 1. 0 0. 85** 0. 45* 1. 0 0. 66** MQI Lesson-based MKT Value added score 1. 0 • Significant at p<. 05 • Significant at p<. 01 Source: Hill, H. C. , Umland, K. &Kapitula, L. (in progress) Validating Value-Added Scores: A Comparison with Characteristics of Instruction. Harvard GSE: Authors.

Additional Value-Added Notes n Value-added and average of: n Connecting classroom work to math: 0. 23 n Student cognitive demand: 0. 20 n Errors and mathematical imprecision: -0. 70** n Richness: 0. 37* n **As you add covariates to the model, most associations decrease n Probably result of nesting of teachers within schools n Our results show a very large amount of “error” in value-added scores

Lesson-based MKT vs. VAM score

Proposed Uses of Instrument n Research n n n Determine which factors associate with student outcomes Correlate with other instruments (PRAXIS, Danielson) Instrument included as part of the National Center for Teacher Effectiveness, Math Solutions DRK-12 and Gates value-added studies (3) n Practice? ? n n n Pre-tenure reviews, rewards Putting best teachers in front of most at-risk kids Self or peer observation, professional development

Problems n Instrument still under construction and not finalized n G-study with master coders indicates we could agree more among ourselves n Training only done twice, with excellent/needs work results n Even with strong correlations, significant amount of “error” n Standards required for any non-research use are high KEY: Not yet a teacher evaluation tool

Next n Constructing grade 4 -5 student assessment to go with MKT items n Keep an eye on use and its complications Questions?
 Hello, good morning teacher!
 Marketing based comparative approach example
 Obe in education
 National competency-based teacher standards
 Ead 520
 Domain 4 curriculum and planning ppt
 Missouri quality outcomes
 Article v the teachers and the profession
 Definitions of micro teaching
 What is direct method in teaching
 Teacher and student amateur
 Was aristotle a philosopher
 Conversation between teacher and student
 Erf for head teacher
 Good morning message to my lecturer
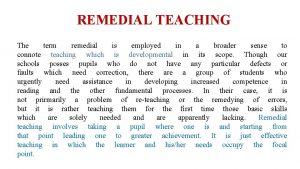
 Advantages of remedial teaching
 Metaphor teacher-student relationship
 Student teacher deep learning
 Teacher student database example
 Every student deserves a great teacher
 Improving student learning one teacher at a time
 Www.socrative.com student login
 Paradigm shift teacher-centered to student-centered
 Student teacher
 Improving student learning one teacher at a time
 Good morning students how are you today
 Cover letter for student teaching placement
 Student teaching binder
 Student teaching
 Student teaching
 Student teaching
 Monday tuesday is my weekend
 What did they do last weekend
 Clearinghouse student tracker

