SURVEY KONSUMSI PANGAN PERTEMUAN 1 DUDUNG ANGKASA PROGRAM


 Nama MK SKS Pengampu Buku wajib : Survey Konsumsi Pangan :")
 Capaian Pembelajaran Mahasiswa mampu mengetahui fungsi survey konsumsi pangan Mahasiswa mampu")
 CFSAN/Office of Analytics and Outreach The Total Diet Study (TDS)")

 Dietary assessment § First sign of any nutritional deficiency § Predict possible")
 The purposes of food consumption surveys are: § to identify, predict and")

 National level § FBS § tracking trends in")
 Group/Individual § Describe diff in intake of food")

 Daily food consumption (food record & 24 H recall) and ‘usual’/average food")


 24 -hour recall § Asking subject to recall and describe all intakes")

 Food frequency questionnaire (FFQ) § Provide information about how often certain foods")

 Diet History § Assess individual usual dietary intake over an extended period")

 Has been used as simple measure of diet quality Some")


- Slides: 36
SURVEY KONSUMSI PANGAN PERTEMUAN 1 DUDUNG ANGKASA PROGRAM STUDI ILMU GIZI-FIKES
VISI DAN MISI UNIVERSITAS ESA UNGGUL
KEMAMPUAN AKHIR YANG DIHARAPKAN Mahasiswa dapat menjelaskan fungsi dan informasi yang didapatkan dari survey konsumsi pangan
SURVEY KONSUMSI PANGAN Presented by: Dudung Angkasa
KONTRAK PERKULIAHAN (1/2) Nama MK SKS Pengampu Buku wajib : Survey Konsumsi Pangan : 2 sks (1 -1), ada praktikum, tidak ada online : Dudung Angkasa dan TIM : § Gibson, R. S. , 2005. Principles of nutritional assessment. Oxford university press, USA. Buku/journal tambahan § National Research Council, 1989. Diet and health: implications for reducing chronic disease risk. National Academies Press. § FAO. 2004. Uses of Food Consumption and Anthropometric Surveys in the Caribbean. Rome. Italy
KONTRAK PERKULIAHAN (2/2) Capaian Pembelajaran Mahasiswa mampu mengetahui fungsi survey konsumsi pangan Mahasiswa mampu memahami kelebihan dan kekurangan metode-metode survey konsumsi pangan Mahasiswa mampu memilih metode survey konsumsi pangan yang tepat sesuai tujuan penelitian Mahasiswa mampu melakukan validasi relatif antar metode asupan
TOTAL DIET STUDY (FDA) CFSAN/Office of Analytics and Outreach The Total Diet Study (TDS) is an ongoing FDA program that monitors levels of about 800 contaminants and nutrients in the average U. S. diet; the number varies slightly from year to year. To conduct the study, we buy, prepare, and analyze about 280 kinds of foods and beverages from representative areas of the country, four times a year. Using these data, we estimate how much of the contaminants and nutrients the entire U. S. population, some subpopulations, and each person consumes annually, on average. Because eating patterns may change over time, we update the list of foods to be analyzed about every 10 years; for example, we revise the list of foods to be tested, to account for trends in what consumers eat, and we use current data on how much of those foods consumers eat. FDA uses the TDS results in various ways; for example, along with other sources, they suggest potential areas of focus for our food-safety and nutrition programs. https: //www. fda. gov/foodscienceresearch/totaldietstudy/default. htm
OUTLINES The purposes and rationale for dietary assessment Level of Food Consumption Data
INTRODUCTION (1/2) Dietary assessment § First sign of any nutritional deficiency § Predict possible nutrient def § Confirmed by biochemical, clinical and anthrop § Useful for developing food-based dietary guidelines / intervention
INTRODUCTION (2/2) The purposes of food consumption surveys are: § to identify, predict and detect chronic or acute food and nutritional problems; § to target population groups for both short-term relief efforts and longer-term policy and programme development; § to plan and implement food and nutritional programmes and interventions; § to monitor changes and evaluate the impact of interventions and programmes.
MAJOR REASONS FOR MEASURING DIET Assess and monitor food and nutrient intake Formulate and evaluate gov health and agricultural policy Epidemiological research: diet-health Assist in commercial purposes
LEVEL OF FOOD CONSUMPTION DATA (1/2) National level § FBS § tracking trends in food supply § Expressed as per capita Households § Food account, inventories and household recall § Comparing food availability among diff communities, geographic area, socio-economic group § Tracking dietary change § But, no data on individual members distribution
LEVEL OF FOOD CONSUMPTION DATA (2/2) Group/Individual § Describe diff in intake of food and nutrients between subgroups § Depend on the ability of subject to provide accurate information § e. g food records, 24 -hours recalls, FFQ etc.
HOUSEHOLDS Food Account § Record detail of food quantities: purchasing, home produced, gift, and from other sources § No account of food stock is taken Inventory Method § Similary to food account but consider the stored food Household record § The foods presented for consumption to HH members are weighed or estimated in household measures (URT) § Appropriate for home produce population e. g farmer
INDIVIDUALS (1/4) Daily food consumption (food record & 24 H recall) and ‘usual’/average food consumption (diet history & FFQ) Food records or diary § measured at the time of eating § food intake is quantified by estimation or using household measures § Might be self reported § Usually ranging from 1 to 7 days § If food are weighed food record
FOOD RECORD VS WEIGHED FOOD RECORD Food Record § § § Use HH measurer (URT): amount of food and leftovers Researchers quantify the measure by volume and weight Preferred by researcher for group intake data Less accurate than WFR Less burden than WFR high cooperation WFR § § § Use scale or computerized tecnique More accurate than FR Preferred by some researcher for individual data Requires a greater degree of cooperation Costly scale
STRENGTH VS LIMITATION • Strengths • Does not depend on memory • Can provide detail memory • Can provide about eating habits • Multiple-day data more representative for usual diet • Reasonably valid up to 5 days • Limitation • Requires high degree of cooperation • Response burden can result in low response • Subject must be literate • Take more time to obtain data • Act of recording may alter diet • Analysis is labor intensive and expensive
EXAMPLE OF FOOD RECORD
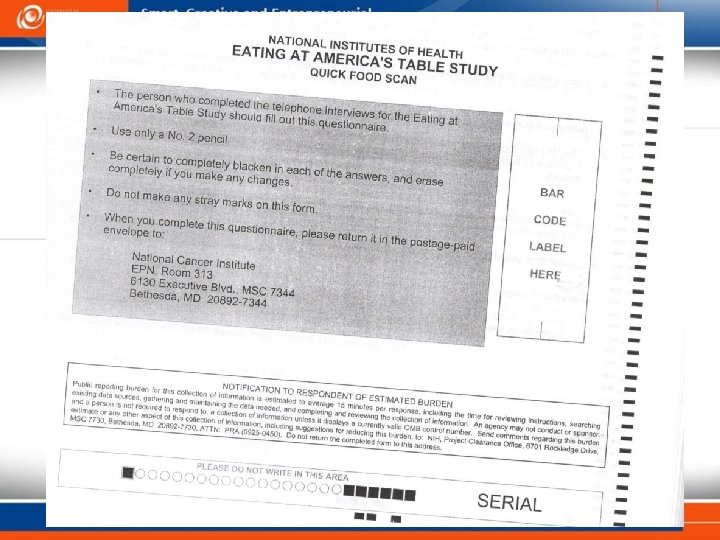
INDIVIDUALS (2/4) 24 -hour recall § Asking subject to recall and describe all intakes of food and drink in the previous 24 hour § Required a trained fieldworker/dietitian/nutritionist (interview, asses portion, detail of food) § Cheap and easy but prone to reporting errors, including bias or inaccurate recall of food intakes and portion sizes
STRENGTH VS LIMITATION Strengths § Inexpensive; Easy to administer § Provide detailed information on type of food § Low respondent burden; Probability sampling possible § Can be used to estimate nutrient intake of groups § Multiple recalls estimate nutrient intake of individual § More objective than dietary history § Does not alter usual diet; Useful in clinical setting • Limitation • Single recall not representative of usual intake • Under/over reporting • Relies on memory • Omission of dressing, sauces, and beverage can lead to low estimate of energy intake • Data entry can be labor intensive
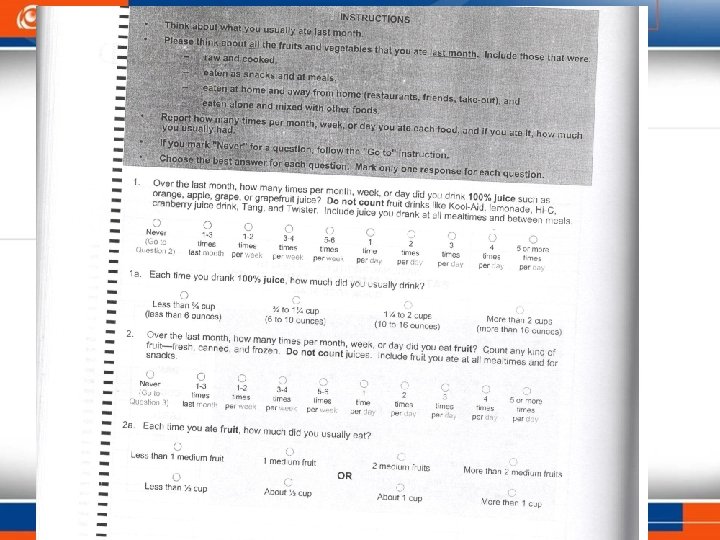
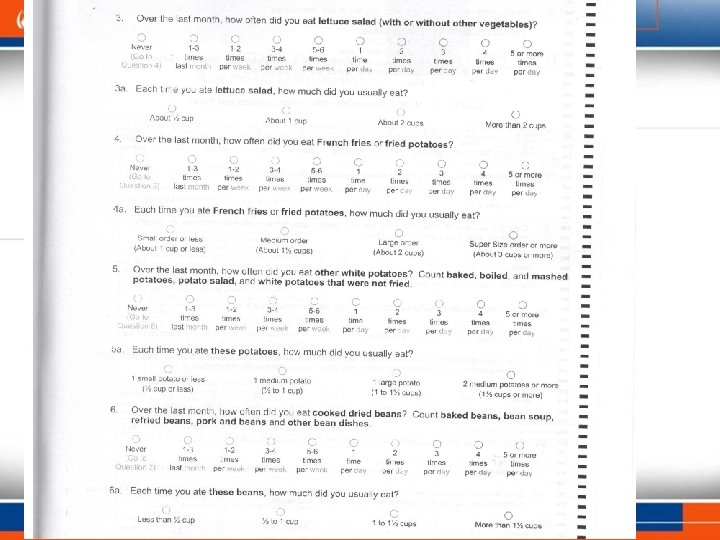
INDIVIDUALS (3/4) Food frequency questionnaire (FFQ) § Provide information about how often certain foods or food from given food groups, were eaten during a time interval in the past § Might be self-administered § Food list from a few questions was used to capture intake of selected foods and nutrients § The frequency can be open-ended or multiple choice § Simpler and quicker administration and processing, and subsequently lower costs as well as less burden § To quantify SQ-FFQ § Inaccuracies inadequate listing of possible foods, error in estimating portion and the usual frequency of food consumption
STRENGTH VS LIMITATION Strengths § Can be self-administered but better if trained personal did § Machine readable § Modest demand on time and energy of respondent § Generate estimate usual intake than a few diet records § Relatively inexpensive for large sample sizes § Considered by some researcher as the method of choice to asses on dietdisease relationship • Limitation • Limited food list must be representative of the most common food consumed by respondent • Short questionnaire are faster and easier but less comprehensive • Longer may be tedious to complete • Culturally sensitive failure to include unique food under estimate • Depend on the ability of subject to describe food
INDIVIDUALS (4/4) Diet History § Assess individual usual dietary intake over an extended period of time (a month, a year) § It is originally developed by Burke (1940) § § Collect general information about respondent’s health Question about his/her usual eating pattern Perform a cross-check on the data given in step 2 Have the respondent to complete a 3 -day food record § Asking for number of meals eaten per day, appetite, food dislike, presence or absence of nausea and vomiting, use of supplement, cigarette smoking, habit related to sleep, rest, work, and exercise, etc § Followed by a 24 H food recall
STRENGTH VS LIMITATION Strengths § Assess usual nutrient intake § Can detect seasonal change § Data on all nutrient can be obtained § Can correlate well with biochemical measures • Limitation • Lengthy interview process • Requires highly trained interviewers • Difficult and expensive to code • May tend to overestimate nutrient intake • Requires cooperative respondent with ability to recall usual diet
DDS (DIETARY DIVERSITY SCORE) Has been used as simple measure of diet quality Some studies showed HH DDS correlated to dietary energy availability Individual DDS + correlated with adequacy of micronutrient intake
DUPLICATE FOOD COLLECTIONS Participant place identical portion of all foods and beverages consumed Then chemically analyzed at laboratory Handling with refrigeration to avoid microbiological decomposition
STRENGTH VS LIMITATION Strengths § Can provide more accurate measurment of actual nutrient intake than calculation of FCT • Limitation • Expense and effort of preparing more food • Effort and time to collect duplicate samples • May underestimate usual intake
THANK YOU