Structural Equation Modeling using MPlus 04 11 Yaeeun

 does not designate a")


: Badness of fit")


 TITLE: this is an example of")
. Principles and practice of structural equation modeling (3")
- Slides: 21
Structural Equation Modeling using MPlus 04. 11 Yaeeun Kim
Characteristics of SEM • The term structural equation modeling (SEM) does not designate a single statistical technique but instead refers to a family of related procedures. Other terms such as covariance structure analysis, covariance structure modeling, or analysis of covariance structures are also used in the literature to classify these techniques together under a single label. • There are two broad classes of variables in SEM, observed and latent. The observed class represents your data—that is, variables for which you have collected scores and entered in a data file. • The whole of the general linear model (GLM) can be seen as just a restricted case of SEM.
Research Questions & SEM • • • Confirmatory Factor Analysis. Path Models with Latent Variables. Latent Class Analysis. Models of Growth Trajectories. Model Differences between Groups.
Model Estimation • Use a model-fitting program to derive estimates of model parameters (Amos, EQS, LISREL, Mplus). • Maximum Likelihood (ML) is by far the most widely used estimation procedure. • However, ML assumes multivariate normality. If the data are not MVN, then other procedures can be used (e. g. Satorra-Bentler adjustment)
ML • The term maximum likelihood describes the statistical principle that underlies the derivation of parameter estimates; the estimates are the ones that maximize the likelihood (the continuous generalization) that the data (the observed covariances) were drawn from this population. • The method of ML estimation method is the default in most SEM computer programs, and most structural equation models described in the literature analyzed with this method.
Assessing Model Fit • Determine how well the model accounts for the observed variances and covariances of the measured variables. • Fit Indices: chi square, GFI, CFI, TLI, RMSEA, SRMR, and many others. • These indicate only the overall or average fit of the model, and do not indicate whether the results are theoretically meaningful.
Assumptions within SEM • Large samples: try to obtain a 10: 1 ratio of number of subjects to number of model parameters. • Variables are typically at interval or ratio level of measurement, although not necessarily. • Mplus program designed to analyze categorical variables • Approximately multivariate normal distribution.
Flow chart of basic steps of SEM
Model diagram symbols • 1. Observed variables with squares or rectangles (e. g. , ). • 2. Latent variables with circles or ellipses (e. g. , ). • 3. Hypothesized directional effects of one variable on another, or direct effects, with a line with a single arrowhead (e. g. , →). • 4. Covariances (in the unstandardized solution) or correlations (in the standardized one) between independent variables—referred to in SEM as exogenous variables—with a curved line with two arrowheads ( ).
latent variable r 1 CFA Nervous Not Calm error r 2 r 3 Tired Out Effort Anxiety r 4 Can’t Sit Still Restless r 5 r 6 Worthless r 7 Depression Can’t Cheer Up Depressed Hopeless r 10 r 8 r 9
Path Model with Latent Variables Family Conflict Child Parent Observer Child Depression Child Age Child Observer Child Gender Parent
Unstandardized estimates
Standardized estimates
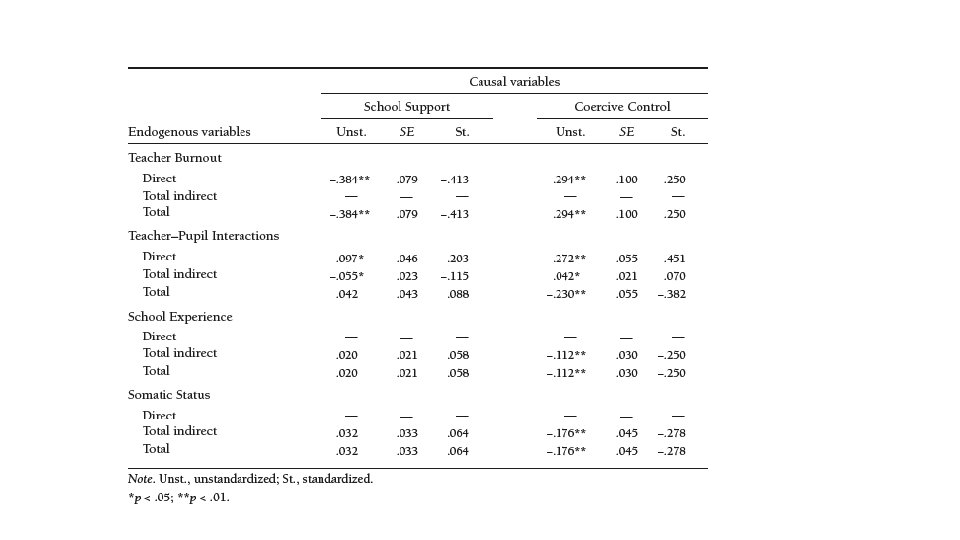
Maximum Likelihood Estimates for a Recursive Path Model of Causes and Effects -. 384; This means that a 1 -point increa on the school support variable predicts a. 384 -point decrease on the burnout variable, controlling coercive control. z = –. 384/. 079 = 4. 86, which exceeds the critical value for two tailed statistical significance at t. 01 level, or 2. 58. A level of school support one full standard deviation above the mean predicts a burnout level just over. 40 standard deviations below the mean, holding coercive control constant
Model fit result • Root Mean Square Error of Approximation (RMSEA): Badness of fit indicator Close-fit hypothesis Is RMSEA <=. 05 Poor-fit hypothesis Is RMSEA >=. 10 • Goodness of Fit Index (GFI): Estimates the proportion of data covariances explained by the model. Similar to R 2 in OLS regression • Comparative Fit Index (CFI): Measures the relative improvement of your model over that of a baseline model. • Standardized Root Mean Square Residual (SRMR): Assesses the overall difference between the observed and predicted correlations. Values >. 08 indicate poor fit
Mplus User’s Guide Ex 3. 11
Mplus Syntax for Ex 3. 11 TITLE: this is an example of a path analysis with continuous dependent variables DATA: FILE IS ex 3. 11. dat; VARIABLE: NAMES ARE y 1 -y 3 x 1 -x 3; MODEL: y 1 y 2 ON x 1 x 2 x 3; y 3 ON y 1 y 2 x 2;
Testing Indirect Effects TITLE: this is an example of a path analysis with continuous dependent variables DATA: FILE IS ex 3. 11. dat; VARIABLE: NAMES ARE y 1 -y 3 x 1 -x 3; MODEL: y 1 y 2 ON x 1 x 2 x 3; y 3 ON y 1 y 2 x 2; MODEL INDIRECT: y 3 IND y 1 x 1; y 3 IND y 2 x 1;
With categorical dependent variables (binary or ordered responses) TITLE: this is an example of a path analysis with categorical dependent variables DATA: FILE IS ex 3. 12. dat; VARIABLE: NAMES ARE u 1 -u 3 x 1 -x 3; CATEGORICAL ARE u 1 -u 3 MODEL: u 1 u 2 ON x 1 x 2 x 3; u 3 ON u 1 u 2 x 2;
Reference • Kline, R. B. (2011). Principles and practice of structural equation modeling (3 rd Ed). New York: Guilford Press). • Psychology 8032 Structural Equation Modeling course lecture note.