Stock Value Ratio Classification Yan Sui Zheng Chai


 l l Consists of 30 of")


 l l")


")


 attributes Try other evaluation functions")

- Slides: 27
Stock Value Ratio Classification Yan Sui Zheng Chai
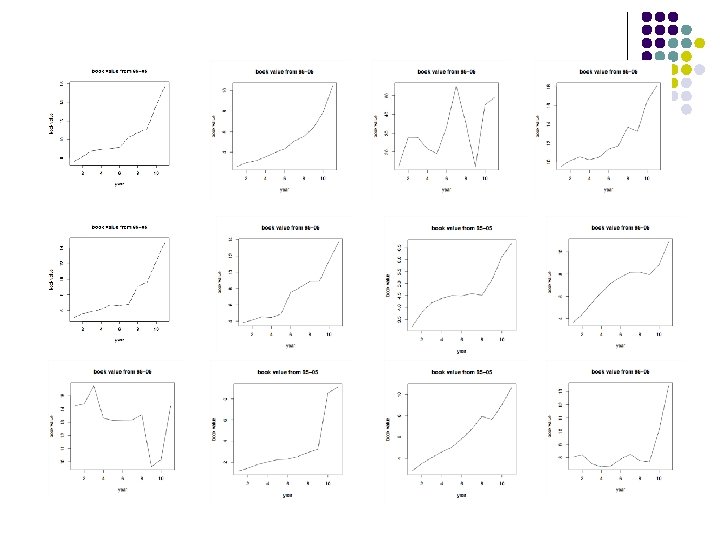
Classification l l MKV/BKV is an indicator of investors’ confidence in a particular company Being able to predict this ratio gives insight to predicting the stock prices
Outline l l l Define Problem Data Method Initial Result Discussion
Definition l Market Value l l The current quoted price at which investors buy or sell a share of common stock or a bond at a given time. Also known as "market price". Book Value l l l The accounting value of a firm. The total value of the company's assets that shareholders would theoretically receive if a company were liquidated. Per share: total value divided by number of shares
Problem Definition l l l Given training data, predict the ratio for the future Classification vs Prediction Problem Need to define the classes (more later)
Problem Definition l l Why do we can about the ratio? Book value stays relatively constant and could be estimated Could estimate market price if we know this ratio and estimated book value
Outline l l l Define Problem Data Method Initial Result Discussion
Data l Dow Jones Industrial Average (Dow 30) l l Consists of 30 of the largest and most widely held public companies in the United States. E. g. American Express, AT&T, Boeing, Citigroup, Exxon Mobil, GM, GE, Intel, etc.
Data l l l wrds from Wharton Attributes are from CRSP/COMPUSTAT Merged database Book value and market value are from COMPUSTAT North America database l High, low, and closing prices for each month are available
Problem… l Book value is updated annually l l Market value is updated daily l l 1 per year 365 per year What can we do?
Our Approach l l l Estimate “annual market price” of a stock by averaging its high, low and closing prices over 12 months. Market value = estimated market price Another possibility: l Interpolate annual book values
Data Preprocessing l Data Cleaning ~400 attributes --> 68 attributes (possibly more) l l l Estimate annual market value Divide the MKV/BKV ratios into a number of classes Currently, there are 5 classes
1995 - 2005, 330 total observations
ratio class # of Ex R <= 2 0 20 2 < R <=4 1 114 4 < R <=6 2 97 6 < R <= 10 3 69 R > 10 4 30
Outline l l l Define Problem Data Method Initial Result Discussion
Attributes l l l Hundreds or even thousands possible attributes Using too many attributes may result in overfitting Want to select a subset that work best for the task
Attribute Selection l l Select a subset of attributes to use Algorithms considered l l Greedy Algorithm Genetic Algorithm (genoud package in R)
Genetic Algorithm
Evaluation Function l l l Produce a score of how a particular subset of features work (error rate) Minimization problem Possible candidates l l l SVM Neural Network Etc.
Outline l l l Define Problem Data Method Initial Result Discussion
Classify on the training data using 10 features Error = abs(predicted - actual)
Number of features
Top features
Explanation of Result l l Works well on training set When applied on new data, accuracy is around 40 -50%
To Do List l l l Retain more (non-atomic) attributes Try other evaluation functions Classification on daily ratio Other feature selection algorithms? Hopefully, find out which features are more influential in predicting market price for some stocks
Question?